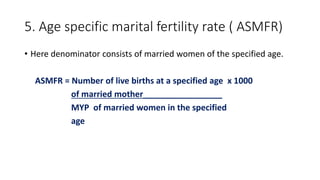
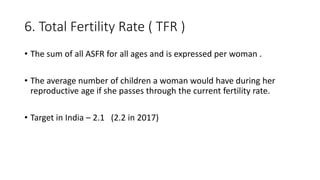
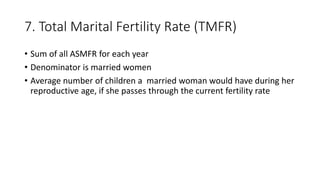
Fertility Indicators
Dr.Divija Vijith
Department of Community Medicine
Sree Gokulam Medical College and Research Foundation
Definition of Fertility
• In demography, fertility defined as the product of reproduction and
refers to live births.
• Fecundity- The physiological ability to bear children
• Infertility – absence of live born children (whether or not pregnancy
has occurred)
• Fecundability –probability of becoming pregnant, that depends on
pattern of sexual and pregnancy preventive behaviours.
Ref: The Demography of fertility and infertility – O Frank
Factors affecting fertility of an individual
• Age at marriage – Earlier marriage
• Duration of married life –Longer duration of married life
• Birth Interval - Shorter interval between pregnancies
• Other factors – Education and economic status of the family,
Empowerment of women, urbanization, Child rearing practices,
Socioeconomic development of a country.
Increase
Fertility
Measurement of Fertility ( Fertility Indicators)
• Crude Birth Rate
• General Fertility Rate
• General Marital Fertiilty Rate
• Age specific fertility rate
• Age specific marital fertility rate
• Total fertility rate
• Total marital fertility rate
Measurement of Fertility ( Fertility Indicators)
• Gross reproduction rate
• Net reproduction rate
• Child woman ratio
• Pregnancy rate
• Abortion rate
• Abortion ratio
1.Crude Birth Rate (CBR)
• Simply called the Birth Rate
• Number of LB/1000 Mid Year Population (MYP) in a given area during a
given year ( India in 2020 – 18.2/1000MYP)
CBR= No of Live Births x 1000
Mid Year Population
• Higher the CBR – Higher is the fertility
• Disadvantage– Denominator includes population not exposed to child
bearing such as children, elderly
2.General Fertility Rate (GFR)
• Number of Live Births per 1000 women of reproductive age (15-49 years)
irrespective of their marital status
• Denominator restricted to women of child bearing age – therefore a better
indicator than CBR
GFR= ______ Number of live births _______________ x 1000
MYP of women in child bearing age (15 -49 years)
• India- 76.2 children born to every thousand women aged 15-49 years.
( Rural -83.8 and Urban – 60.8 )(2015 SRS)
• Limitation – Not all women in reproductive age group are exposed to risk
of child birth ( unmarried women)
3.General Marital Fertility Rate (GMFR)
• Here , denominator consists of only married women in the
reproductive age, during the given year.
GMFR =___________Number of live births_______________ x 1000
MYP of married women in the reproductive age group
4. Age Specific Fertility Rate (ASFR)
• The denominator consists of women in any specific age group. –
hence more precise
ASFR = Number of live births during a year at a specified x 1000
age of a mother___________________________
MYP of women in the same specified reproductive
age
Advantage: We can evaluate in which age group family welfare services
need to be concentrated.
5. Age specific marital fertility rate ( ASMFR)
• Here denominator consists of married women of the specified age.
ASMFR = Number of live births at a specified age x 1000
of married mother_________________
MYP of married women in the specified
age
6. Total Fertility Rate ( TFR )
• The sum of all ASFR for all ages and is expressed per woman .
• The average number of children a woman would have during her
reproductive age if she passes through the current fertility rate.
• Target in India – 2.1 (2.2 in 2017)
7. Total Marital Fertility Rate (TMFR)
• Sum of all ASMFR for each year
• Denominator is married women
• Average number of children a married woman would have during her
reproductive age, if she passes through the current fertility rate
8. Gross Reproduction Rate (GRR)
• Average number of girls that would be born to a woman during her
reproductive age if she experiences current fertility rate without dying
GRR= Number of female live births x 1000
Total number of live births
GRR (In 2020) =1.1
9. Net Reproduction Rate (NRR)
• Average number of female children a newborn girl will bear during
her reproductive age assuming fixed age specific fertility and
mortality rates.
• The measure to the extent to which mothers produce female infants
who survive to replace them
• IF NRR=1 it means female population is maintained exactly and
population remains almost constant.
• If NRR <1 , it means population will decrease and if > 1 population will
increase.
9. Net Reproduction Rate (NRR)
• In India NRR=1.6 (2020)
• NRR of 1 can be achieved only if 60% of eligible couples practice one
or the other method of family planning.
• Based on observation that 50 to 60% of births are of birth order three
or more
• Therefore attaining a 60% CPR will be equivalent to cutting off almost
third or higher order of births therefore leaving 2 or less than 2
surviving children per couple.
10. Child Woman Ratio
• Number of children between 0 and 4 years per 100 women of
reproductive age group during a given year .
• CWR= Number of children between 0 and 4 years x 1000
Number of women of reproductive age
This measure of fertility is useful where birth registration is poor.
11. Pregnancy Rate
• The number of pregnancies occurring irrespective of the outcomes,
such as abortions, stillbirths,or live births per 1000 married women of
reproductive age group during a given year.
PR = Number of pregnancies occurring during a year x 1000
Number of married woman of reproductive age
11. Pregnancy rate continued ……
• The PR is also employed to assess the failure rate of contraception. It
is expressed per 100 women years. (100 x 12 =1200 months)
• Pearl Index ( failure rate of contraception)=
Number of pregnancies occurring in a year x 1000
Total months of exposure
12. Abortion Rate and Abortion Ratio
Abortion Rate : The number of abortions occurring during a given year
per 1000 women of reproductive age .
Abortion Ratio: It is the ratio between the number of abortions
occurring in a given year and the number of live births.
References
1. O Frank. The Demography of Fertility and Infertility.
2. AH Suryakantha. Community Medicine with Recent Advances.
3. Estimates of Fertility Indicators. SRS 2015
Thank you

Fertility indicators

  • 1.
    Fertility Indicators Dr.Divija Vijith Departmentof Community Medicine Sree Gokulam Medical College and Research Foundation
  • 2.
    Definition of Fertility •In demography, fertility defined as the product of reproduction and refers to live births. • Fecundity- The physiological ability to bear children • Infertility – absence of live born children (whether or not pregnancy has occurred) • Fecundability –probability of becoming pregnant, that depends on pattern of sexual and pregnancy preventive behaviours. Ref: The Demography of fertility and infertility – O Frank
  • 3.
    Factors affecting fertilityof an individual • Age at marriage – Earlier marriage • Duration of married life –Longer duration of married life • Birth Interval - Shorter interval between pregnancies • Other factors – Education and economic status of the family, Empowerment of women, urbanization, Child rearing practices, Socioeconomic development of a country. Increase Fertility
  • 4.
    Measurement of Fertility( Fertility Indicators) • Crude Birth Rate • General Fertility Rate • General Marital Fertiilty Rate • Age specific fertility rate • Age specific marital fertility rate • Total fertility rate • Total marital fertility rate
  • 5.
    Measurement of Fertility( Fertility Indicators) • Gross reproduction rate • Net reproduction rate • Child woman ratio • Pregnancy rate • Abortion rate • Abortion ratio
  • 6.
    1.Crude Birth Rate(CBR) • Simply called the Birth Rate • Number of LB/1000 Mid Year Population (MYP) in a given area during a given year ( India in 2020 – 18.2/1000MYP) CBR= No of Live Births x 1000 Mid Year Population • Higher the CBR – Higher is the fertility • Disadvantage– Denominator includes population not exposed to child bearing such as children, elderly
  • 7.
    2.General Fertility Rate(GFR) • Number of Live Births per 1000 women of reproductive age (15-49 years) irrespective of their marital status • Denominator restricted to women of child bearing age – therefore a better indicator than CBR GFR= ______ Number of live births _______________ x 1000 MYP of women in child bearing age (15 -49 years) • India- 76.2 children born to every thousand women aged 15-49 years. ( Rural -83.8 and Urban – 60.8 )(2015 SRS) • Limitation – Not all women in reproductive age group are exposed to risk of child birth ( unmarried women)
  • 8.
    3.General Marital FertilityRate (GMFR) • Here , denominator consists of only married women in the reproductive age, during the given year. GMFR =___________Number of live births_______________ x 1000 MYP of married women in the reproductive age group
  • 9.
    4. Age SpecificFertility Rate (ASFR) • The denominator consists of women in any specific age group. – hence more precise ASFR = Number of live births during a year at a specified x 1000 age of a mother___________________________ MYP of women in the same specified reproductive age Advantage: We can evaluate in which age group family welfare services need to be concentrated.
  • 11.
    5. Age specificmarital fertility rate ( ASMFR) • Here denominator consists of married women of the specified age. ASMFR = Number of live births at a specified age x 1000 of married mother_________________ MYP of married women in the specified age
  • 12.
    6. Total FertilityRate ( TFR ) • The sum of all ASFR for all ages and is expressed per woman . • The average number of children a woman would have during her reproductive age if she passes through the current fertility rate. • Target in India – 2.1 (2.2 in 2017)
  • 13.
    7. Total MaritalFertility Rate (TMFR) • Sum of all ASMFR for each year • Denominator is married women • Average number of children a married woman would have during her reproductive age, if she passes through the current fertility rate
  • 14.
    8. Gross ReproductionRate (GRR) • Average number of girls that would be born to a woman during her reproductive age if she experiences current fertility rate without dying GRR= Number of female live births x 1000 Total number of live births GRR (In 2020) =1.1
  • 15.
    9. Net ReproductionRate (NRR) • Average number of female children a newborn girl will bear during her reproductive age assuming fixed age specific fertility and mortality rates. • The measure to the extent to which mothers produce female infants who survive to replace them • IF NRR=1 it means female population is maintained exactly and population remains almost constant. • If NRR <1 , it means population will decrease and if > 1 population will increase.
  • 16.
    9. Net ReproductionRate (NRR) • In India NRR=1.6 (2020) • NRR of 1 can be achieved only if 60% of eligible couples practice one or the other method of family planning. • Based on observation that 50 to 60% of births are of birth order three or more • Therefore attaining a 60% CPR will be equivalent to cutting off almost third or higher order of births therefore leaving 2 or less than 2 surviving children per couple.
  • 17.
    10. Child WomanRatio • Number of children between 0 and 4 years per 100 women of reproductive age group during a given year . • CWR= Number of children between 0 and 4 years x 1000 Number of women of reproductive age This measure of fertility is useful where birth registration is poor.
  • 18.
    11. Pregnancy Rate •The number of pregnancies occurring irrespective of the outcomes, such as abortions, stillbirths,or live births per 1000 married women of reproductive age group during a given year. PR = Number of pregnancies occurring during a year x 1000 Number of married woman of reproductive age
  • 19.
    11. Pregnancy ratecontinued …… • The PR is also employed to assess the failure rate of contraception. It is expressed per 100 women years. (100 x 12 =1200 months) • Pearl Index ( failure rate of contraception)= Number of pregnancies occurring in a year x 1000 Total months of exposure
  • 20.
    12. Abortion Rateand Abortion Ratio Abortion Rate : The number of abortions occurring during a given year per 1000 women of reproductive age . Abortion Ratio: It is the ratio between the number of abortions occurring in a given year and the number of live births.
  • 21.
    References 1. O Frank.The Demography of Fertility and Infertility. 2. AH Suryakantha. Community Medicine with Recent Advances. 3. Estimates of Fertility Indicators. SRS 2015
  • 22.