Downloaded 120 times

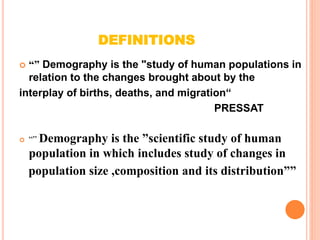


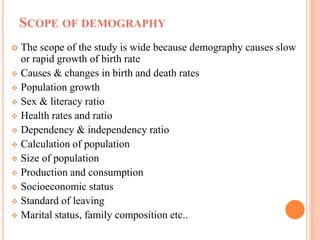


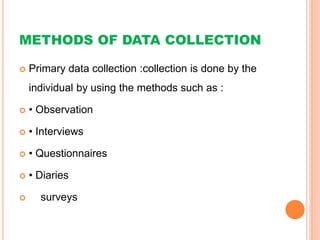
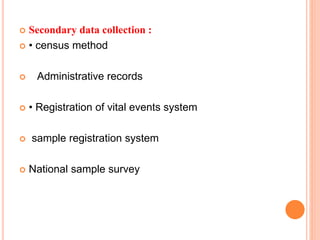


This document provides an overview of demography and its key concepts. It defines demography as the statistical study of human populations with regards to size, structure, and changes due to births, deaths, and migration. Some important elements of demography discussed include population size, composition by age and sex, and distribution across territories. Demographic data is important for planning health services, economic and social development, and formulating policies. Common demographic indicators mentioned are crude birth rate, death rate, and life expectancy. Methods of collecting demographic data include censuses, surveys, interviews, and reviewing vital records.