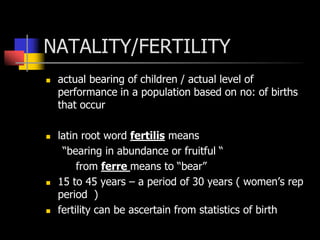
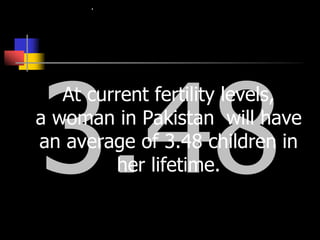
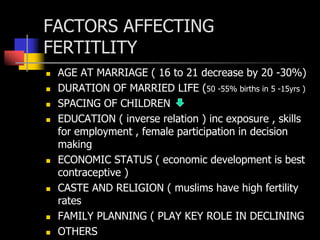
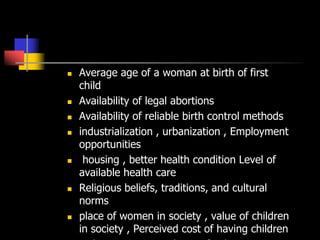
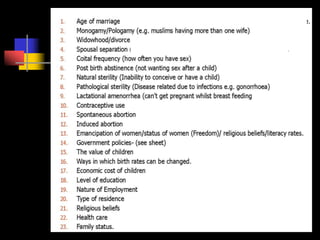
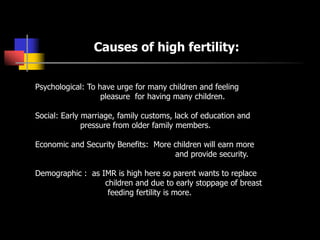
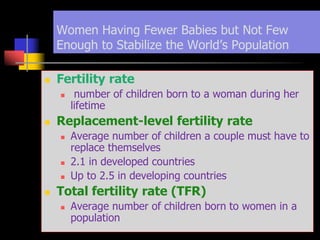
Fertility refers to the actual number of births that occur in a population. A woman's fertile period is typically between ages 15-45. In Pakistan currently, the average number of children born to a woman is 3.48.
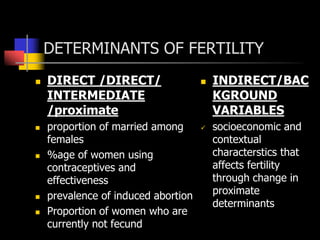
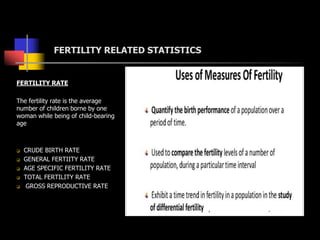
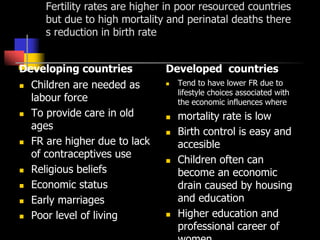
Factors that affect fertility include age at marriage, duration of married life, education levels, economic status, religion, and use of family planning. The document then discusses various metrics used to measure fertility, including the crude birth rate, general fertility rate, age-specific fertility rate, total fertility rate, and gross reproductive rate.