Downloaded 474 times
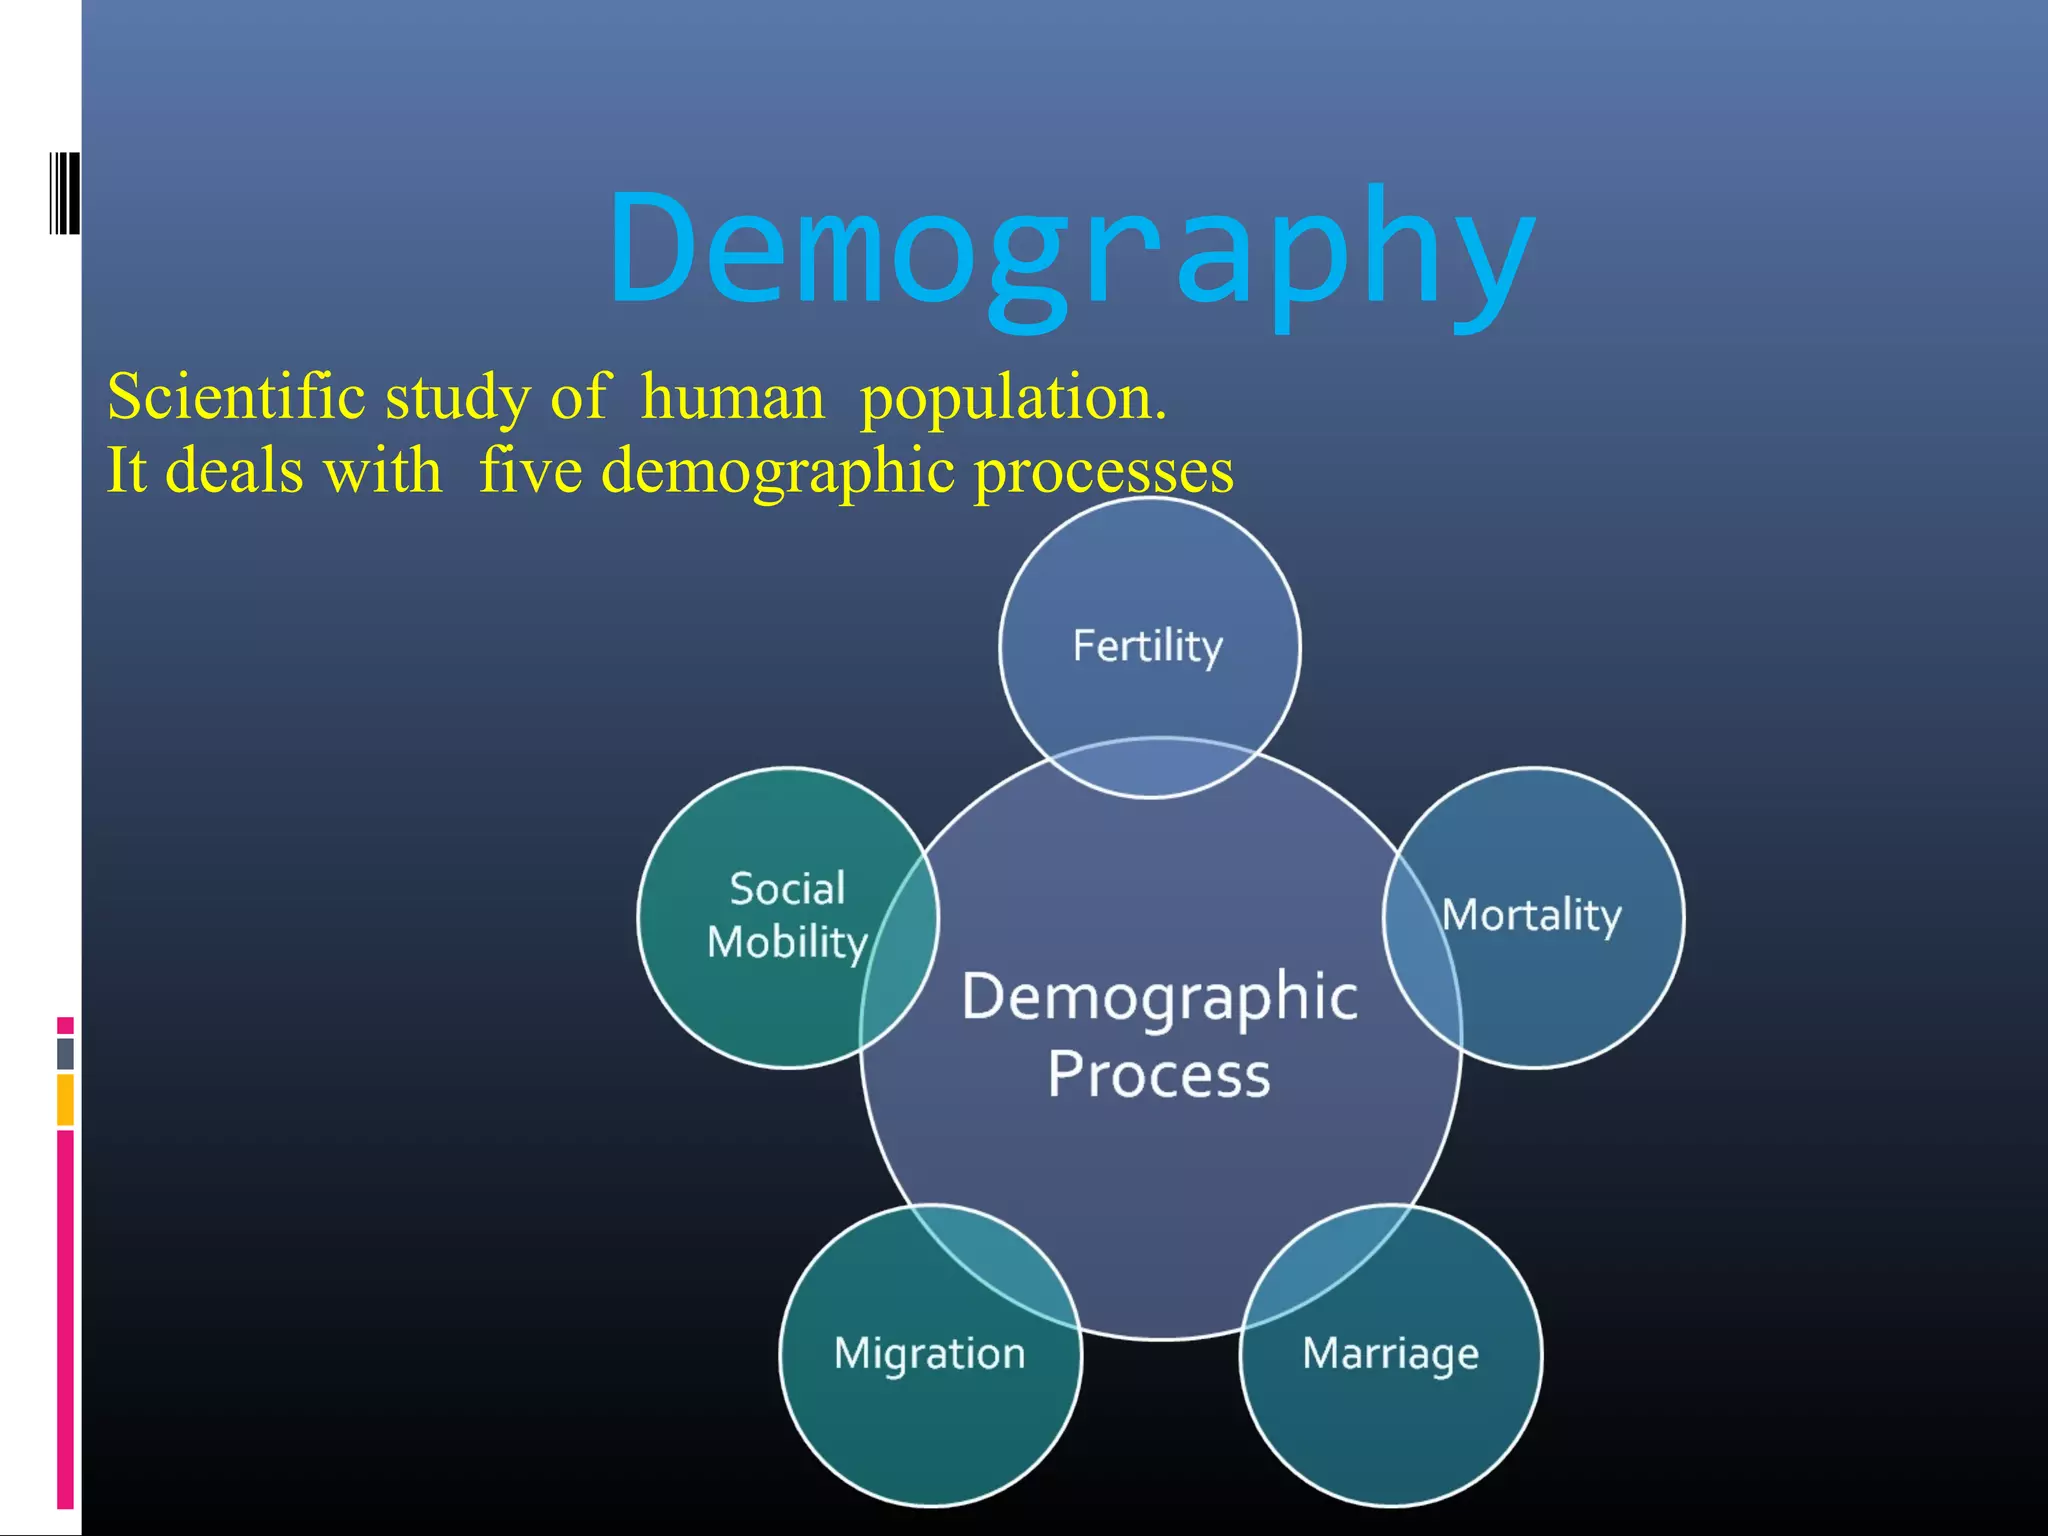
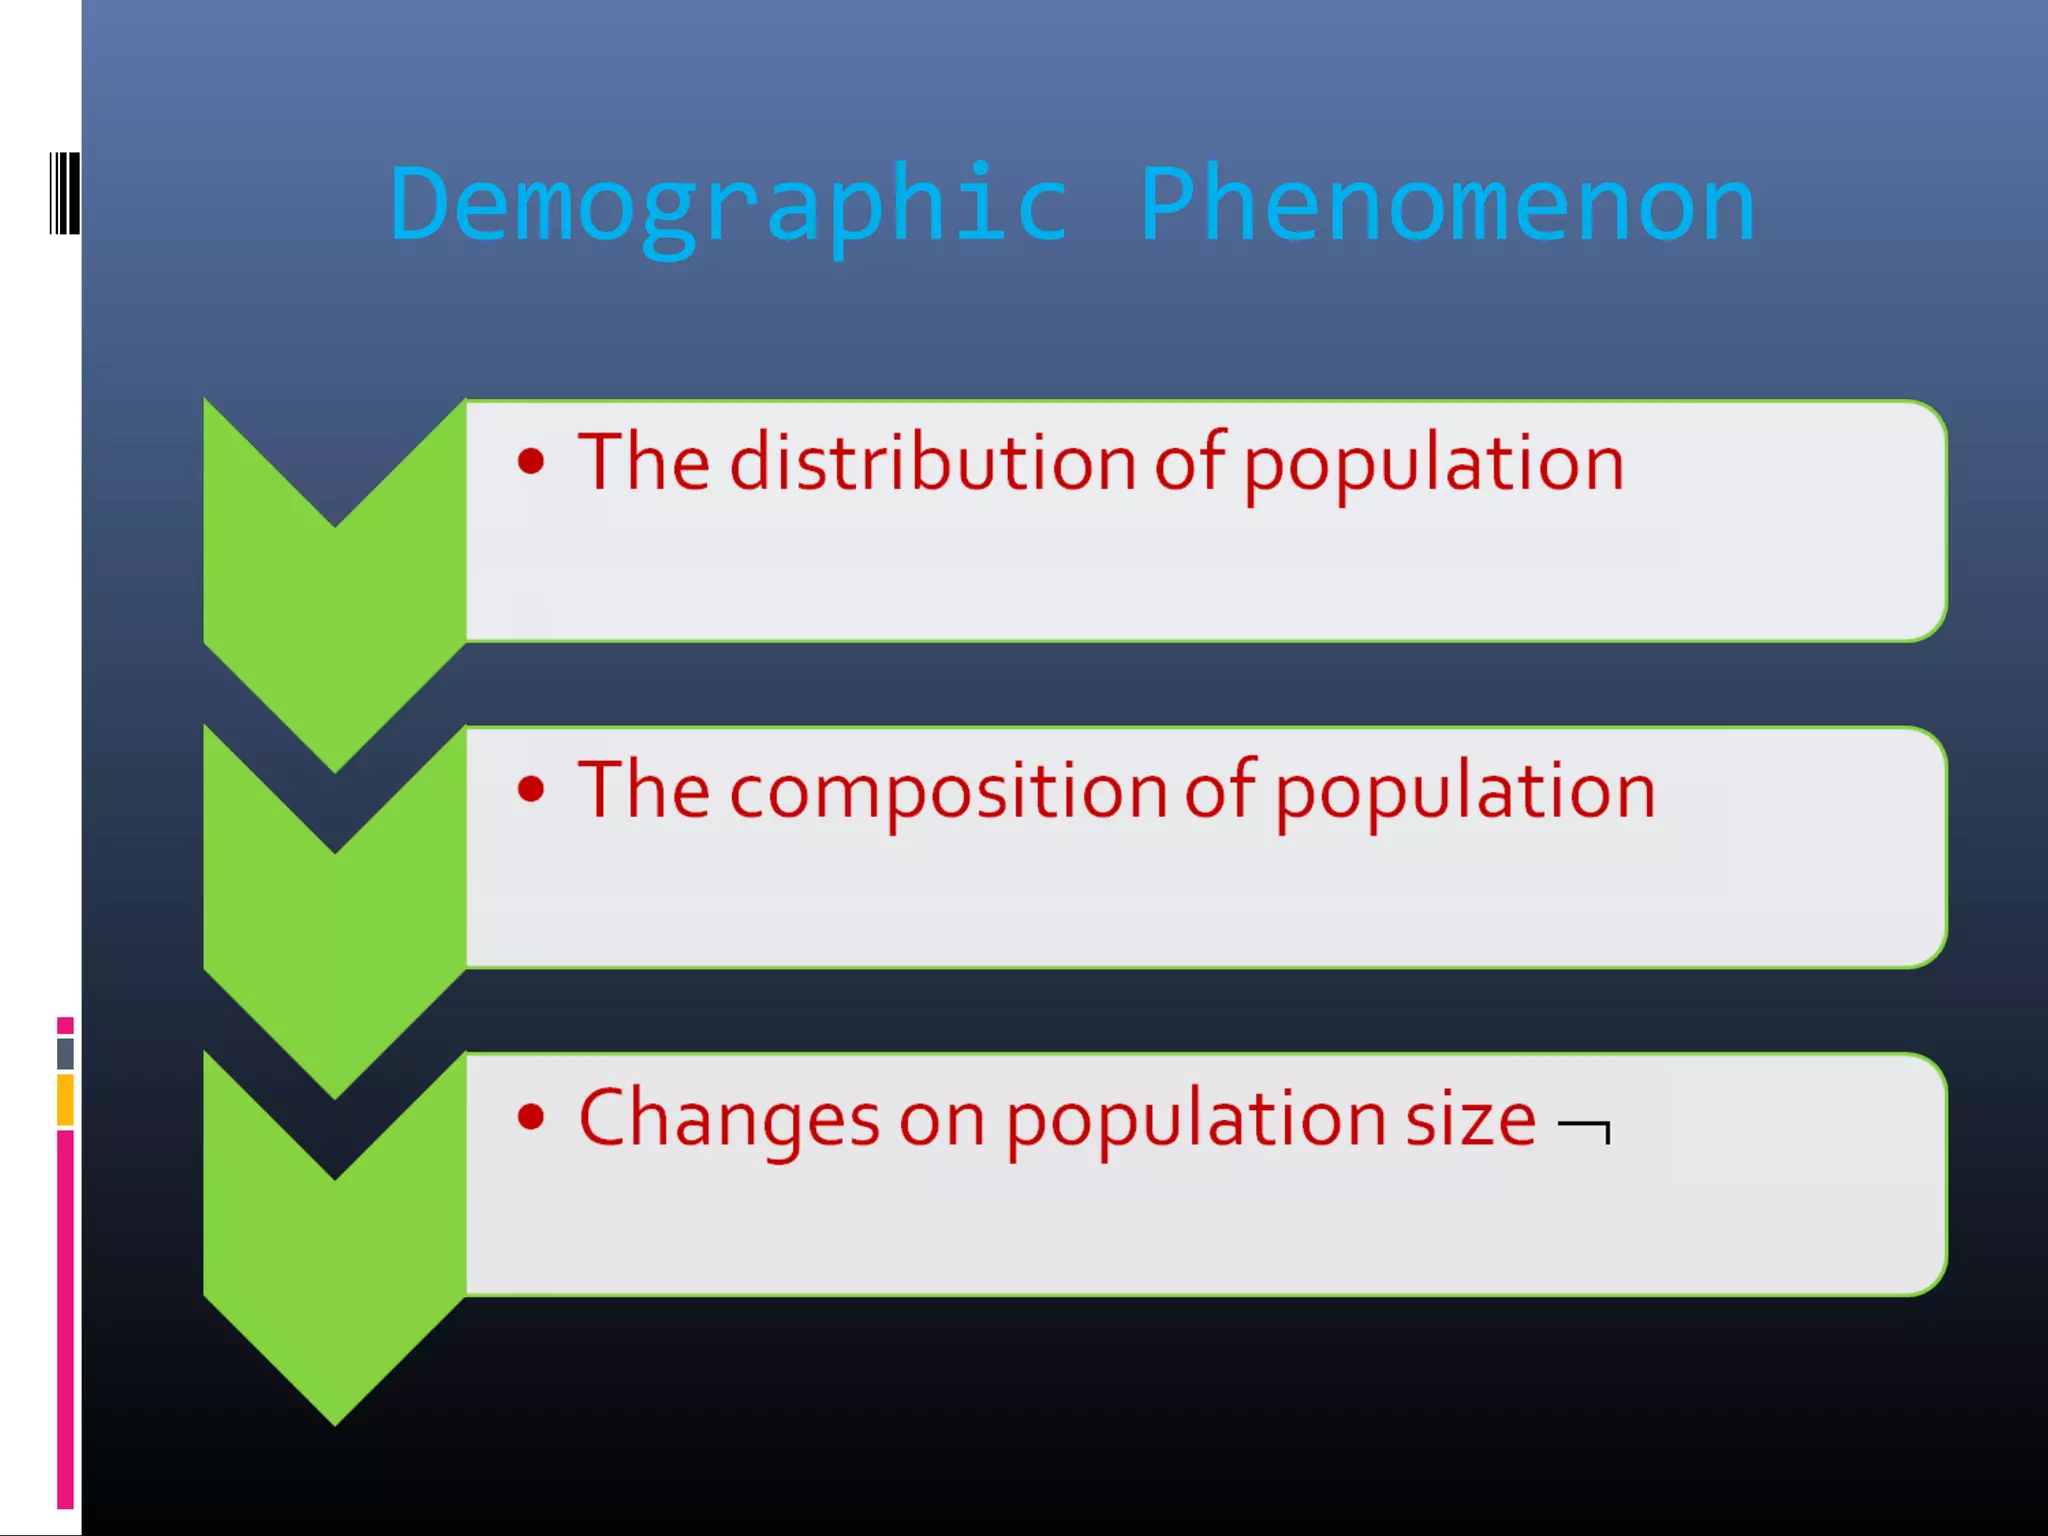
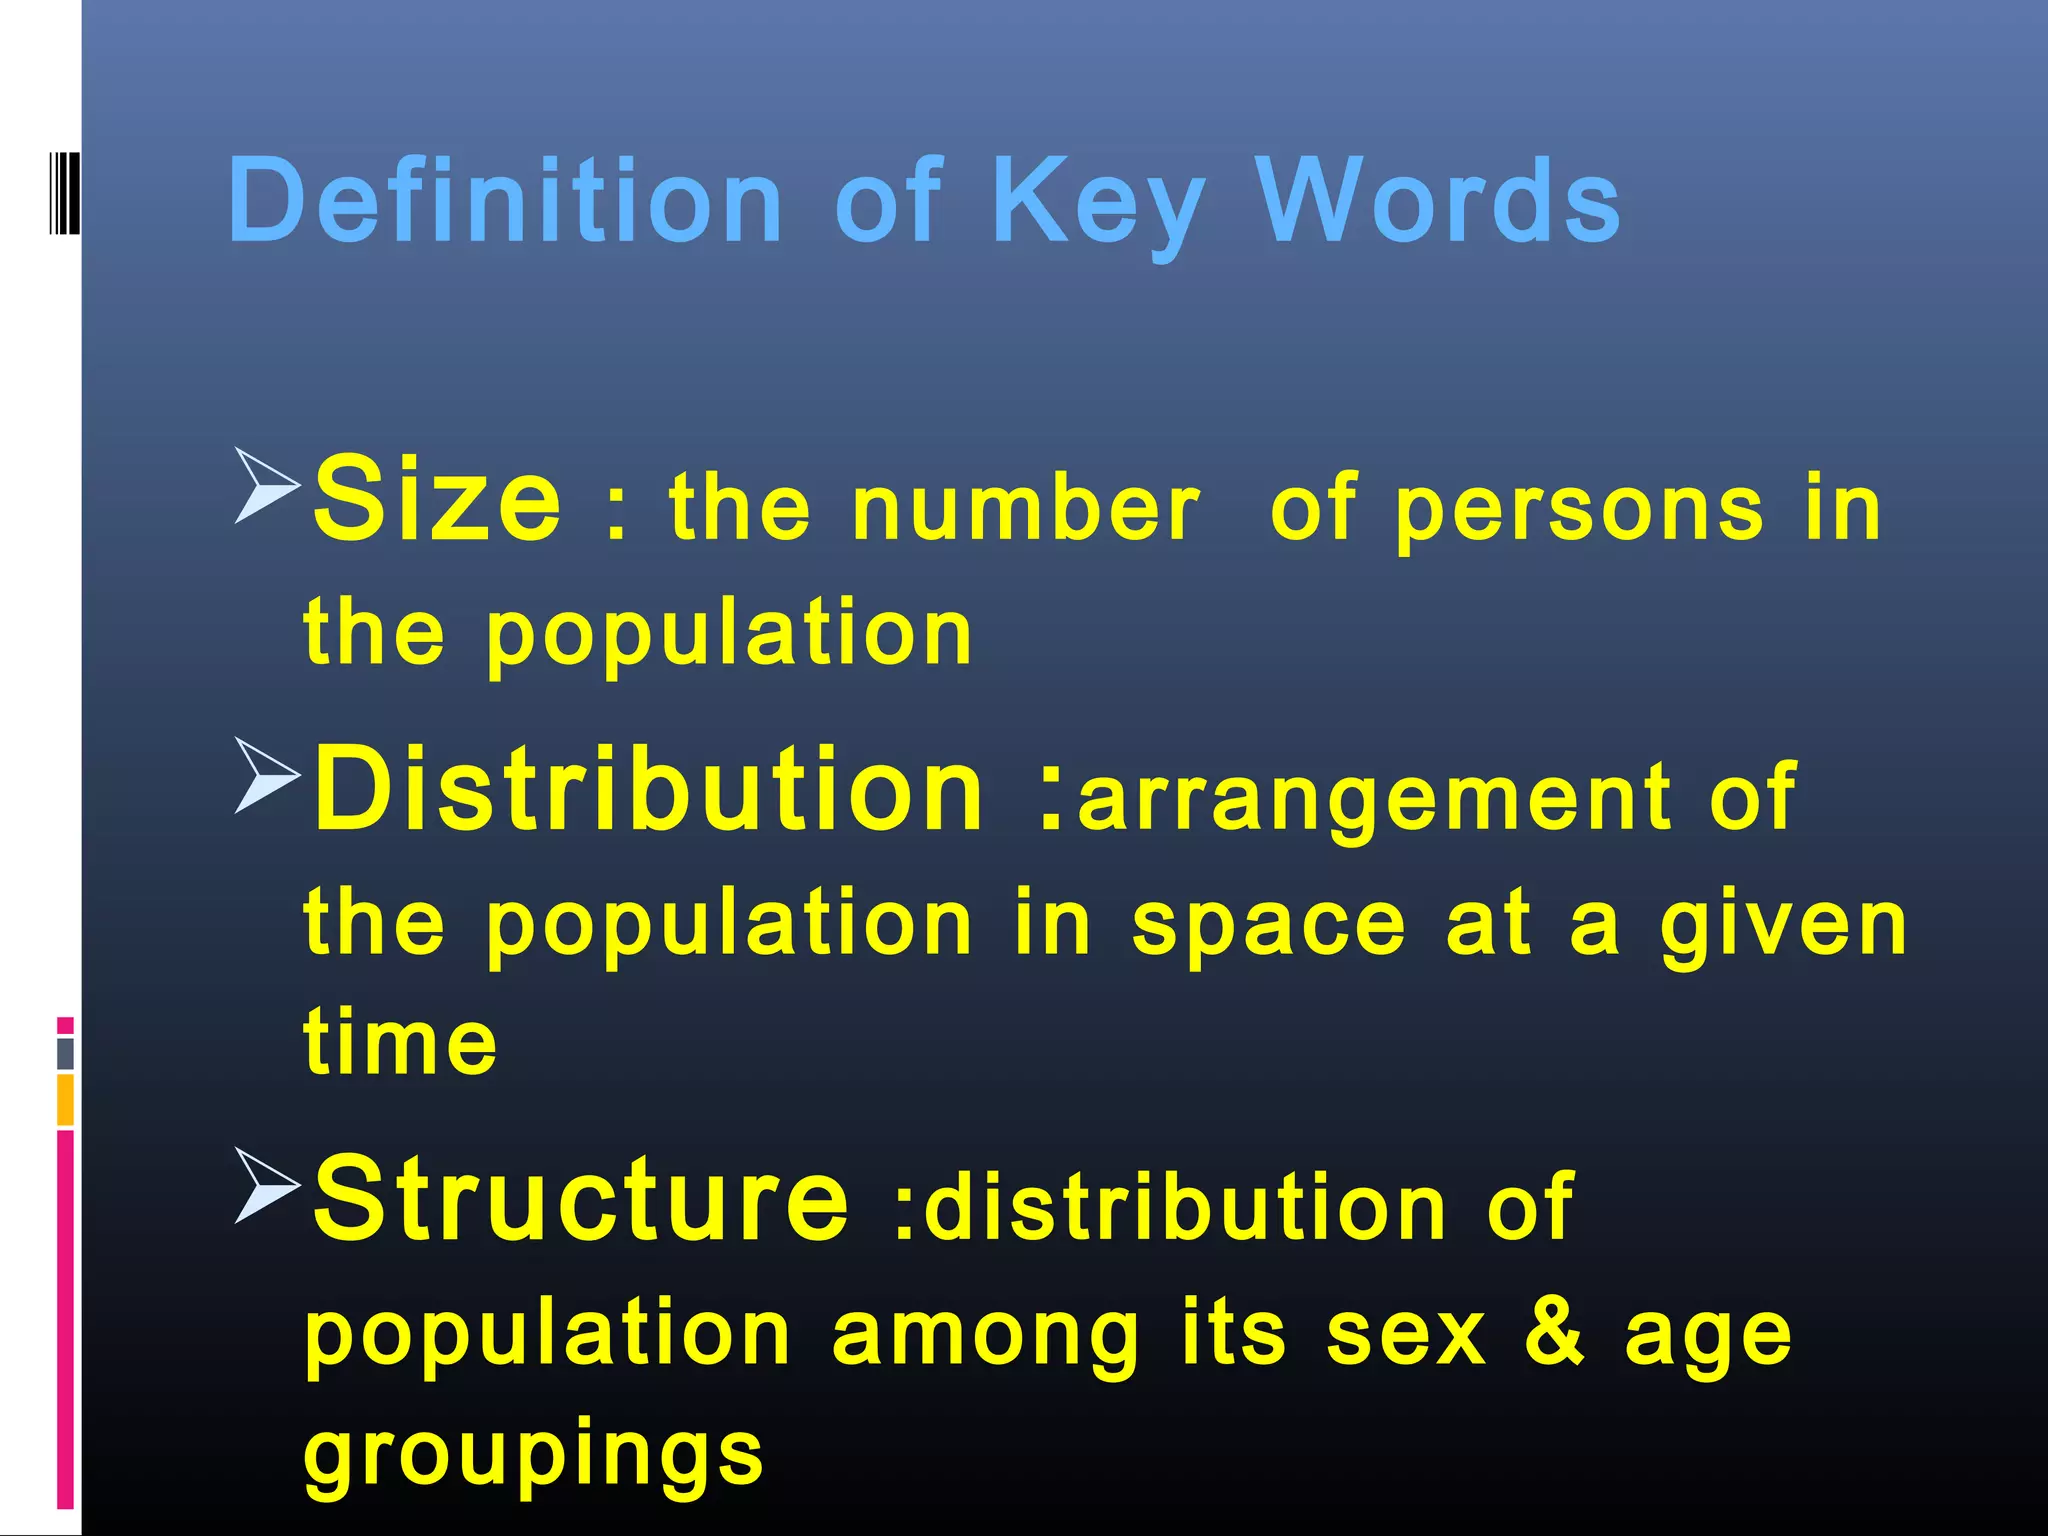
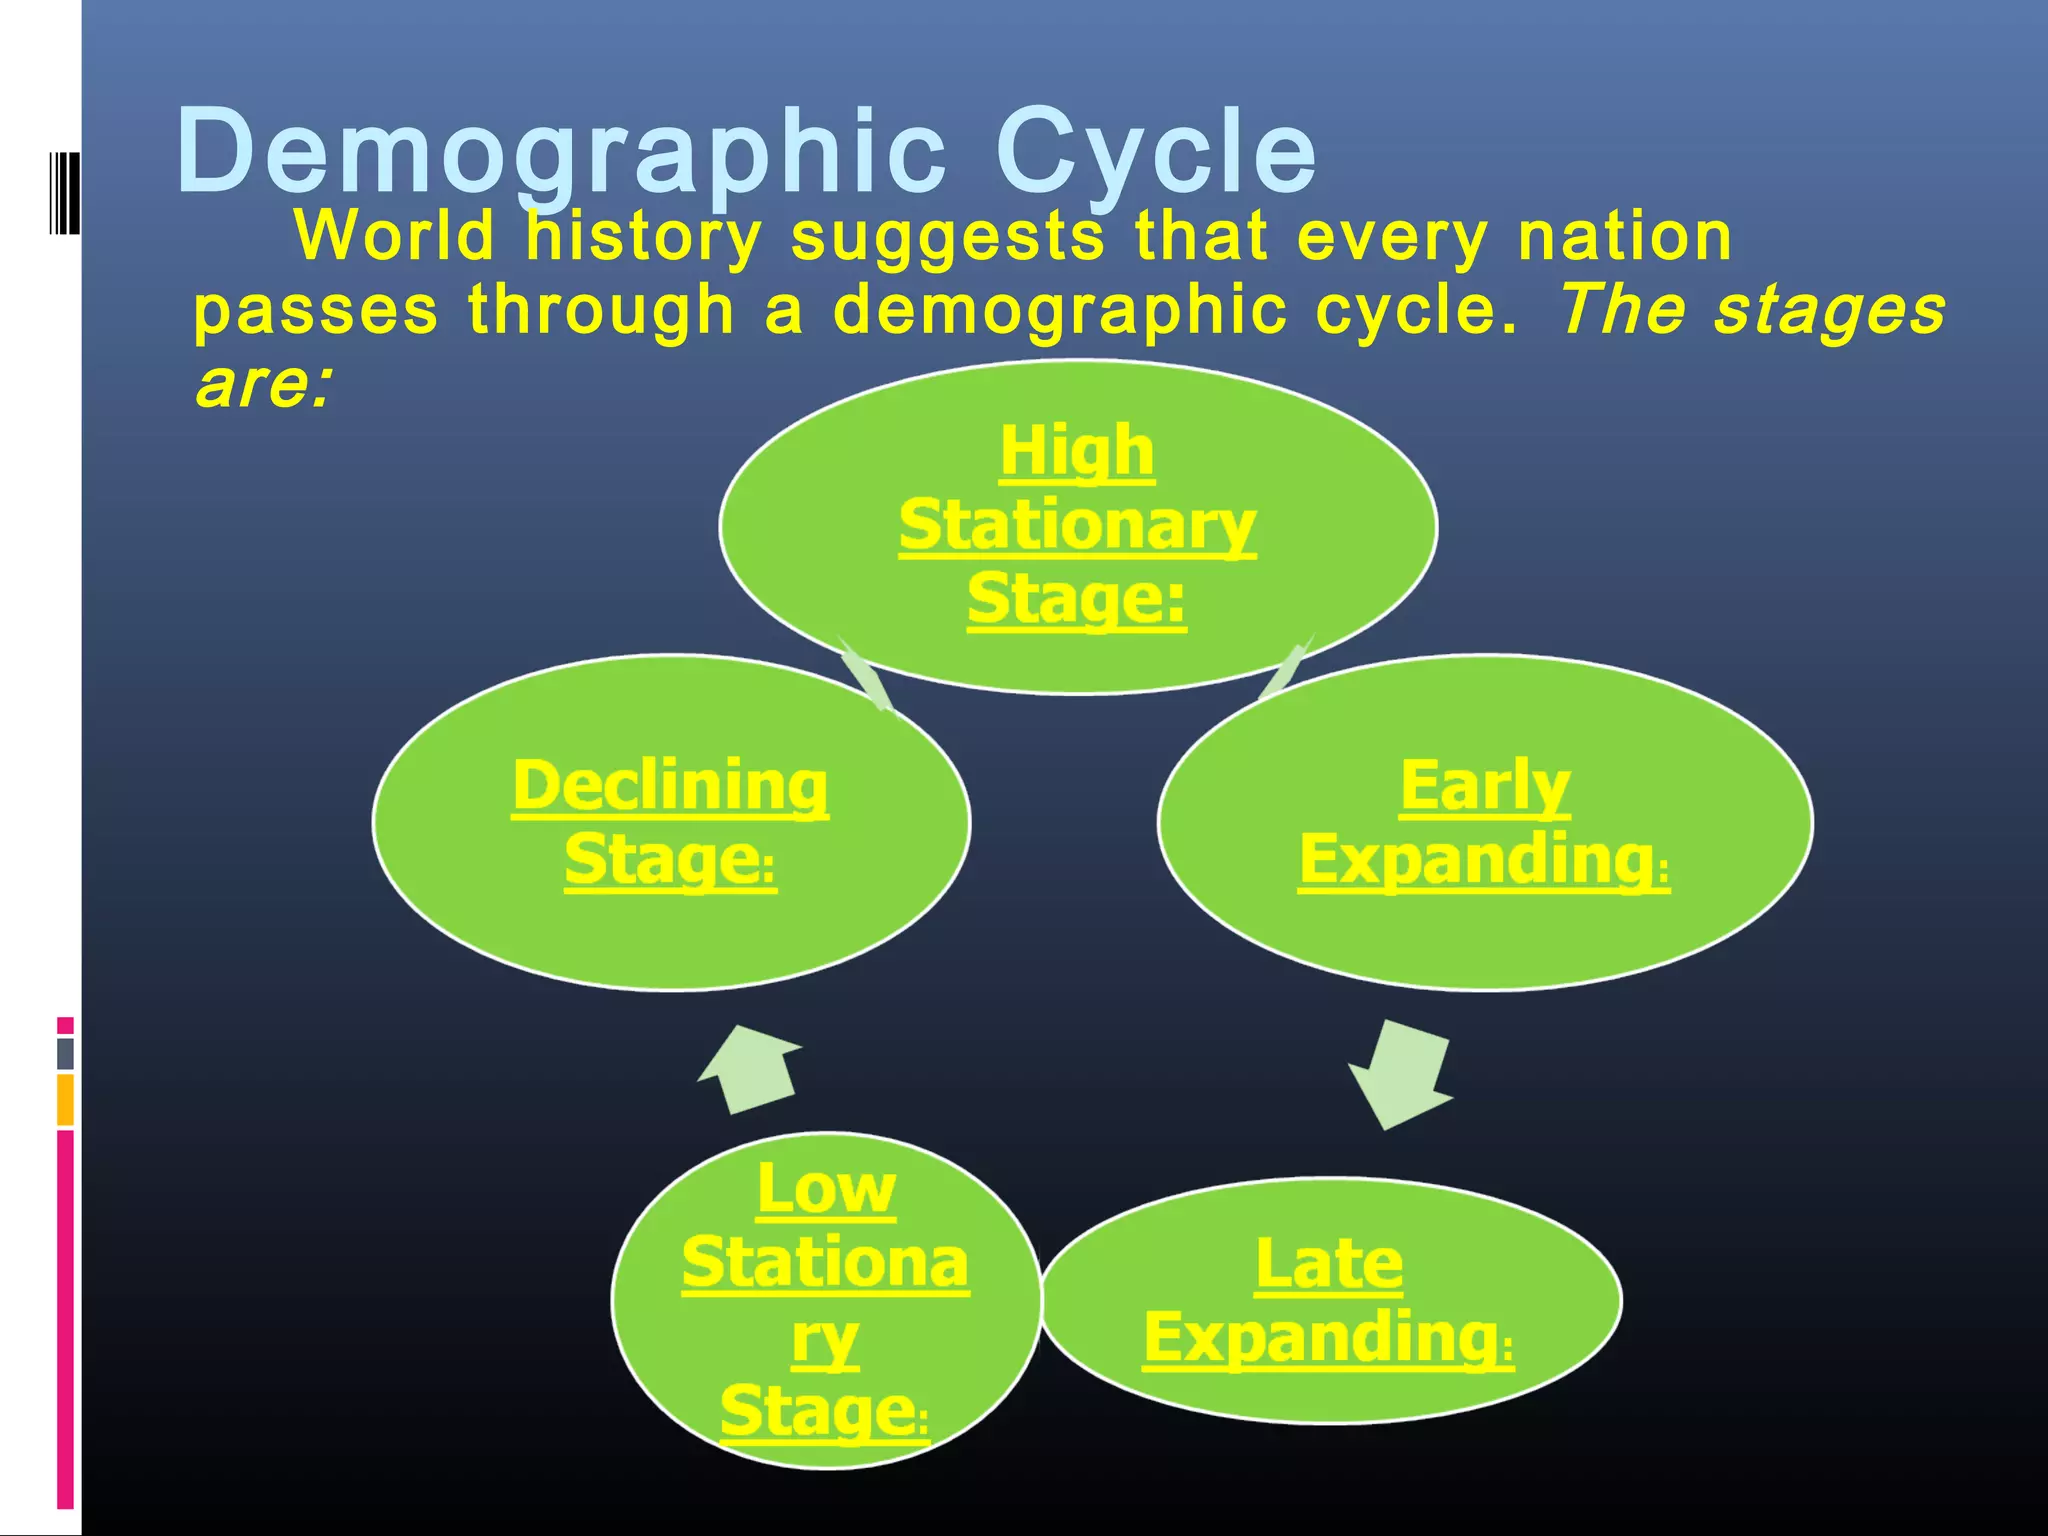
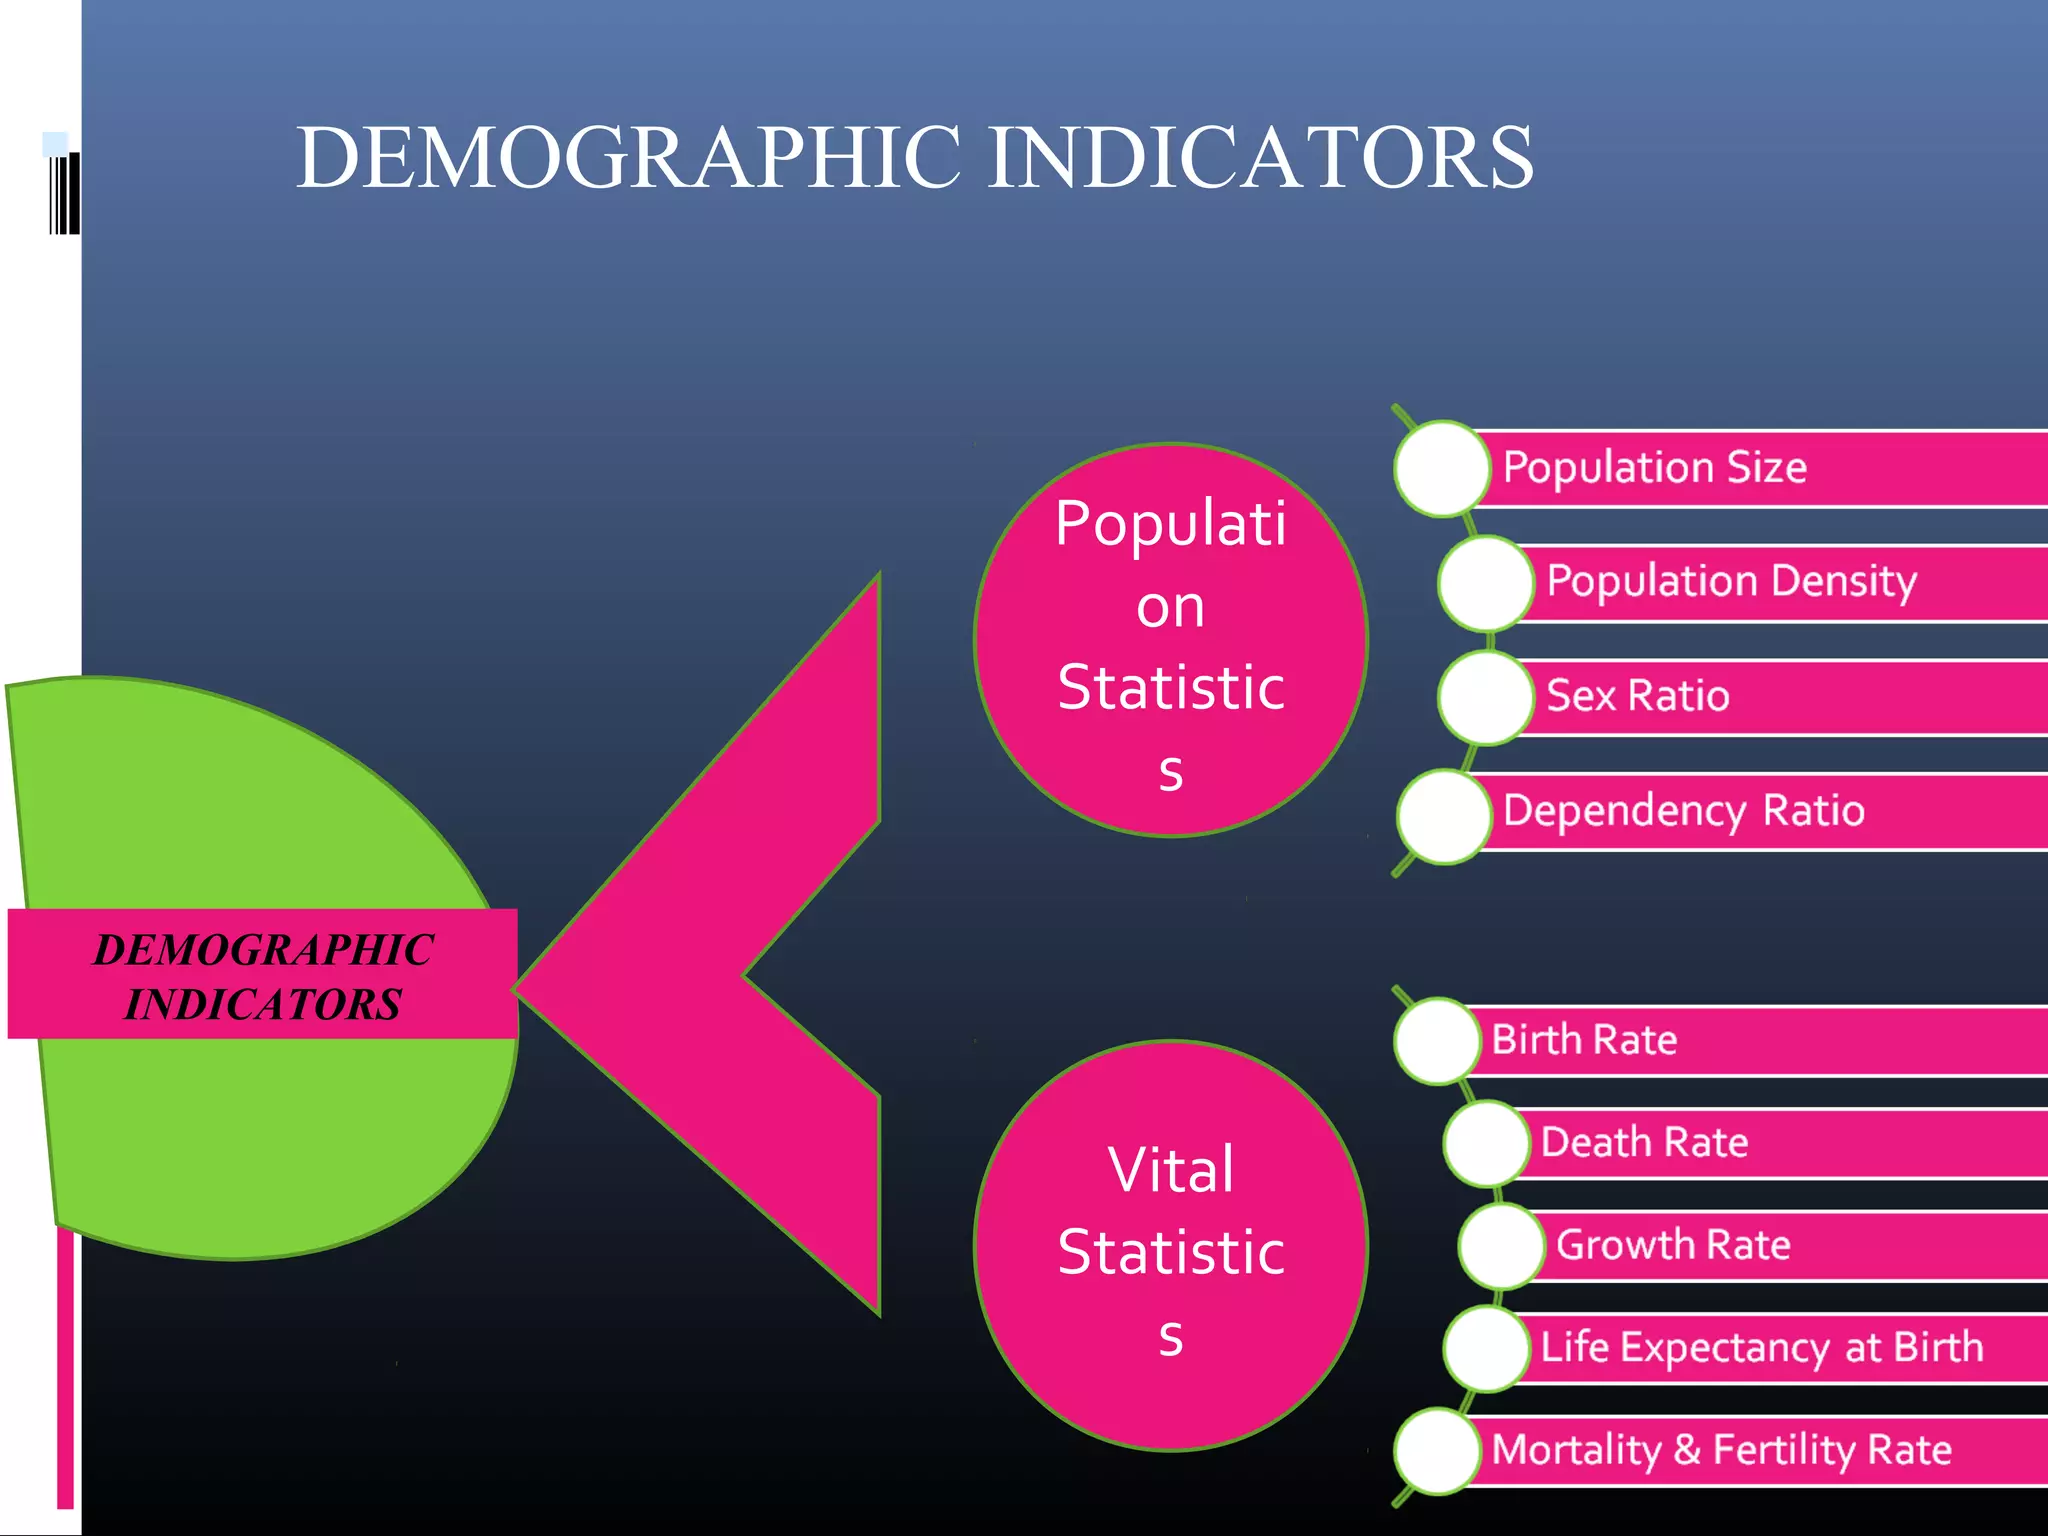
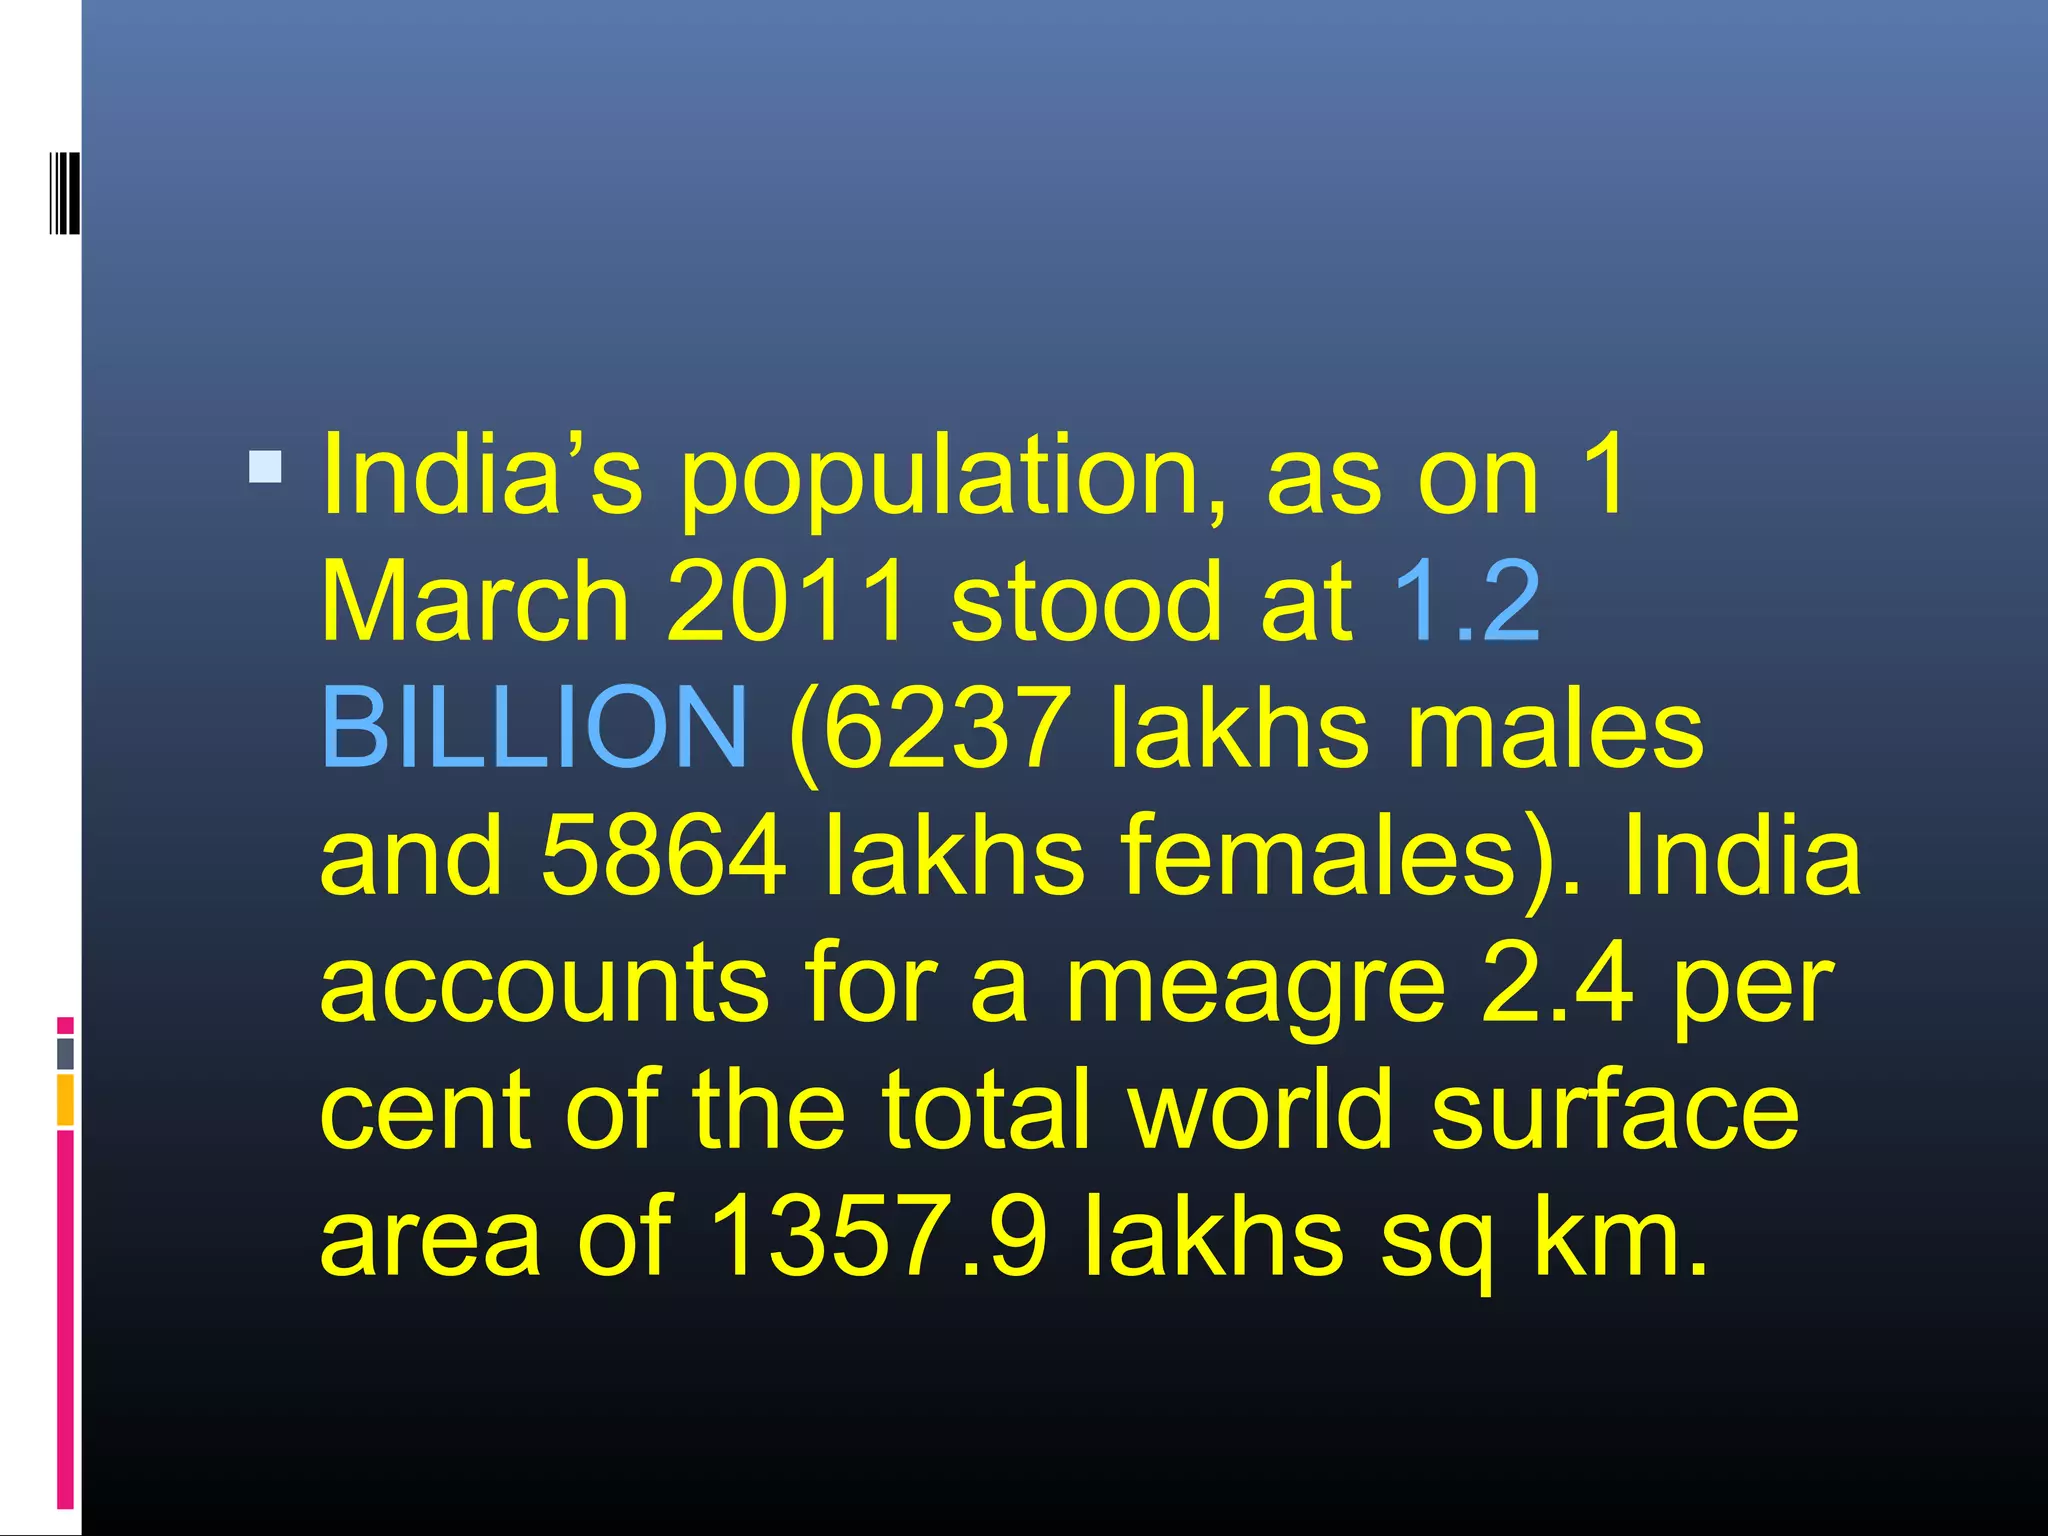
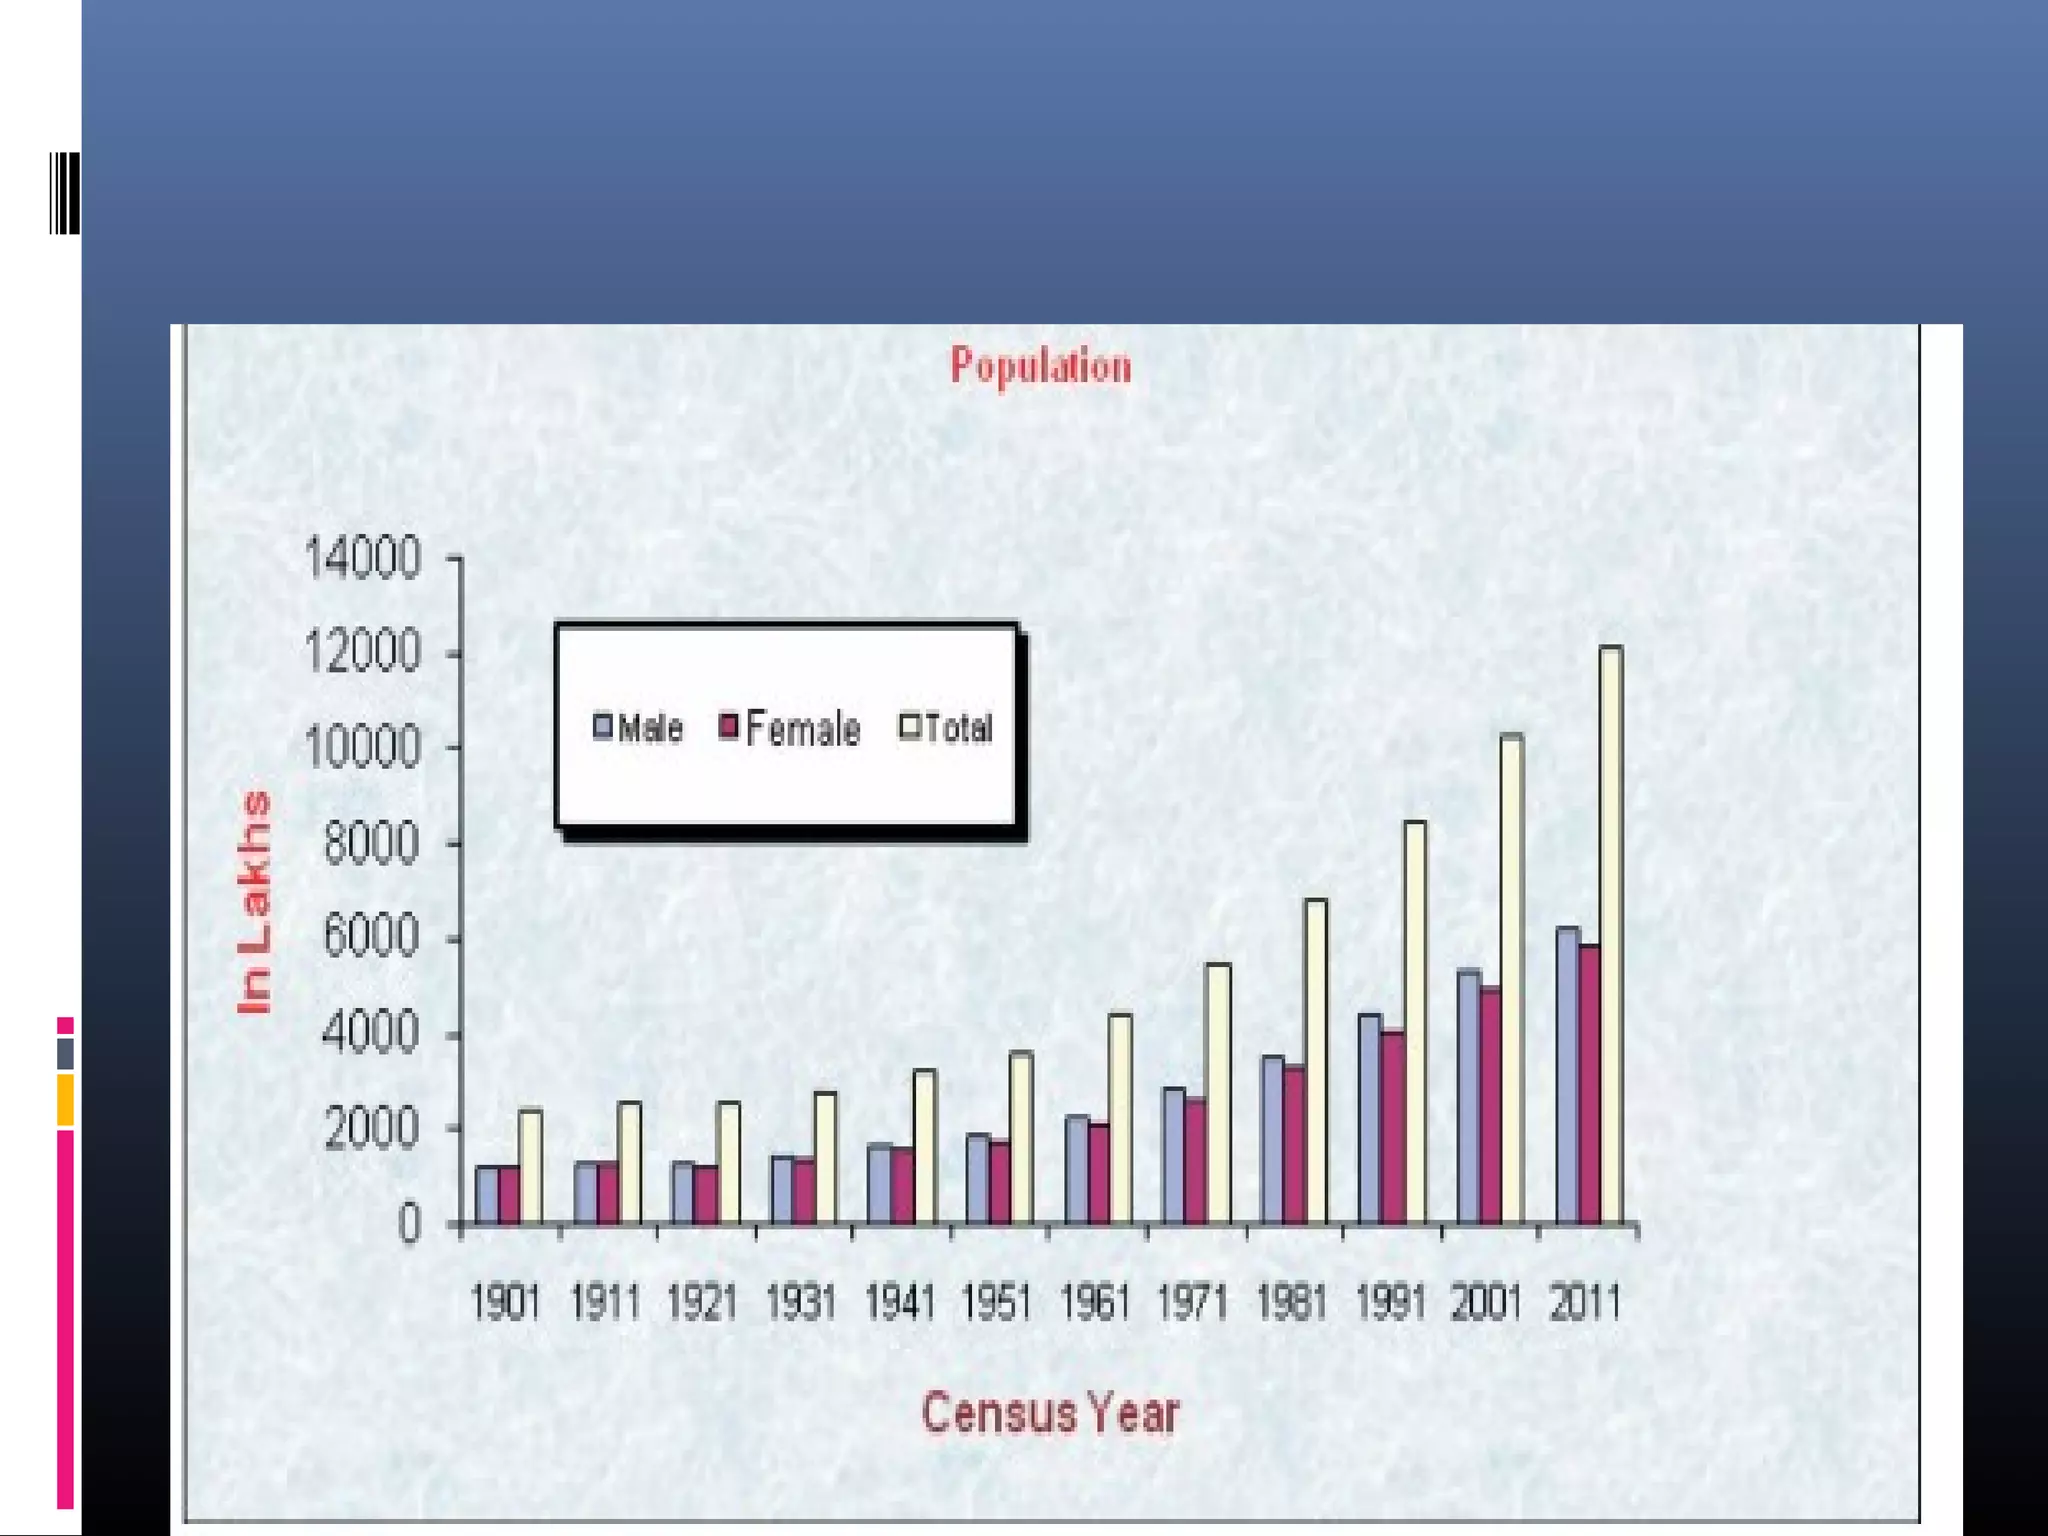
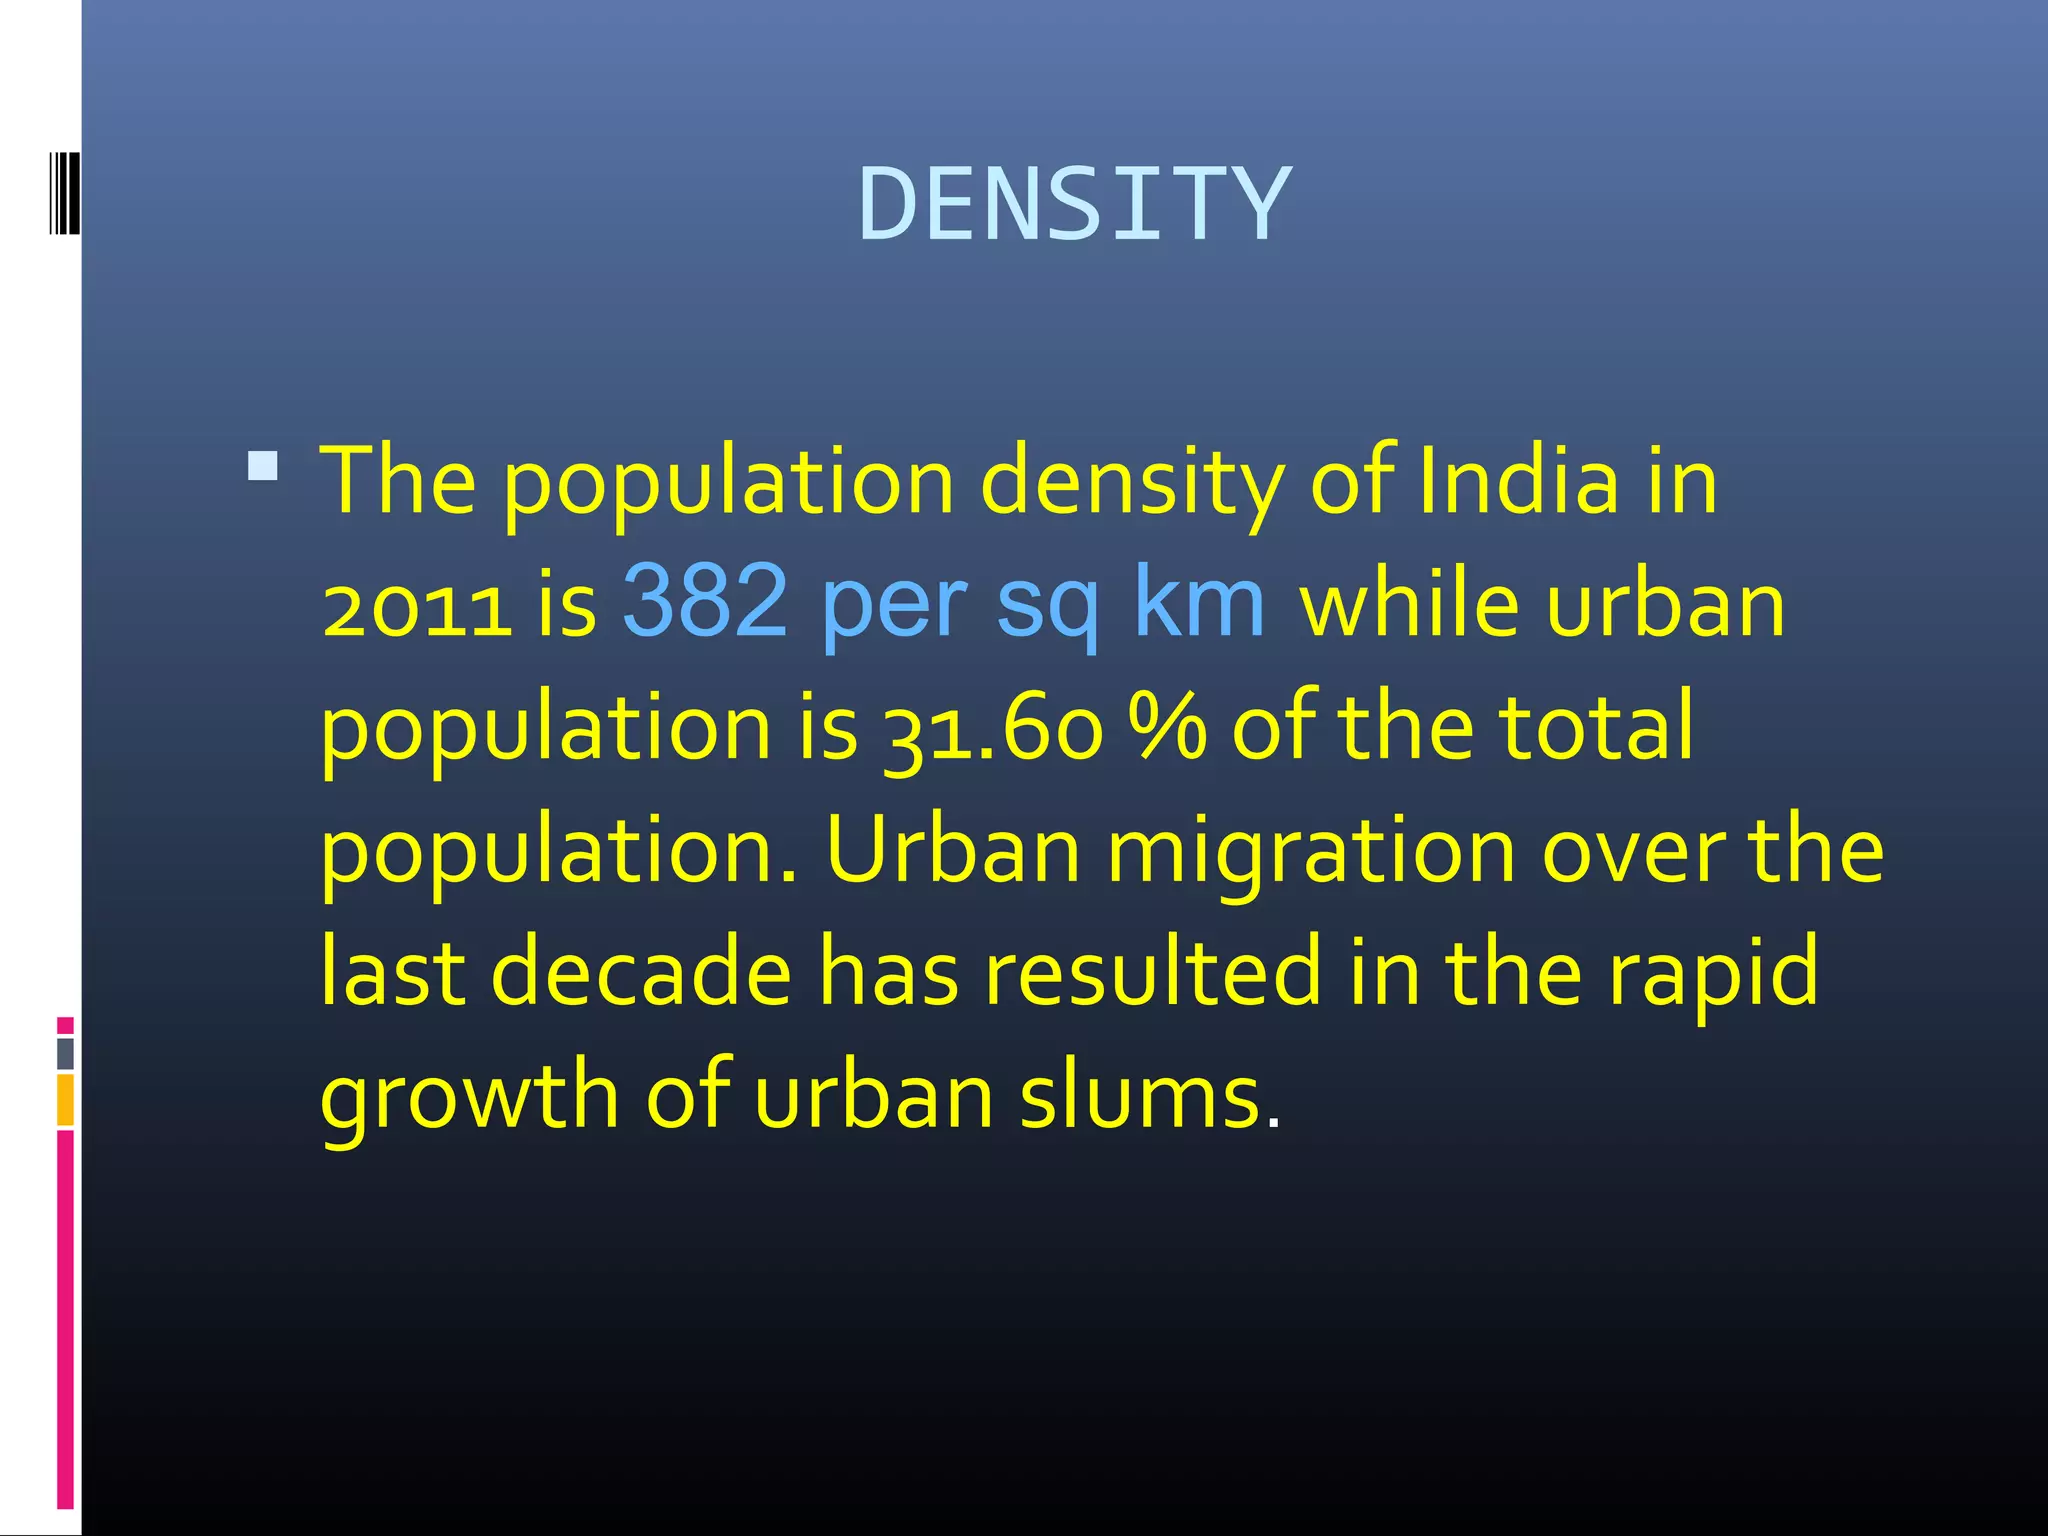
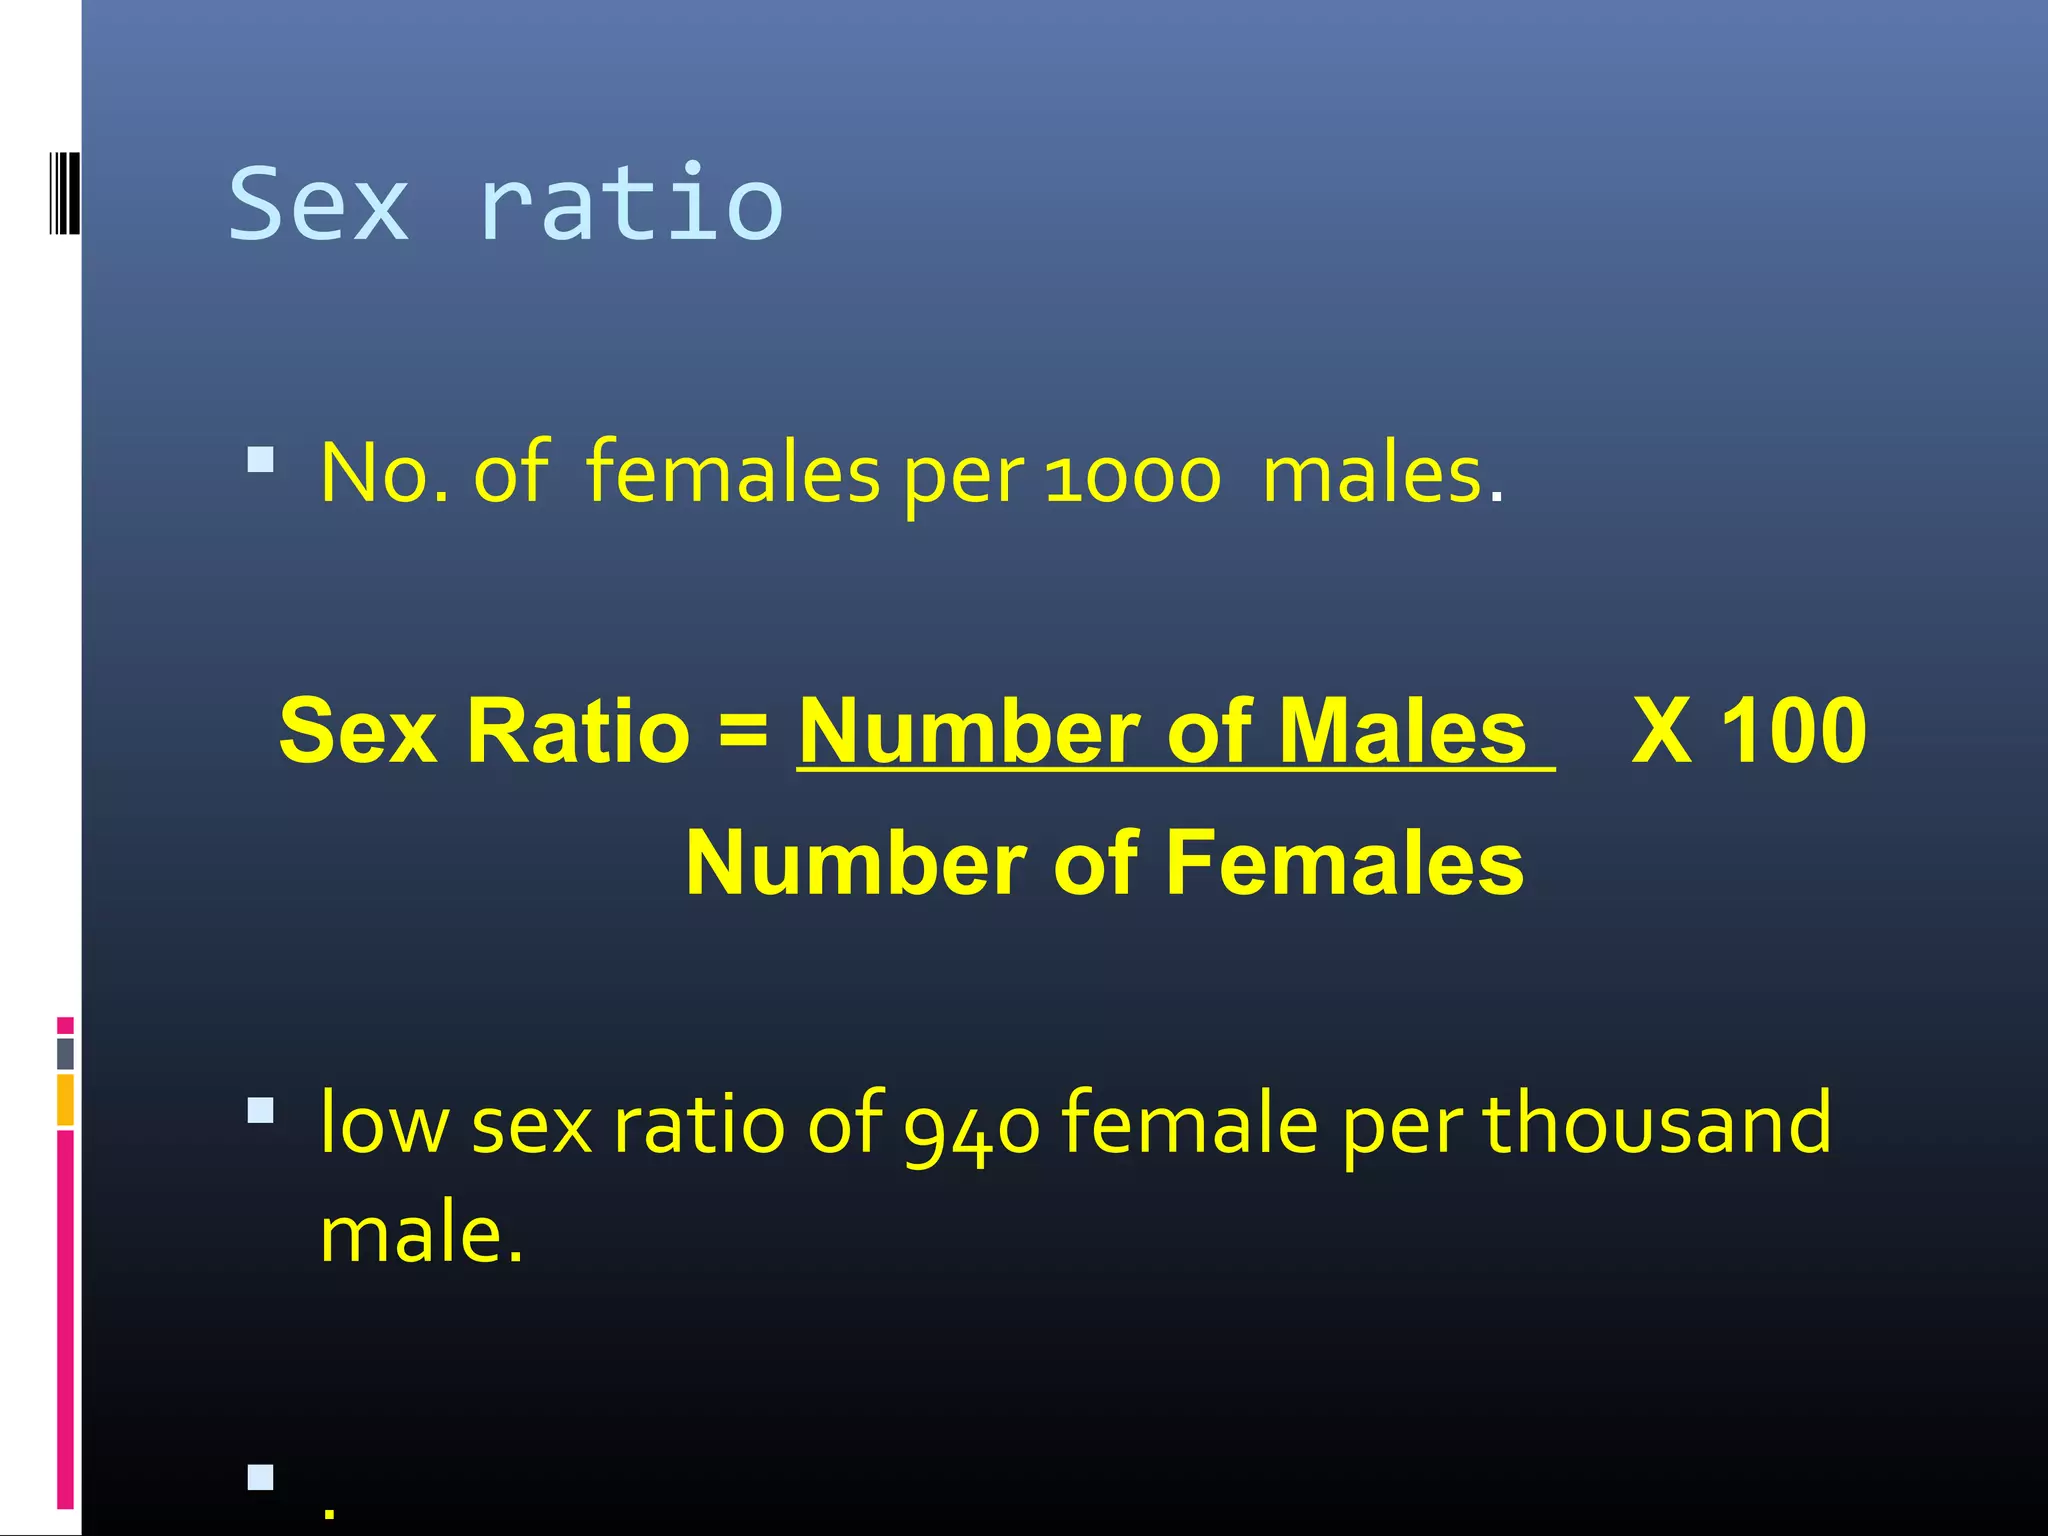
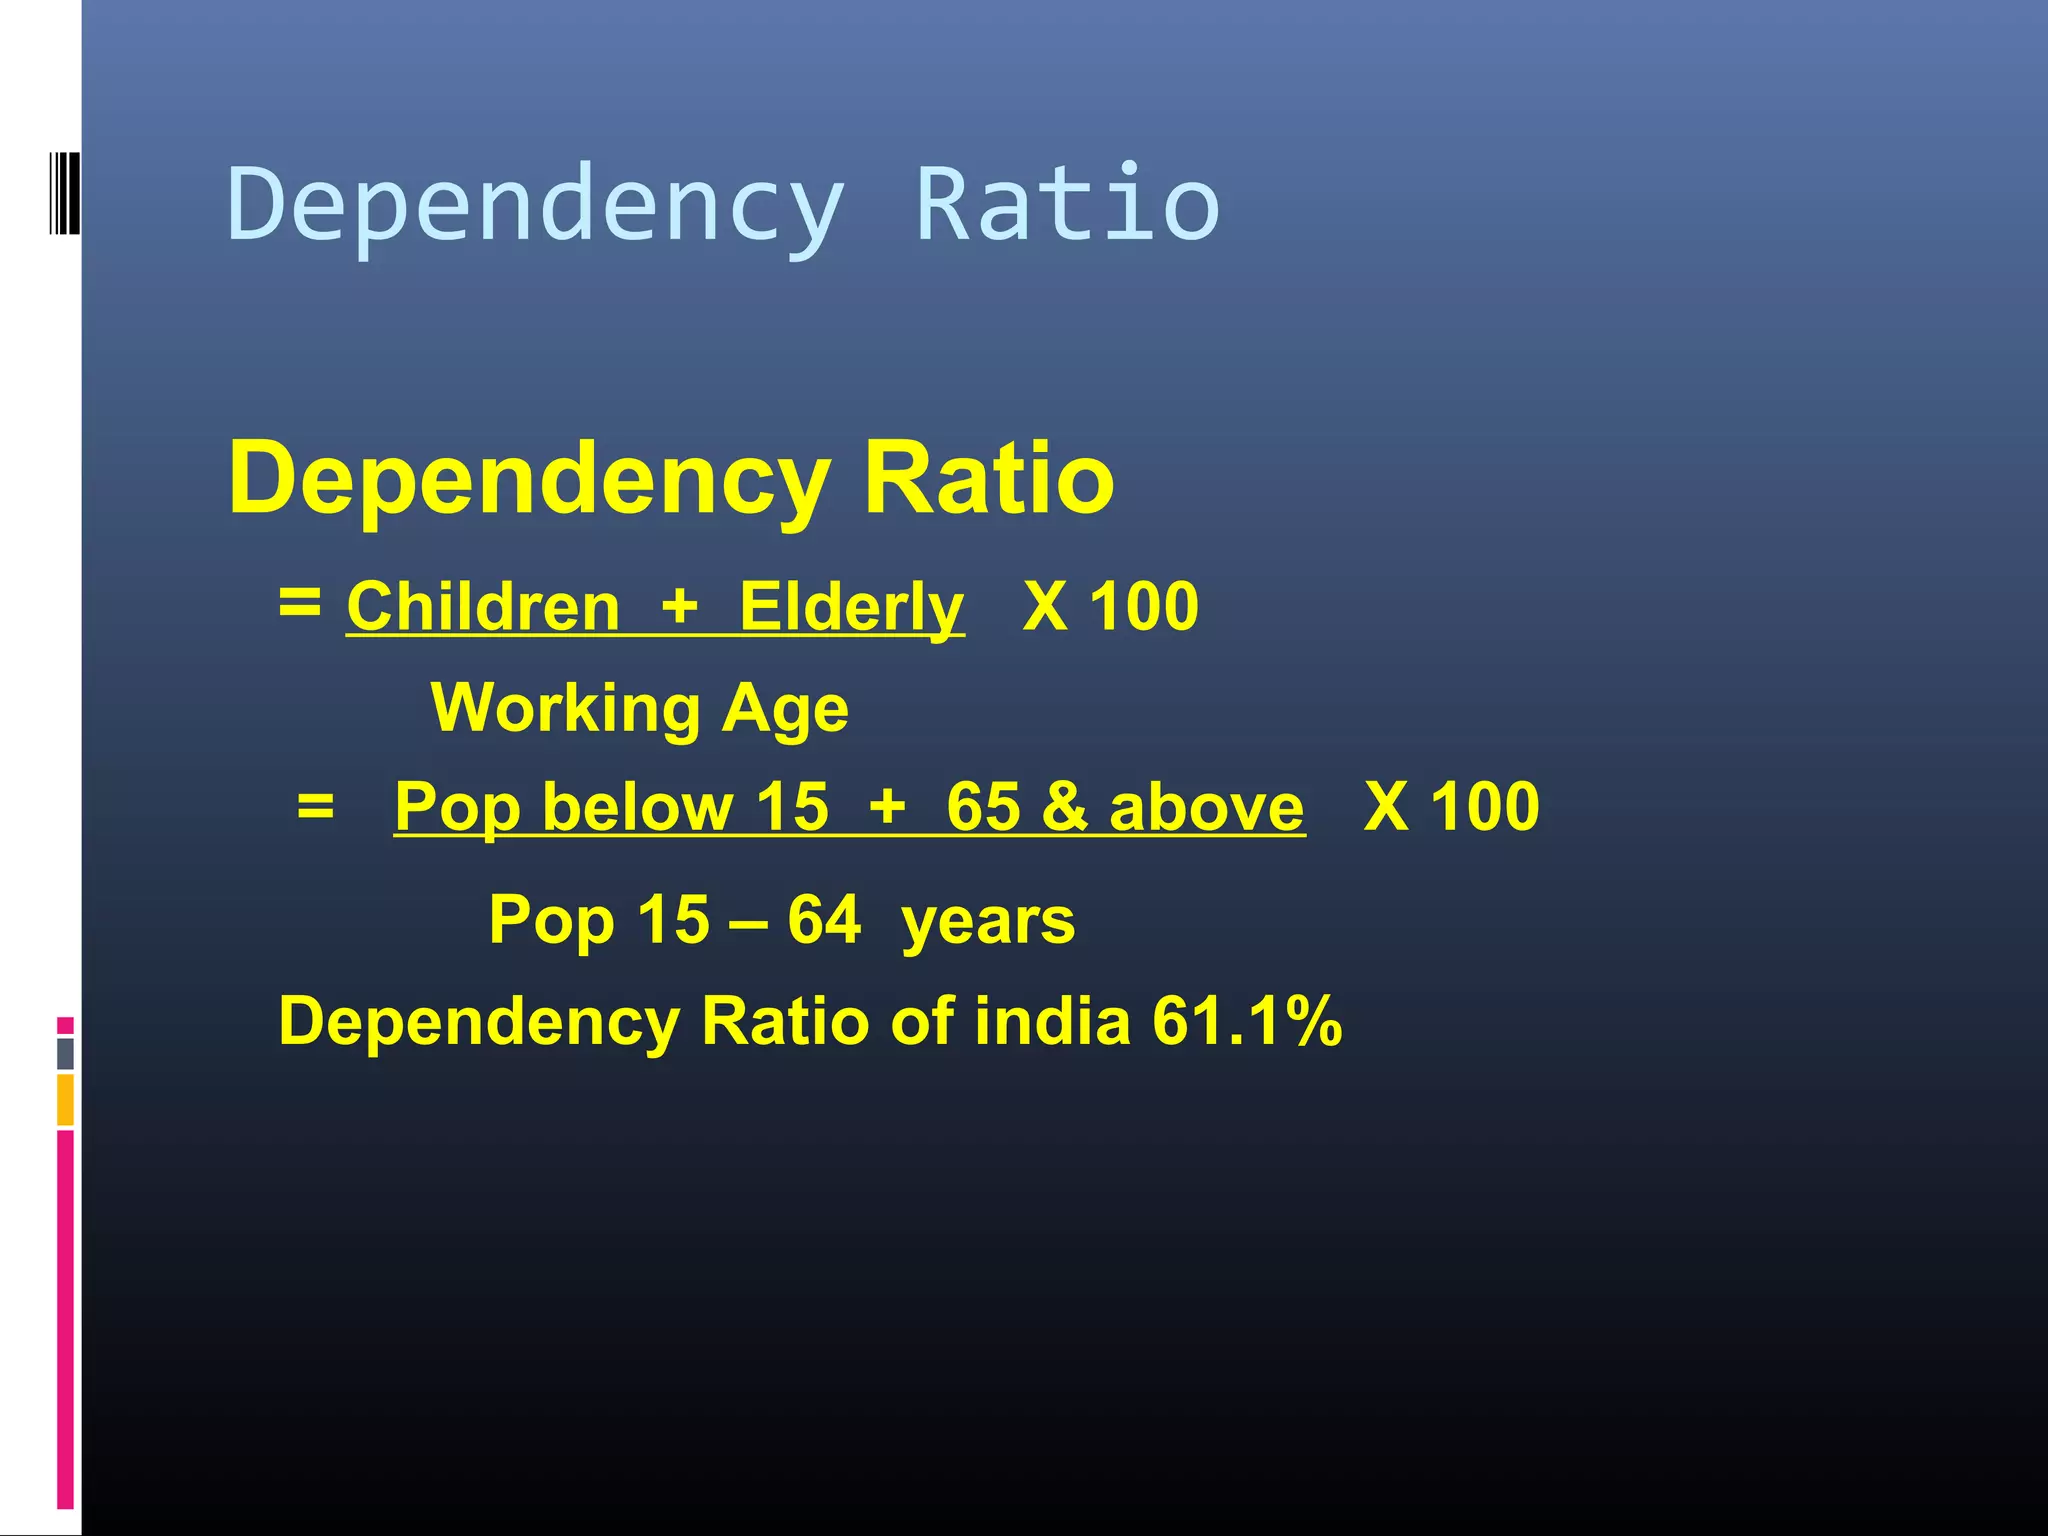
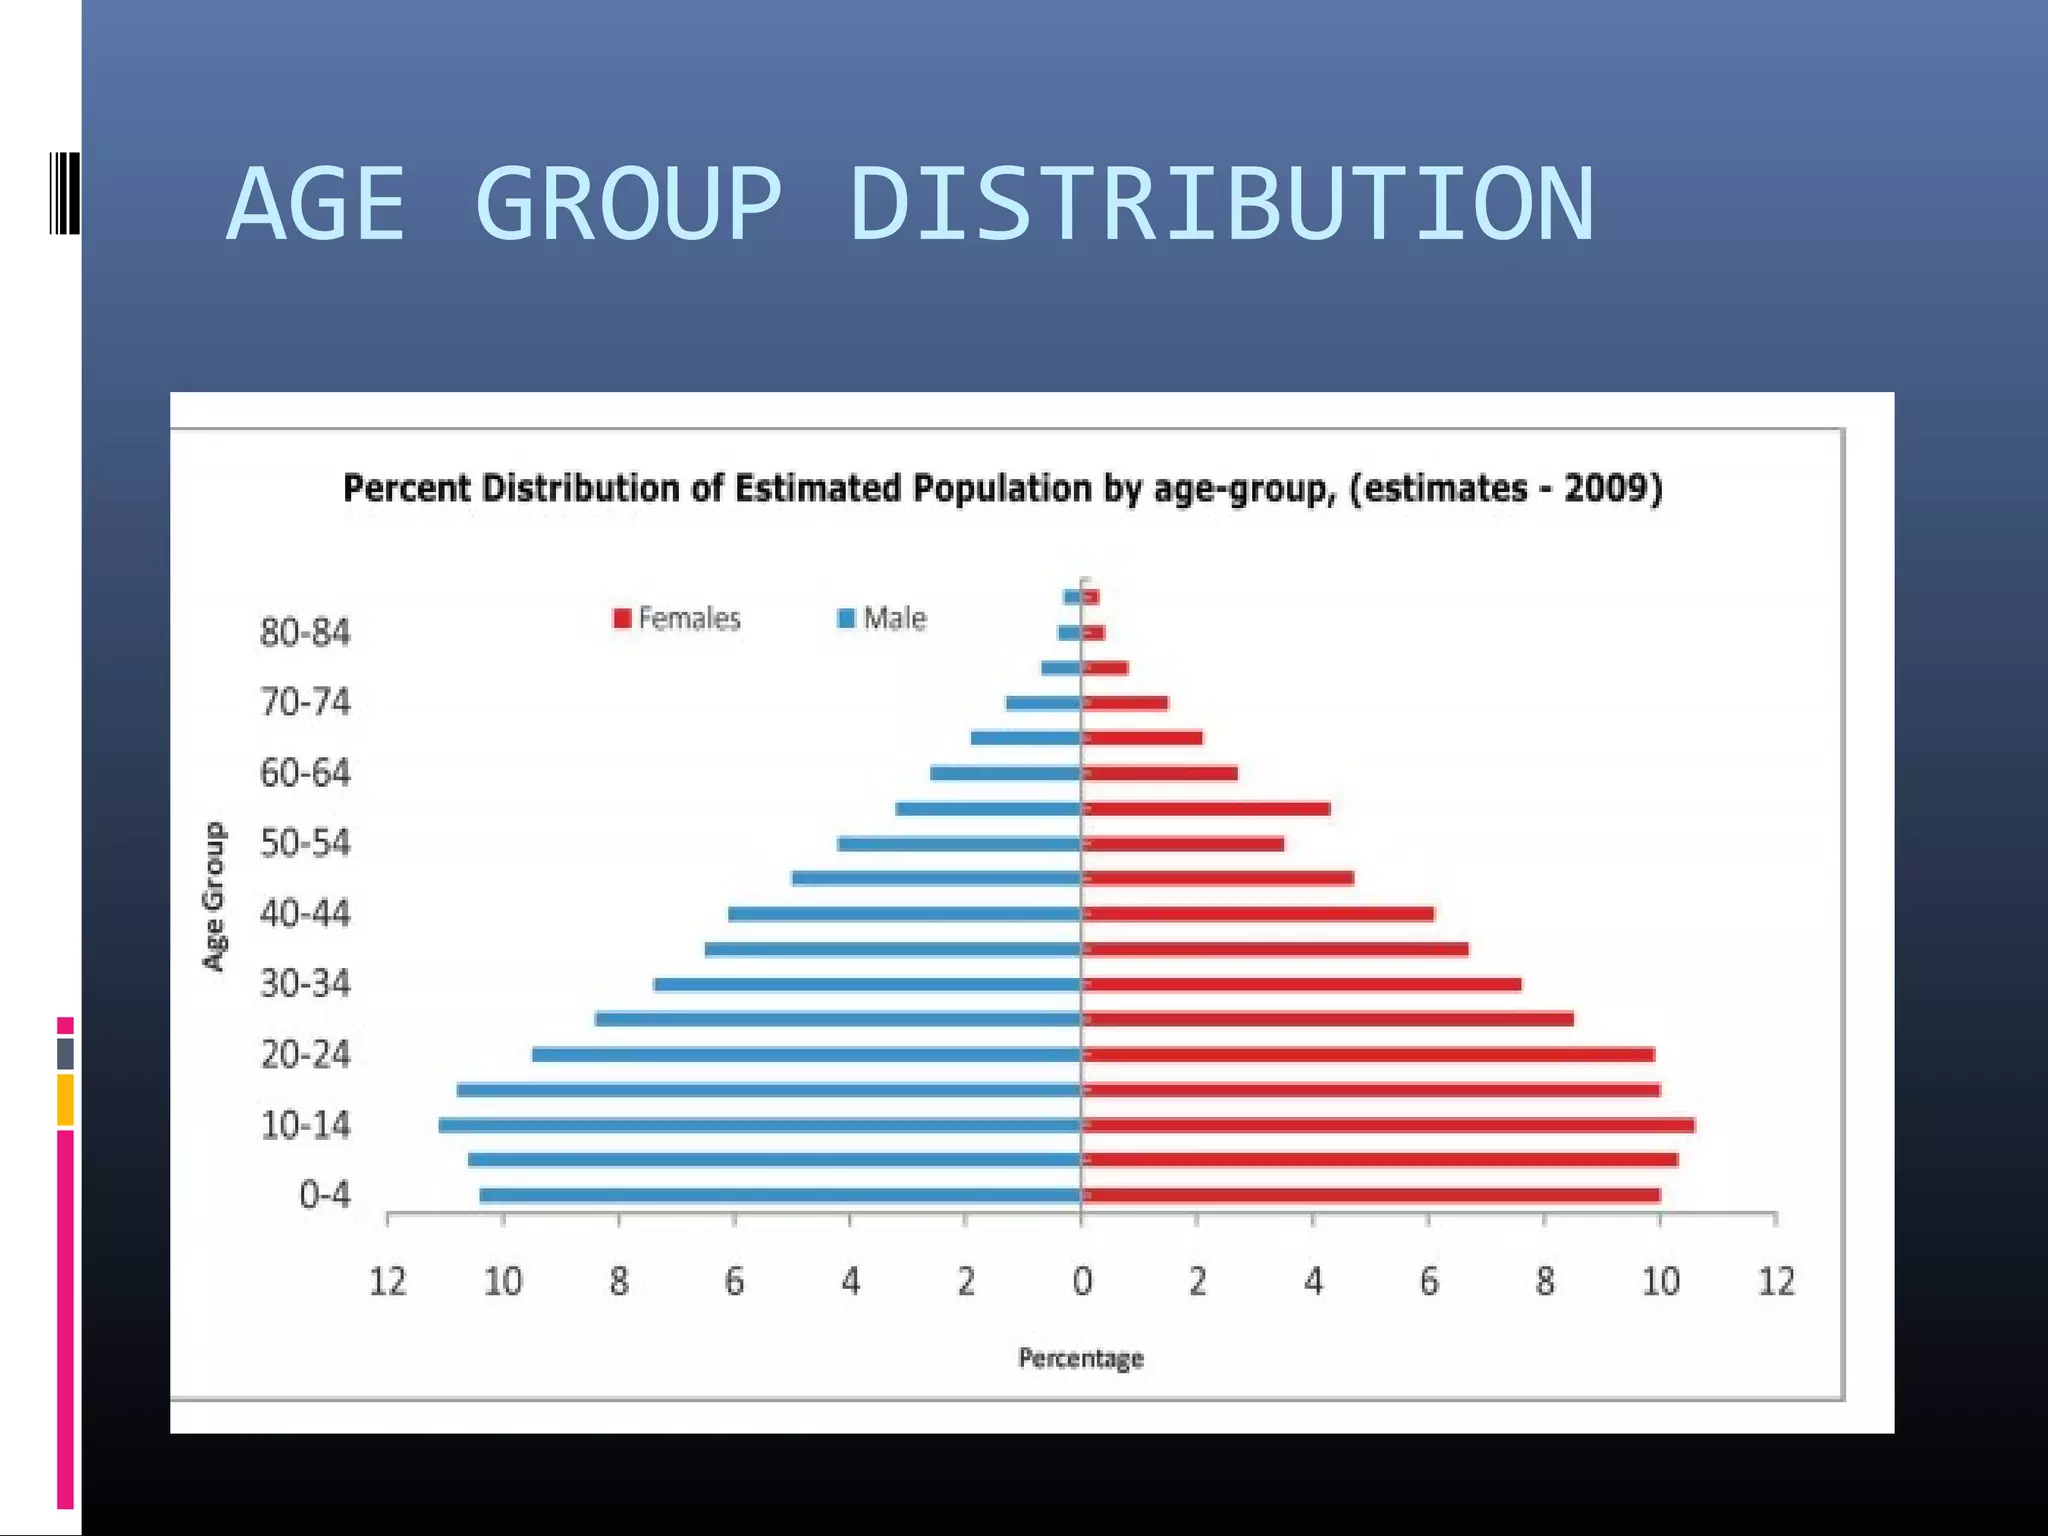
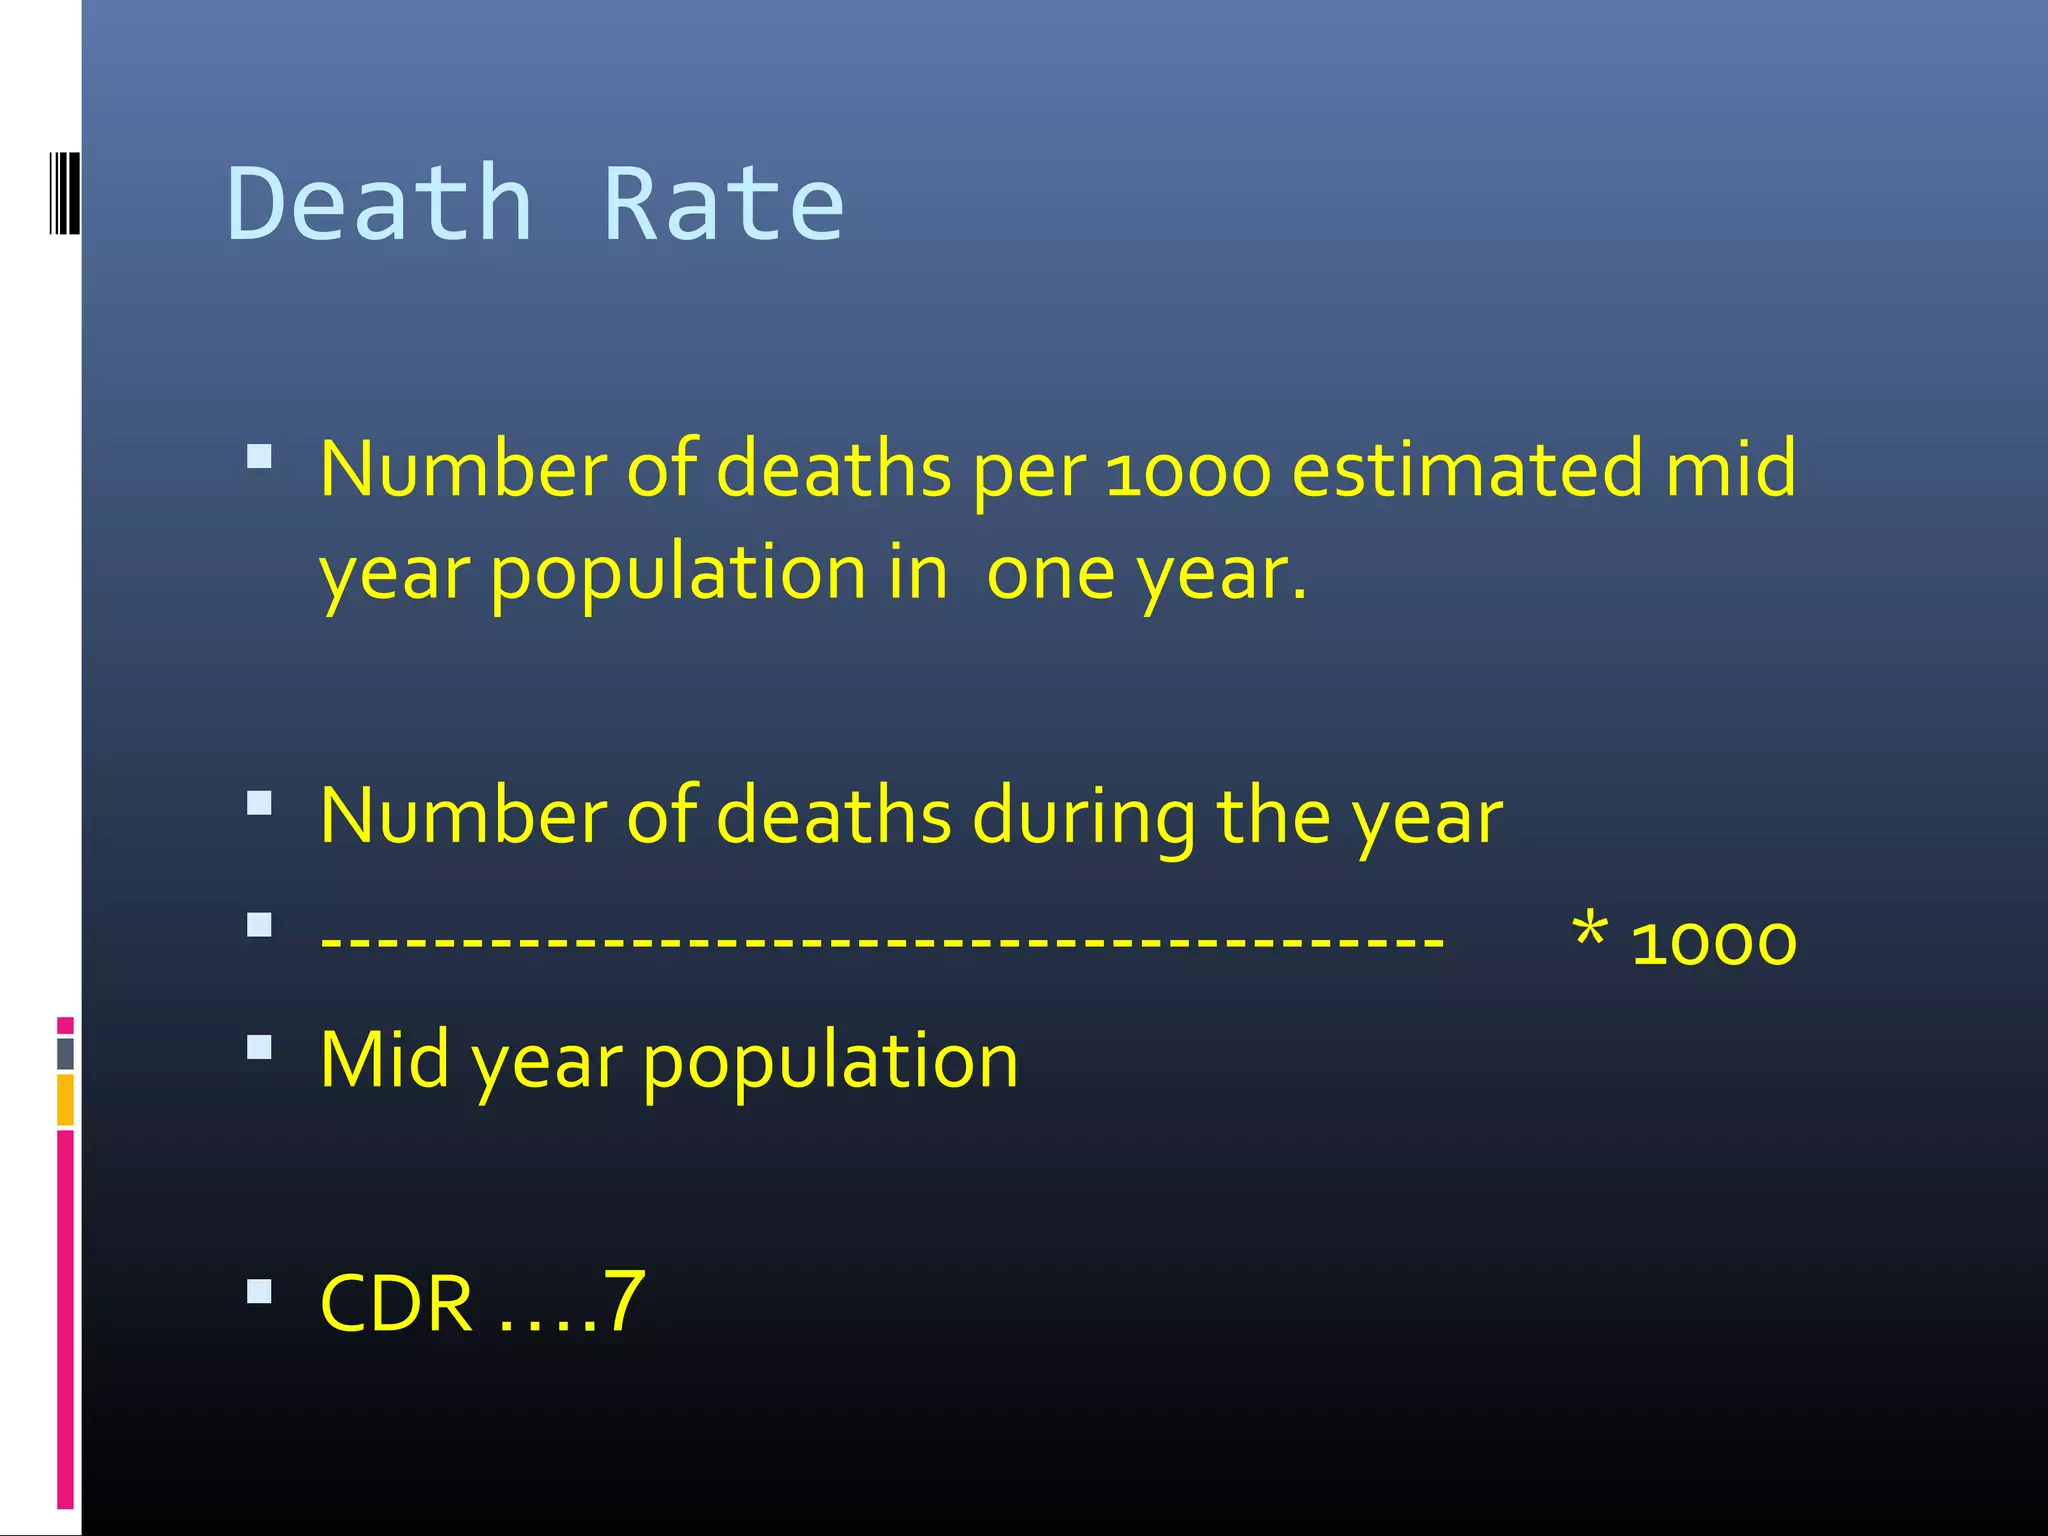
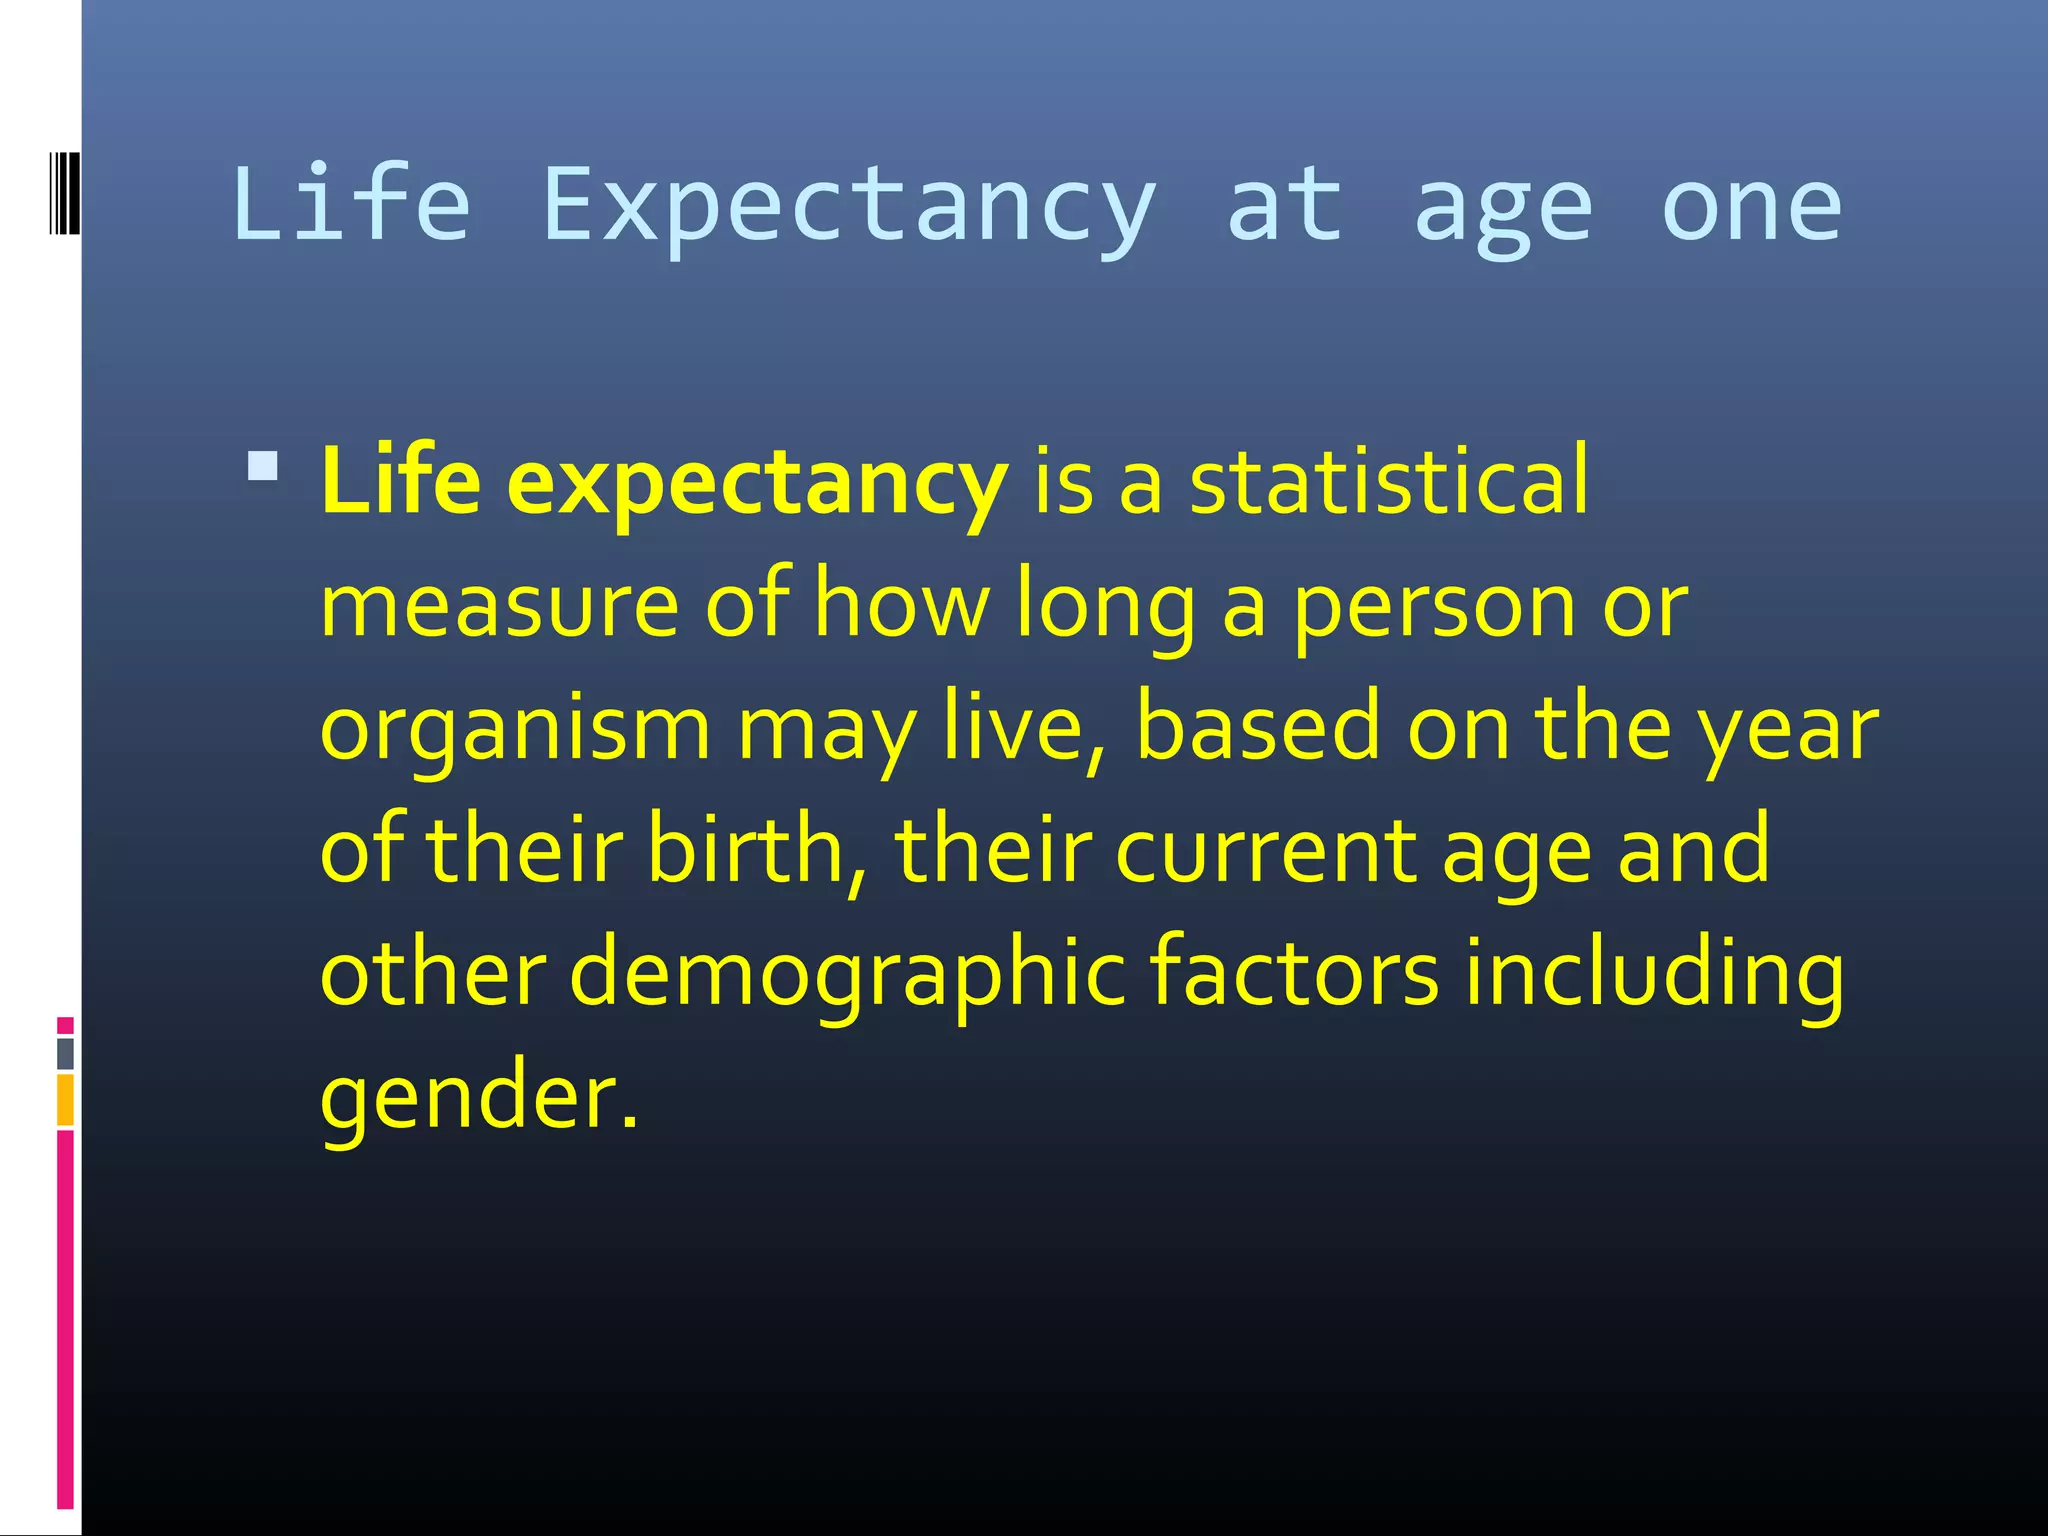

Demography is the scientific study of human populations and their characteristics. It deals with five key demographic processes: size, distribution, structure, change (through births, deaths, and migration), and characteristics like ethnicity, economic status, and more. Data comes from sources like censuses, surveys, vital event registration, and demographic studies. India's population as of 2011 was over 1.2 billion, with a density of 382 per square km and urbanization increasing. Key indicators include crude birth rate, death rate, growth rate, sex ratio, dependency ratio, and life expectancy.


