Downloaded 532 times

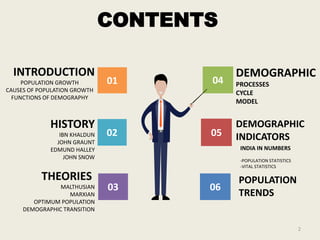


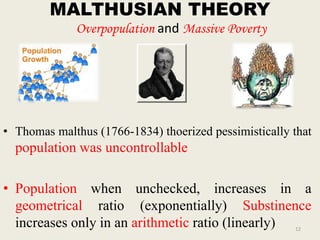


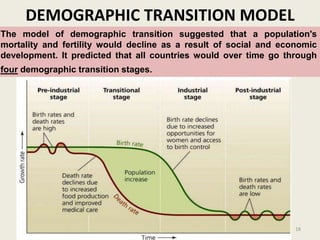


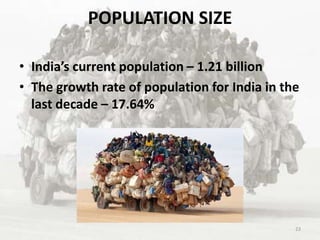


Demography is the scientific study of human populations. Key events in the history of demography include Ibn Khaldun's work in the 14th century, John Graunt producing the first life table in the 17th century, and John Snow mapping cholera deaths in London in the 19th century. Major population theories include Malthus' theory of unchecked population growth outstripping resources, Marx's view that population is controlled by economic factors, and the demographic transition theory of declining birth and death rates as countries develop. India's current population is over 1.2 billion with a growth rate of 17.6% in the last decade. Key demographic indicators of India include sex ratio, age composition, and dependency ratio.