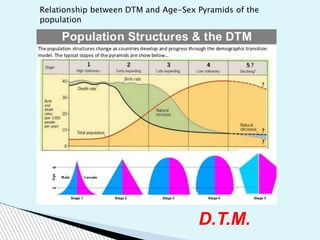
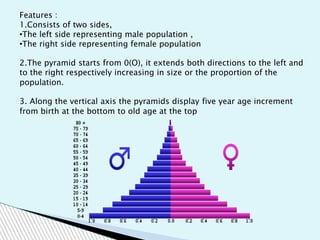
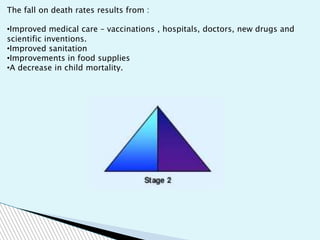
HGG1002
GEOGRAPHY OF THE HUMAN ENVIRONMENT:
Population systems :
Age Distribution
AGE SEX PYRAMID
DEF : This is a graphical illustration that outlines the most important
demographic characteristics of population which is the age sex
structure.
It also breaks down the country's or locations population into male
and female genders and age ranges.
D.T.M.
Relationship between DTM and Age-Sex Pyramids of the
population
Features :
1.Consists of two sides,
•The left side representing male population ,
•The right side representing female population
2.The pyramid starts from 0(O), it extends both directions to the left and
to the right respectively increasing in size or the proportion of the
population.
3. Along the vertical axis the pyramids display five year age increment
from birth at the bottom to old age at the top
Stage 1: High Birth rates and High Death rates.
High birth rates
•No birth control or family planning
•Many children die in infancy
•Many children born so as to labour for the family.
•Children are regarded as a sign of virility
•Religious beliefs encourage large families
High death rates
•Diseases and plagues (bubonic , cholera , kwashiorkor)
•Famine , uncertain food supplies and poor diet
•War
•Poor hygiene no piped water , clean water and no sewage disposal
•Little medical science , high doctor patient ratio.
•Competition for food
For example:
Least
economically
developed
countries
today:
Somalia, and
Britain in the
18th century
Stage 2: Birth rates remain high but Death rates fall rapidly
For example:
Britain in the
19th century,
Bangladesh
, Nigeria
The fall on death rates results from :
•Improved medical care – vaccinations , hospitals, doctors, new drugs and
scientific inventions.
•Improved sanitation
•Improvements in food supplies
•A decrease in child mortality.
Stage 3: Fall in both Birth rates and Death rates.
Usually as a result of :
•Improved economic conditions
•An increase in women status
•Access to contraception
•Increased mechanization reducing need for workers
•Increased standards of living
Stage 4 : Low fluctuating ,Low Birth rate and Low Birth rate
Due to
•Political stability
•Changes in personal lifestyles
•More women are in the workforce therefore less couples are having kids
Stage 5? : declining population
Theoretical
Death rate exceeds birth rates
Negative NIR (natural increase rate : crude birth rate – crude death rate)
Mostly eastern European countries are projected so :
Russia, Belarus Germany Italy Japan .
Most developed are predicted to experience population decline
•Factor of more elderly than young population in these countries
•Fewer young women who will be entering their child bearing years
•Elderly support ratio- the number of working age people (15-64)
divided by the number of persons 65 or older.
Factor affecting the population pyramids.
•Fertility
•Birth rate
•Death rate
•Migration (immigration and emigration)
•Disease out breaks
•Natural disasters
Presentation done by :
T. BERE – R164423S
T. SAMANYANGA – R164540T
T. MANGOSHO – R164538X
K.K. SADZAUCHI – R164430Z
M. MAFUMO – R164539K
J.J. MUKWEWA – R164525J
M.T. TSEKENI – R164424L
N. NYANDORO – R165832R
T. MADONDO – R165526Y
A. NYONI – R164522S
THE END
Age sex Pyramids Presentation

Age sex Pyramids Presentation

  • 1.
    HGG1002 GEOGRAPHY OF THEHUMAN ENVIRONMENT: Population systems : Age Distribution
  • 2.
    AGE SEX PYRAMID DEF: This is a graphical illustration that outlines the most important demographic characteristics of population which is the age sex structure. It also breaks down the country's or locations population into male and female genders and age ranges.
  • 3.
    D.T.M. Relationship between DTMand Age-Sex Pyramids of the population
  • 4.
    Features : 1.Consists oftwo sides, •The left side representing male population , •The right side representing female population 2.The pyramid starts from 0(O), it extends both directions to the left and to the right respectively increasing in size or the proportion of the population. 3. Along the vertical axis the pyramids display five year age increment from birth at the bottom to old age at the top
  • 5.
    Stage 1: HighBirth rates and High Death rates. High birth rates •No birth control or family planning •Many children die in infancy •Many children born so as to labour for the family. •Children are regarded as a sign of virility •Religious beliefs encourage large families
  • 6.
    High death rates •Diseasesand plagues (bubonic , cholera , kwashiorkor) •Famine , uncertain food supplies and poor diet •War •Poor hygiene no piped water , clean water and no sewage disposal •Little medical science , high doctor patient ratio. •Competition for food For example: Least economically developed countries today: Somalia, and Britain in the 18th century
  • 7.
    Stage 2: Birthrates remain high but Death rates fall rapidly For example: Britain in the 19th century, Bangladesh , Nigeria
  • 8.
    The fall ondeath rates results from : •Improved medical care – vaccinations , hospitals, doctors, new drugs and scientific inventions. •Improved sanitation •Improvements in food supplies •A decrease in child mortality.
  • 9.
    Stage 3: Fallin both Birth rates and Death rates. Usually as a result of : •Improved economic conditions •An increase in women status •Access to contraception •Increased mechanization reducing need for workers •Increased standards of living
  • 10.
    Stage 4 :Low fluctuating ,Low Birth rate and Low Birth rate Due to •Political stability •Changes in personal lifestyles •More women are in the workforce therefore less couples are having kids
  • 11.
    Stage 5? :declining population Theoretical Death rate exceeds birth rates Negative NIR (natural increase rate : crude birth rate – crude death rate) Mostly eastern European countries are projected so : Russia, Belarus Germany Italy Japan . Most developed are predicted to experience population decline •Factor of more elderly than young population in these countries •Fewer young women who will be entering their child bearing years •Elderly support ratio- the number of working age people (15-64) divided by the number of persons 65 or older.
  • 12.
    Factor affecting thepopulation pyramids. •Fertility •Birth rate •Death rate •Migration (immigration and emigration) •Disease out breaks •Natural disasters
  • 13.
    Presentation done by: T. BERE – R164423S T. SAMANYANGA – R164540T T. MANGOSHO – R164538X K.K. SADZAUCHI – R164430Z M. MAFUMO – R164539K J.J. MUKWEWA – R164525J M.T. TSEKENI – R164424L N. NYANDORO – R165832R T. MADONDO – R165526Y A. NYONI – R164522S THE END