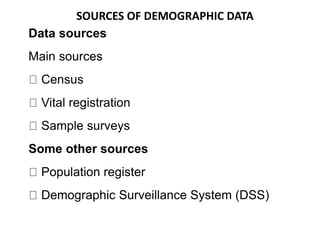
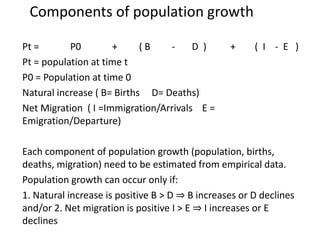
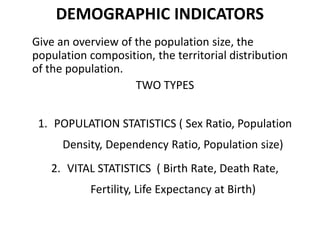
DEMOGRAPHY
Statistical study of human population
Reference to size and density
Distribution, and vital statistics
(Births, marriages, deaths etc.)
BASIC CONCEPT
The study of demography covers five
basic topics: the size of the population;
its distribution across geographic areas;
its composition (e.g., age, sex, race, and
other characteristics); changes in
population size, distribution, and
composition over time; and the
determinants and consequences of
population growth.
COMPONENTS
-Determining elements of
population change/ growth
Births
Deaths
Migration
PRINCIPLES
Demographers focus specific indicators of
change.
Death rates which are also referred to as
fertility and mortality.
Migration trends
Monogamous couple, must have in order to
replace the existing population.
RATES, RATIOS, PROPORTIONS, %S
A demographic rate expresses the number of events
occurring relative to person years at risk of the event in
a defined population for a specified time and place. It
may be expressed per person year, per 1,000 person
years, per 100,000 person years at risk, and so on. The
denominator, person years at risk, is often estimated by
means of the mid-year population or by the average of
two end-year population figures, each of these being an
approximation to the average population during the
year.
RATES=
Number of deaths in 2010 * 100,000
Estimated District population in 2020
OR
100/331,849*100,000 = 3013
RATIOS
A population ratio shows the relationship of one
population subgroup to another or a subgroup to the
entire population.
Determine the size of the first population group. For
example, assume there are 10,000 Lebanese in the total
population in S/L.
Determine the size of the second population group. For
example, assume there are 20,000 Fullas in the total
population.
Divide the Fulla population, 20,000, by the Lebanese
population, 10,000, to find the ratio of Fullas to Lebanese:
20,000 divided by 10,000 is 2 to 1 -- there are two Fullas
to every Lebanese.
PROPORTIONS & PERCENTAGES
Some examples of common
demographics include age, gender,
income level, occupation and so on.
These labels are used to describe the
socioeconomic characteristics of any
given population, and they're usually
expressed as a percentage. That allows
you to compare each demographics'
proportion to the entire population, no
matter what the size of said population.
CONT.
Divide the target
demographic by the
entire population, and
then multiply the result
by 100 to convert it to a
percentage.
CONT.
1.Gather Your Statistics
In order to calculate demographic percentages,
you need two pieces of information: How many
people belong to the particular demographic
you're measuring, and how many people belong
to the entire population.
Example: Imagine that you've been asked to
calculate the demographic percentage of men,
in a population of 700 people where 315 of
them are men.
CONT.
2. Divide by Entire Population
Divide the number of people in your demographic (in
the example, that's 315 men) by the entire population
(in this case, 700 people). That gives you:
315 ÷ 700 = 0.45
3. Convert to Percentage
Multiply the result from Step 2 by 100 to convert it into a
percentage:
0.45 × 100 = 45 percent
So in this example, men make up 45 percent of the
population.
DEFECTS IN RATES
Crude rates: A crude rate is used to
describe the frequency of a demographic
event across the total population, without
regard to age or sex. The standard
reference period is one year. Because the
population is usually not the same at the
beginning and end of the year, the
denominator for crude rates is the
average of the population at the
beginning and end of the one year period.
The numerator is the number of vital
events (e.g., births, deaths) observed for
the total population in the specified
calendar year.
CONT.
Crude Birth Rate (CBR): no. of births
per 1,000 persons in a population over a
given period of time (i.e. 1 year). This
rate is most often used when looking at
fertility, though the crude measure does
not account for important variations in
population fertility such as sex ratios, age
distributions, postponement or
acceleration of marriage age, all of which
can alter the way that the crude rate
should be interpreted.
CONT.
Example: In the town of
Kamabai, Northern S/L,
there were 5663 births.
The total population was
149,442. The CBR is:
5663/149,442 * 1000 = 37.9
CONT.
Neonatal Mortality Rate (NNMR):
Neonatal mortality is defined as the
annual number of neonatal deaths among
infants under the age of 28 days divided
by the mid-year population of all infants
under the age of 28 days. However,
because mid-year population is only
available in certain countries and only for
those years in which a census takes
place, the most commonly used formula
is as follows:
CONT.
(No. deaths of neonates <28 days in a given year)*1,000
No. of live births in the previous year
NNMR is very often underestimated, as neonatal deaths
may go unreported, particularly if the birth was never
reported or the death occurs in the period before the
child’s naming or baptism. High NNMR rates are important
as an indicator of neonatal tetanus mortality, which is
preventable by giving the mother anti-tetanus vaccines
during pregnancy. marked differences in NNMR by birth-
weight, and between developing and developed countries.
CONT.
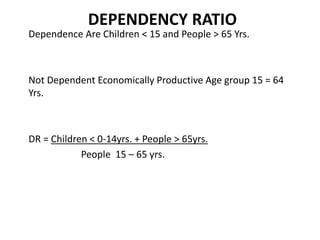
Infant Mortality Rate (IMR): Infant
mortality is the annual number of infant
deaths among infants under the age of 1
year divided by the mid-year population
of all infants under the age of 1 year.
However, because mid-year population is
only available in certain countries and
only for those years in which a census
takes place, the most commonly used
formula is as follows:
[# deaths of infants <1 yr. in the current year] /[# live
births in the previous year] * 1,000
CONT.
Example: In 1995, Sierra Leone
had 548,000 births. In 1996 the
country registered 74,528 deaths to
children under age 1. The IMR is
estimated as:
(74,528/548,000) * 1000 = 136.
SOURCES OF DEMOGRAPHIC DATA
Data sources
Main sources
Census
Vital registration
Sample surveys
Some other sources
Population register
Demographic Surveillance System (DSS)
DATA SOURCES-CENSUS
"The total process of collecting, compiling,
evaluating, analysing, and publishing or otherwise
disseminating demographic, economic and social
data pertaining to all persons in a country or in a
well delineated part of a country at a specified
time.” (United Nations 2008)
CONT.
> Total process
Not sufficient to simply collect and collate information in a
census, but also analyze, publish and disseminate the data.
> Demographic, economic and social data
To collect more than just a simple headcount of the
population
> Universality
To enumerate all people in a population
> Simultaneity
To produce a snapshot of the population at a point in time
Components of population growth
Pt = P0 + ( B - D ) + ( I - E )
Pt = population at time t
P0 = Population at time 0
Natural increase ( B= Births D= Deaths)
Net Migration ( I =Immigration/Arrivals E =
Emigration/Departure)
Each component of population growth (population, births,
deaths, migration) need to be estimated from empirical data.
Population growth can occur only if:
1. Natural increase is positive B > D ⇒ B increases or D declines
and/or 2. Net migration is positive I > E ⇒ I increases or E
declines
VITAL REGISTRATION
Vital registration systems record the
occurrence and characteristics of vital
events pertaining to the population and
serve as a main source of vital
statistics. Countries with complete vital
statistics registries may have more
accurate and timely demographic
indicators.
DEMOGRAPHIC INDICATORS
Give an overview of the population size, the
population composition, the territorial distribution
of the population.
TWO TYPES
1. POPULATION STATISTICS ( Sex Ratio, Population
Density, Dependency Ratio, Population size)
2. VITAL STATISTICS ( Birth Rate, Death Rate,
Fertility, Life Expectancy at Birth)
SEX RATIO:
No. of females/1000 males
CHILD SEX RATIO: No. of Female Children
Between ages ( 0-6 yrs.)/1000 Male
Children Between (0-6 yrs.)
DEPENDENCY RATIO
Dependence Are Children < 15 and People > 65 Yrs.
Not Dependent Economically Productive Age group 15 = 64
Yrs.
DR = Children < 0-14yrs. + People > 65yrs.
People 15 – 65 yrs.
ASSIGNMENT
Explain: a. Demographic Burden
b. Demographic Bonus
SAMPLE SURVEYS
Sample surveys are conducted by selecting units
from a population and recording information or
data on the units. The units comprise the population
and can be individuals or households;
businesses or other establishments; students,
teachers, or schools; acres of land; financial
accounts or items in inventory; or any other element
that can be meaningfully thought of as
defining a population to be studied. This chapter
gives an outline of the steps that are necessary
to conduct a scientific sample survey and discusses
many of the practical issues involved.
CONT.
Scientific means that the survey adheres to
standards that enable one to make
defensible, statistical statements about the
population of
interest.

DEMOGRAPHY.pptx

  • 1.
    DEMOGRAPHY Statistical study ofhuman population Reference to size and density Distribution, and vital statistics (Births, marriages, deaths etc.)
  • 2.
    BASIC CONCEPT The studyof demography covers five basic topics: the size of the population; its distribution across geographic areas; its composition (e.g., age, sex, race, and other characteristics); changes in population size, distribution, and composition over time; and the determinants and consequences of population growth.
  • 3.
    COMPONENTS -Determining elements of populationchange/ growth Births Deaths Migration
  • 4.
    PRINCIPLES Demographers focus specificindicators of change. Death rates which are also referred to as fertility and mortality. Migration trends Monogamous couple, must have in order to replace the existing population.
  • 5.
    RATES, RATIOS, PROPORTIONS,%S A demographic rate expresses the number of events occurring relative to person years at risk of the event in a defined population for a specified time and place. It may be expressed per person year, per 1,000 person years, per 100,000 person years at risk, and so on. The denominator, person years at risk, is often estimated by means of the mid-year population or by the average of two end-year population figures, each of these being an approximation to the average population during the year.
  • 6.
    RATES= Number of deathsin 2010 * 100,000 Estimated District population in 2020 OR 100/331,849*100,000 = 3013
  • 7.
    RATIOS A population ratioshows the relationship of one population subgroup to another or a subgroup to the entire population. Determine the size of the first population group. For example, assume there are 10,000 Lebanese in the total population in S/L. Determine the size of the second population group. For example, assume there are 20,000 Fullas in the total population. Divide the Fulla population, 20,000, by the Lebanese population, 10,000, to find the ratio of Fullas to Lebanese: 20,000 divided by 10,000 is 2 to 1 -- there are two Fullas to every Lebanese.
  • 8.
    PROPORTIONS & PERCENTAGES Someexamples of common demographics include age, gender, income level, occupation and so on. These labels are used to describe the socioeconomic characteristics of any given population, and they're usually expressed as a percentage. That allows you to compare each demographics' proportion to the entire population, no matter what the size of said population.
  • 9.
    CONT. Divide the target demographicby the entire population, and then multiply the result by 100 to convert it to a percentage.
  • 10.
    CONT. 1.Gather Your Statistics Inorder to calculate demographic percentages, you need two pieces of information: How many people belong to the particular demographic you're measuring, and how many people belong to the entire population. Example: Imagine that you've been asked to calculate the demographic percentage of men, in a population of 700 people where 315 of them are men.
  • 11.
    CONT. 2. Divide byEntire Population Divide the number of people in your demographic (in the example, that's 315 men) by the entire population (in this case, 700 people). That gives you: 315 ÷ 700 = 0.45 3. Convert to Percentage Multiply the result from Step 2 by 100 to convert it into a percentage: 0.45 × 100 = 45 percent So in this example, men make up 45 percent of the population.
  • 12.
    DEFECTS IN RATES Cruderates: A crude rate is used to describe the frequency of a demographic event across the total population, without regard to age or sex. The standard reference period is one year. Because the population is usually not the same at the beginning and end of the year, the denominator for crude rates is the average of the population at the beginning and end of the one year period. The numerator is the number of vital events (e.g., births, deaths) observed for the total population in the specified calendar year.
  • 13.
    CONT. Crude Birth Rate(CBR): no. of births per 1,000 persons in a population over a given period of time (i.e. 1 year). This rate is most often used when looking at fertility, though the crude measure does not account for important variations in population fertility such as sex ratios, age distributions, postponement or acceleration of marriage age, all of which can alter the way that the crude rate should be interpreted.
  • 14.
    CONT. Example: In thetown of Kamabai, Northern S/L, there were 5663 births. The total population was 149,442. The CBR is: 5663/149,442 * 1000 = 37.9
  • 15.
    CONT. Neonatal Mortality Rate(NNMR): Neonatal mortality is defined as the annual number of neonatal deaths among infants under the age of 28 days divided by the mid-year population of all infants under the age of 28 days. However, because mid-year population is only available in certain countries and only for those years in which a census takes place, the most commonly used formula is as follows:
  • 16.
    CONT. (No. deaths ofneonates <28 days in a given year)*1,000 No. of live births in the previous year NNMR is very often underestimated, as neonatal deaths may go unreported, particularly if the birth was never reported or the death occurs in the period before the child’s naming or baptism. High NNMR rates are important as an indicator of neonatal tetanus mortality, which is preventable by giving the mother anti-tetanus vaccines during pregnancy. marked differences in NNMR by birth- weight, and between developing and developed countries.
  • 17.
    CONT. Infant Mortality Rate(IMR): Infant mortality is the annual number of infant deaths among infants under the age of 1 year divided by the mid-year population of all infants under the age of 1 year. However, because mid-year population is only available in certain countries and only for those years in which a census takes place, the most commonly used formula is as follows: [# deaths of infants <1 yr. in the current year] /[# live births in the previous year] * 1,000
  • 18.
    CONT. Example: In 1995,Sierra Leone had 548,000 births. In 1996 the country registered 74,528 deaths to children under age 1. The IMR is estimated as: (74,528/548,000) * 1000 = 136.
  • 19.
    SOURCES OF DEMOGRAPHICDATA Data sources Main sources Census Vital registration Sample surveys Some other sources Population register Demographic Surveillance System (DSS)
  • 20.
    DATA SOURCES-CENSUS "The totalprocess of collecting, compiling, evaluating, analysing, and publishing or otherwise disseminating demographic, economic and social data pertaining to all persons in a country or in a well delineated part of a country at a specified time.” (United Nations 2008)
  • 21.
    CONT. > Total process Notsufficient to simply collect and collate information in a census, but also analyze, publish and disseminate the data. > Demographic, economic and social data To collect more than just a simple headcount of the population > Universality To enumerate all people in a population > Simultaneity To produce a snapshot of the population at a point in time
  • 22.
    Components of populationgrowth Pt = P0 + ( B - D ) + ( I - E ) Pt = population at time t P0 = Population at time 0 Natural increase ( B= Births D= Deaths) Net Migration ( I =Immigration/Arrivals E = Emigration/Departure) Each component of population growth (population, births, deaths, migration) need to be estimated from empirical data. Population growth can occur only if: 1. Natural increase is positive B > D ⇒ B increases or D declines and/or 2. Net migration is positive I > E ⇒ I increases or E declines
  • 23.
    VITAL REGISTRATION Vital registrationsystems record the occurrence and characteristics of vital events pertaining to the population and serve as a main source of vital statistics. Countries with complete vital statistics registries may have more accurate and timely demographic indicators.
  • 24.
    DEMOGRAPHIC INDICATORS Give anoverview of the population size, the population composition, the territorial distribution of the population. TWO TYPES 1. POPULATION STATISTICS ( Sex Ratio, Population Density, Dependency Ratio, Population size) 2. VITAL STATISTICS ( Birth Rate, Death Rate, Fertility, Life Expectancy at Birth)
  • 25.
    SEX RATIO: No. offemales/1000 males CHILD SEX RATIO: No. of Female Children Between ages ( 0-6 yrs.)/1000 Male Children Between (0-6 yrs.)
  • 26.
    DEPENDENCY RATIO Dependence AreChildren < 15 and People > 65 Yrs. Not Dependent Economically Productive Age group 15 = 64 Yrs. DR = Children < 0-14yrs. + People > 65yrs. People 15 – 65 yrs.
  • 27.
    ASSIGNMENT Explain: a. DemographicBurden b. Demographic Bonus
  • 28.
    SAMPLE SURVEYS Sample surveysare conducted by selecting units from a population and recording information or data on the units. The units comprise the population and can be individuals or households; businesses or other establishments; students, teachers, or schools; acres of land; financial accounts or items in inventory; or any other element that can be meaningfully thought of as defining a population to be studied. This chapter gives an outline of the steps that are necessary to conduct a scientific sample survey and discusses many of the practical issues involved.
  • 29.
    CONT. Scientific means thatthe survey adheres to standards that enable one to make defensible, statistical statements about the population of interest.