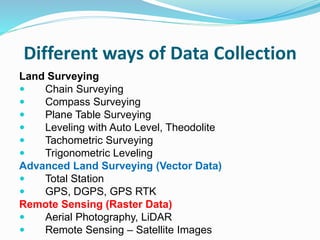
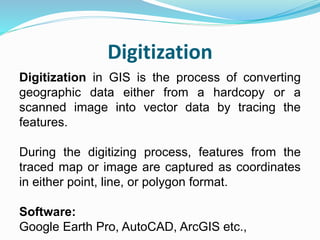
DATA COLLECTION
by
Dr. Rambabu Palaka,
Associate Professor
Dept. of Civil Engineering
B.V. RAJU INSTITUTE OF TECHNOLOGY
July 2016
DATA
1. Spatial Data
Data that define a location. It includes location, shape, size and
orientation. Often this is done with x, y coordinates or longitudes
and latitudes. These are in the form of
a) Points - Valves
b) Lines - Pipeline
c) Polygon - Water Tank
d) Pixels - Satellite Image, Aerial Photograph
2. Non-Spatial Data or Attribute Data
Data that relate to a specific location.
Ex.: Water Tank Capacity, Pipe Type, Pipe Size etc.,
Different ways of Data Collection
Land Surveying
 Chain Surveying
 Compass Surveying
 Plane Table Surveying
 Leveling with Auto Level, Theodolite
 Tachometric Surveying
 Trigonometric Leveling
Advanced Land Surveying (Vector Data)
 Total Station
 GPS, DGPS, GPS RTK
Remote Sensing (Raster Data)
 Aerial Photography, LiDAR
 Remote Sensing – Satellite Images
DATA TYPES
1. RASTER
Raster data is made up of pixels (also referred to as grid cells).
In raster, each pixel is associated with a value or class.
Ex.: Each pixel value in a digital aerial photograph is associated
with a red, green and blue value.
2. VECTOR
Vector data is not made up of a grid of pixels. Instead, vector
graphics are comprised of vertices and paths.
The three basic symbol types for vector data are points, lines
and polygons.
Ex.: AutoCAD Drawing
Different Sources of Spatial Data
1. Surveying of India (Hard Copy & Soft Copy)
a) Village Maps
b) TopoSheets
2. Nationa Remote Sensing Center (NRSC)
a) Satellite Data
b) Aerial Photographic Data
c) Thematic Layers (Vector Data)
3. ISRO Bhuvan Website
a) Satellite Data
b) Thematic Layers (Vector Data)
4. Google Maps or Google Earth Pro
Remote Sensing
Remote Sensing is the acquisition of
information about an object or
phenomenon without making physical
contact with the object and thus in
contrast to on site observation.
Remote Sensing
Device to sample and measure radiation
Medium = electromagnetic radiation
Target is the terrestrial environment
(atmosphere, oceans, land surface)
Remote Sensing
Device to sample and measure radiation (sensor)
LISS – III Camera
(Linear Imaging Self Scanning Sensor )
Aerial Photograph
Satellite Image
Digitization
Digitization in GIS is the process of converting
geographic data either from a hardcopy or a
scanned image into vector data by tracing the
features.
During the digitizing process, features from the
traced map or image are captured as coordinates
in either point, line, or polygon format.
Software:
Google Earth Pro, AutoCAD, ArcGIS etc.,
AutoCAD
AutoCAD is a CAD (Computer Aided Design or
Computer Aided Drafting) software application for
2D and 3D design and drafting.
Commands:
1. Tool Bar
2. Pull Down
3. KEY COMMANDS
4. From the Key board
AutoCAD
Toolbars:
(from left to right):
Line, Construction Line, Poly Line, Polygon, Rectangle, Arc, Circle, Spline,
Ellipse, …, Block, …., Point, Hatch, Region, Table, Text
Modify Toolbar:
(from left to right):
Erase, Copy, Mirror, Offset, Array, Move, Rotate, Scale, Stretch,
Lengthen, Trim, Extend, Break at point, Break, Chamfer, Fillet, Explode
Q&A

Data collection

  • 1.
    DATA COLLECTION by Dr. RambabuPalaka, Associate Professor Dept. of Civil Engineering B.V. RAJU INSTITUTE OF TECHNOLOGY July 2016
  • 2.
    DATA 1. Spatial Data Datathat define a location. It includes location, shape, size and orientation. Often this is done with x, y coordinates or longitudes and latitudes. These are in the form of a) Points - Valves b) Lines - Pipeline c) Polygon - Water Tank d) Pixels - Satellite Image, Aerial Photograph 2. Non-Spatial Data or Attribute Data Data that relate to a specific location. Ex.: Water Tank Capacity, Pipe Type, Pipe Size etc.,
  • 3.
    Different ways ofData Collection Land Surveying  Chain Surveying  Compass Surveying  Plane Table Surveying  Leveling with Auto Level, Theodolite  Tachometric Surveying  Trigonometric Leveling Advanced Land Surveying (Vector Data)  Total Station  GPS, DGPS, GPS RTK Remote Sensing (Raster Data)  Aerial Photography, LiDAR  Remote Sensing – Satellite Images
  • 4.
    DATA TYPES 1. RASTER Rasterdata is made up of pixels (also referred to as grid cells). In raster, each pixel is associated with a value or class. Ex.: Each pixel value in a digital aerial photograph is associated with a red, green and blue value. 2. VECTOR Vector data is not made up of a grid of pixels. Instead, vector graphics are comprised of vertices and paths. The three basic symbol types for vector data are points, lines and polygons. Ex.: AutoCAD Drawing
  • 7.
    Different Sources ofSpatial Data 1. Surveying of India (Hard Copy & Soft Copy) a) Village Maps b) TopoSheets 2. Nationa Remote Sensing Center (NRSC) a) Satellite Data b) Aerial Photographic Data c) Thematic Layers (Vector Data) 3. ISRO Bhuvan Website a) Satellite Data b) Thematic Layers (Vector Data) 4. Google Maps or Google Earth Pro
  • 8.
    Remote Sensing Remote Sensingis the acquisition of information about an object or phenomenon without making physical contact with the object and thus in contrast to on site observation.
  • 9.
    Remote Sensing Device tosample and measure radiation Medium = electromagnetic radiation Target is the terrestrial environment (atmosphere, oceans, land surface)
  • 10.
  • 11.
    Device to sampleand measure radiation (sensor) LISS – III Camera (Linear Imaging Self Scanning Sensor )
  • 13.
  • 14.
  • 16.
    Digitization Digitization in GISis the process of converting geographic data either from a hardcopy or a scanned image into vector data by tracing the features. During the digitizing process, features from the traced map or image are captured as coordinates in either point, line, or polygon format. Software: Google Earth Pro, AutoCAD, ArcGIS etc.,
  • 18.
    AutoCAD AutoCAD is aCAD (Computer Aided Design or Computer Aided Drafting) software application for 2D and 3D design and drafting. Commands: 1. Tool Bar 2. Pull Down 3. KEY COMMANDS 4. From the Key board
  • 19.
    AutoCAD Toolbars: (from left toright): Line, Construction Line, Poly Line, Polygon, Rectangle, Arc, Circle, Spline, Ellipse, …, Block, …., Point, Hatch, Region, Table, Text Modify Toolbar: (from left to right): Erase, Copy, Mirror, Offset, Array, Move, Rotate, Scale, Stretch, Lengthen, Trim, Extend, Break at point, Break, Chamfer, Fillet, Explode
  • 23.