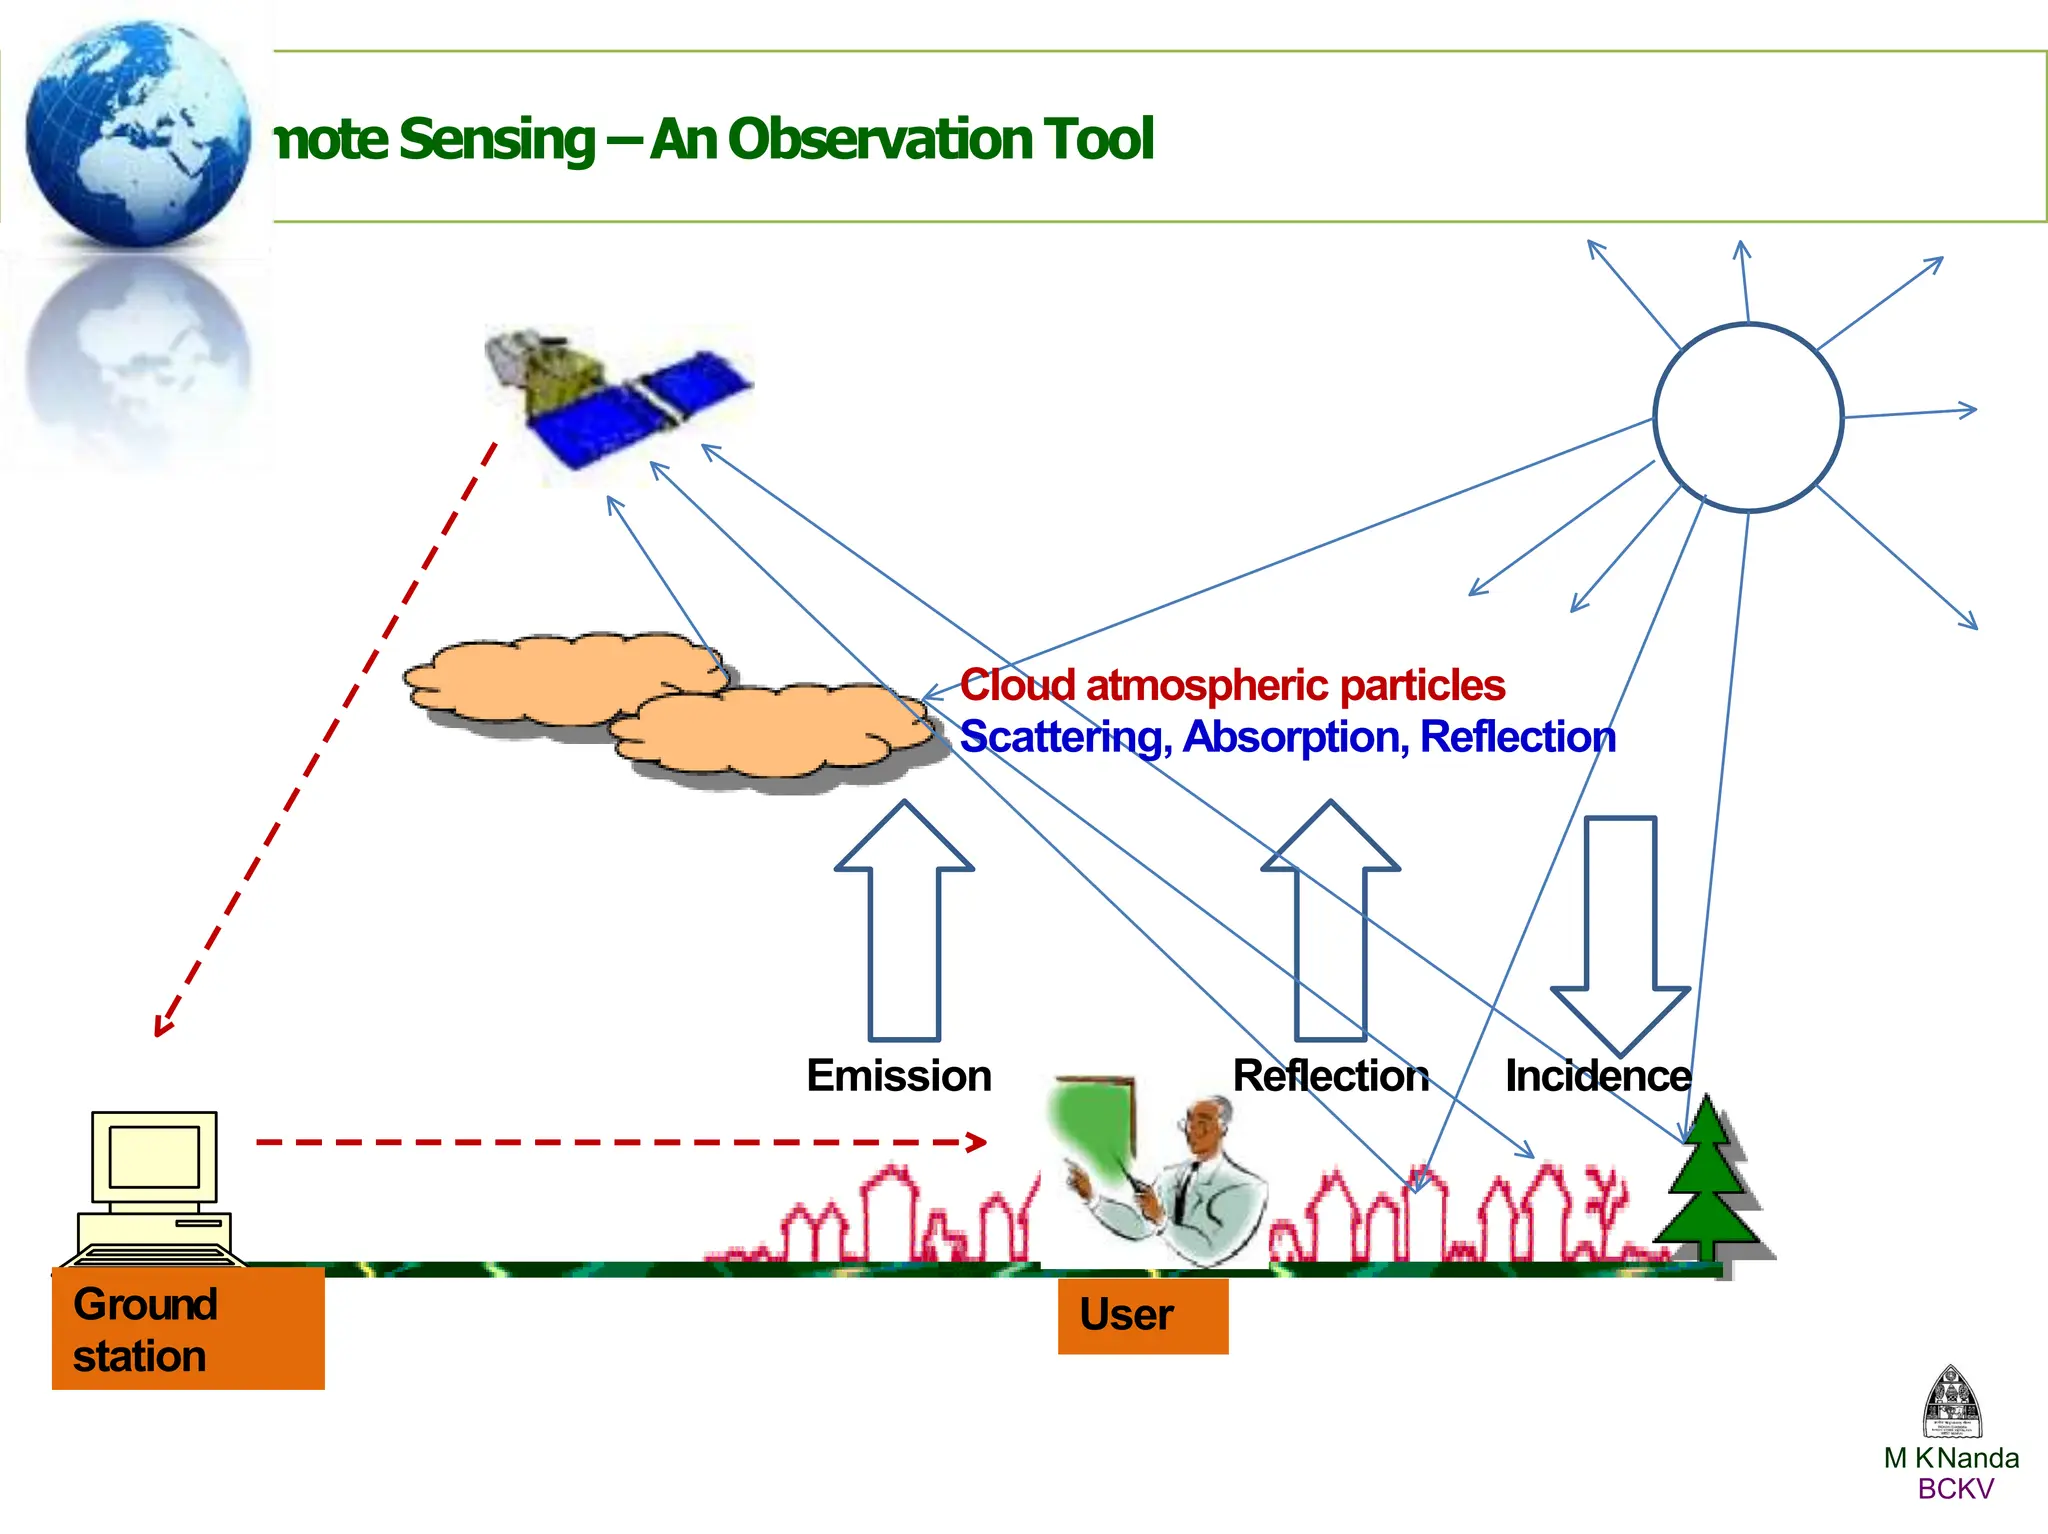
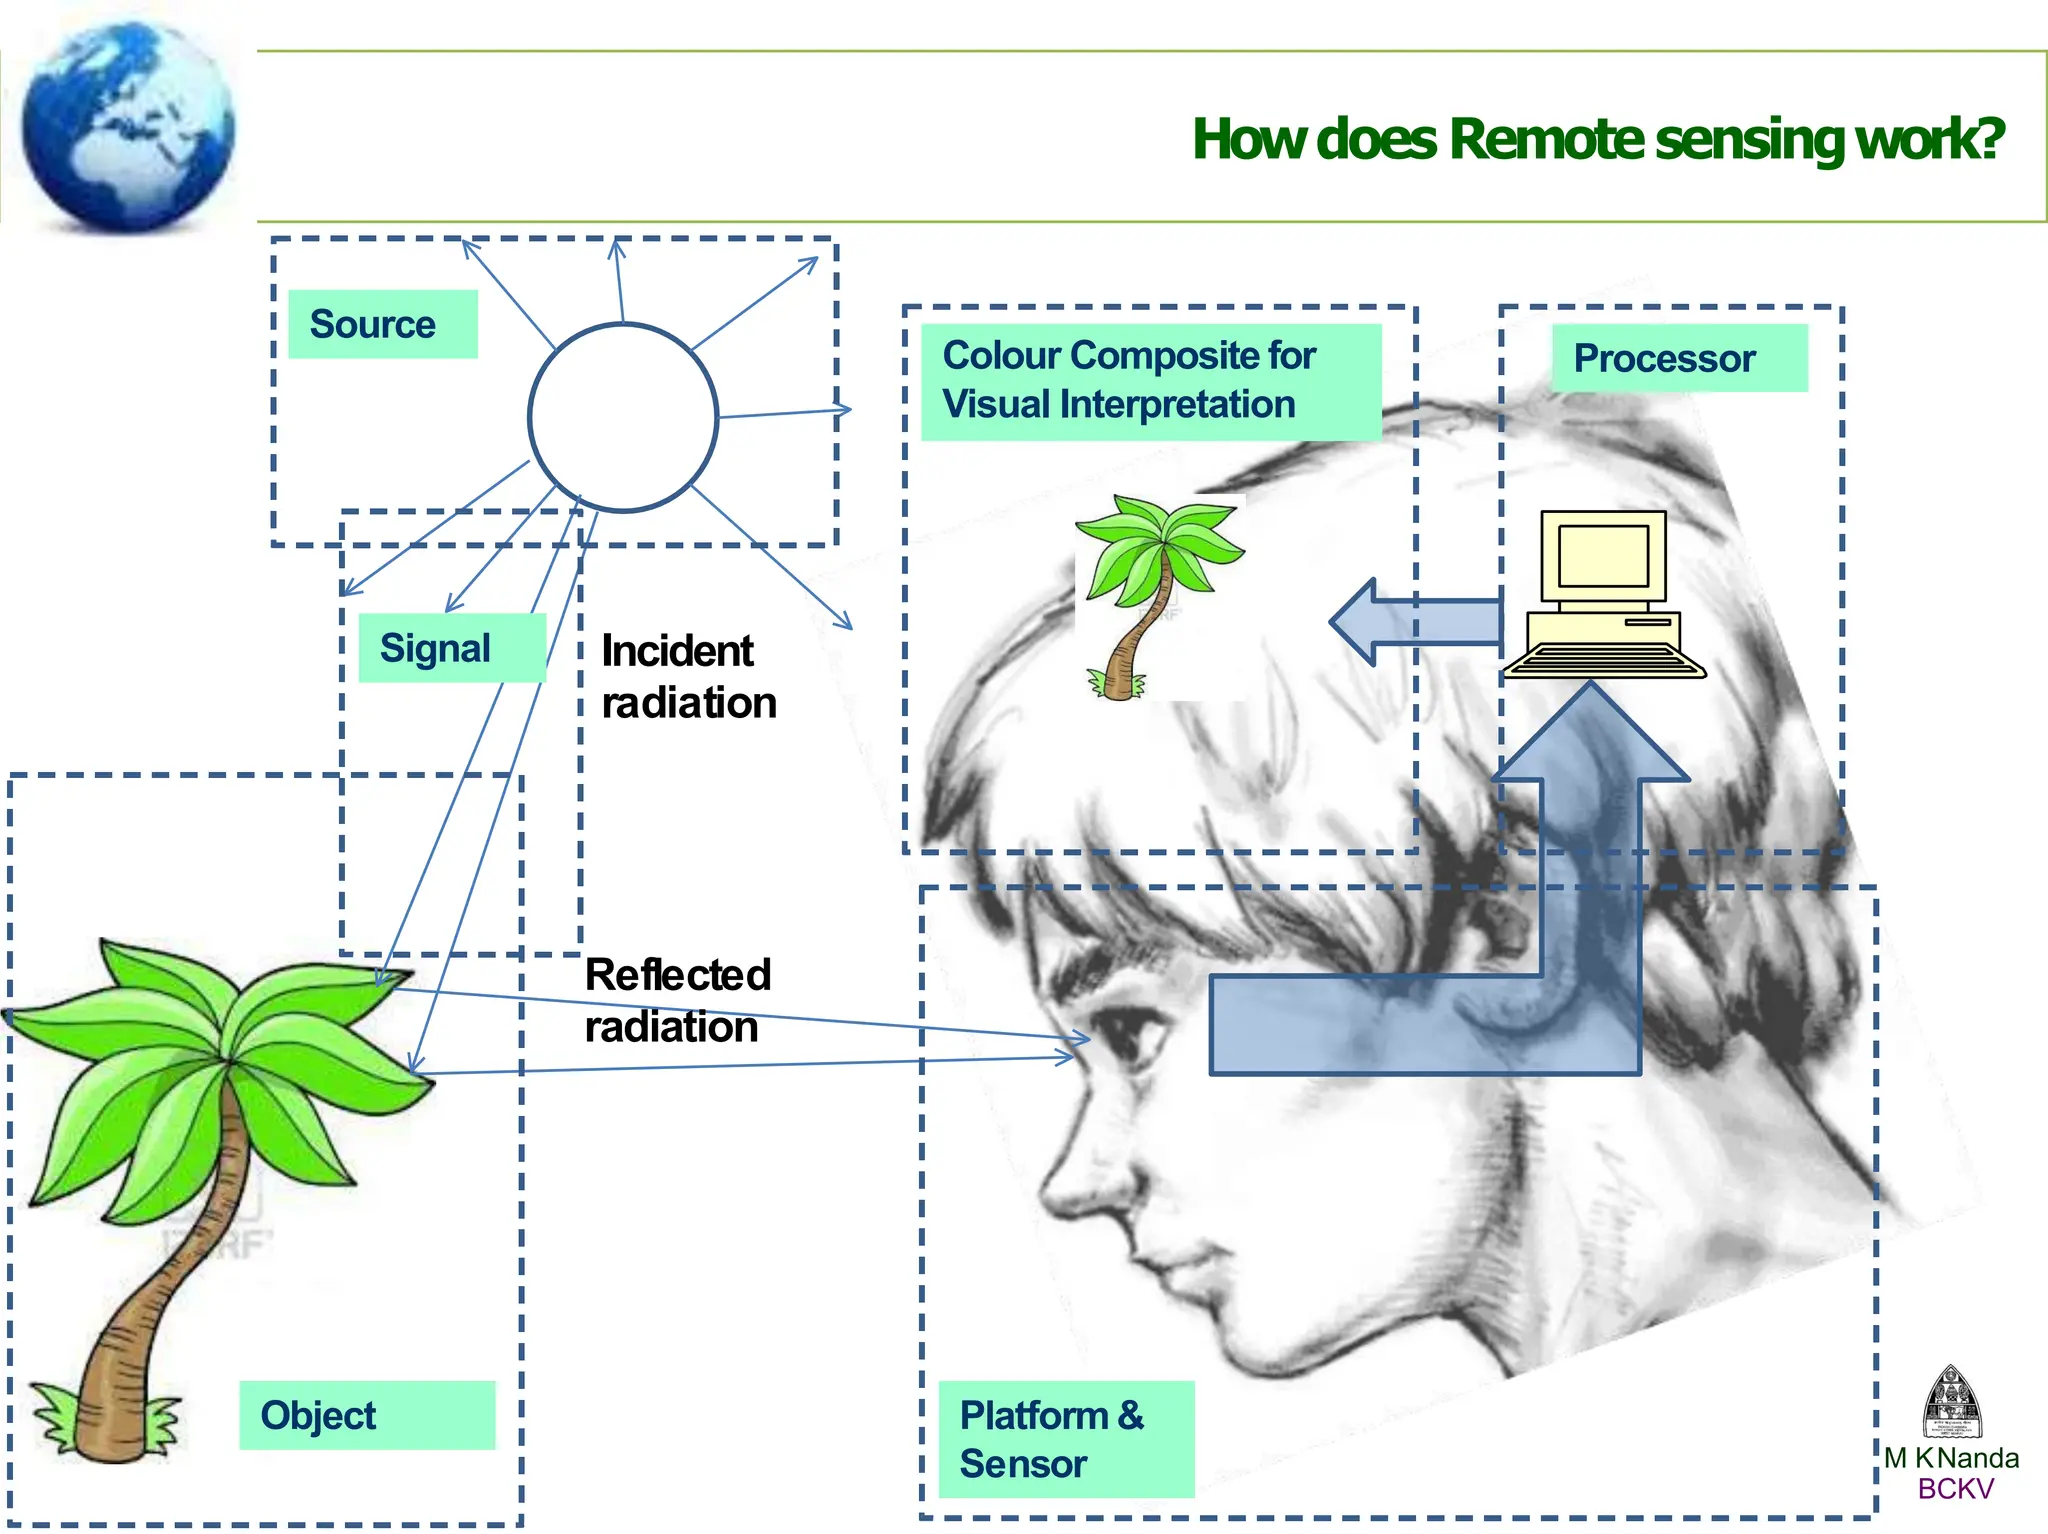
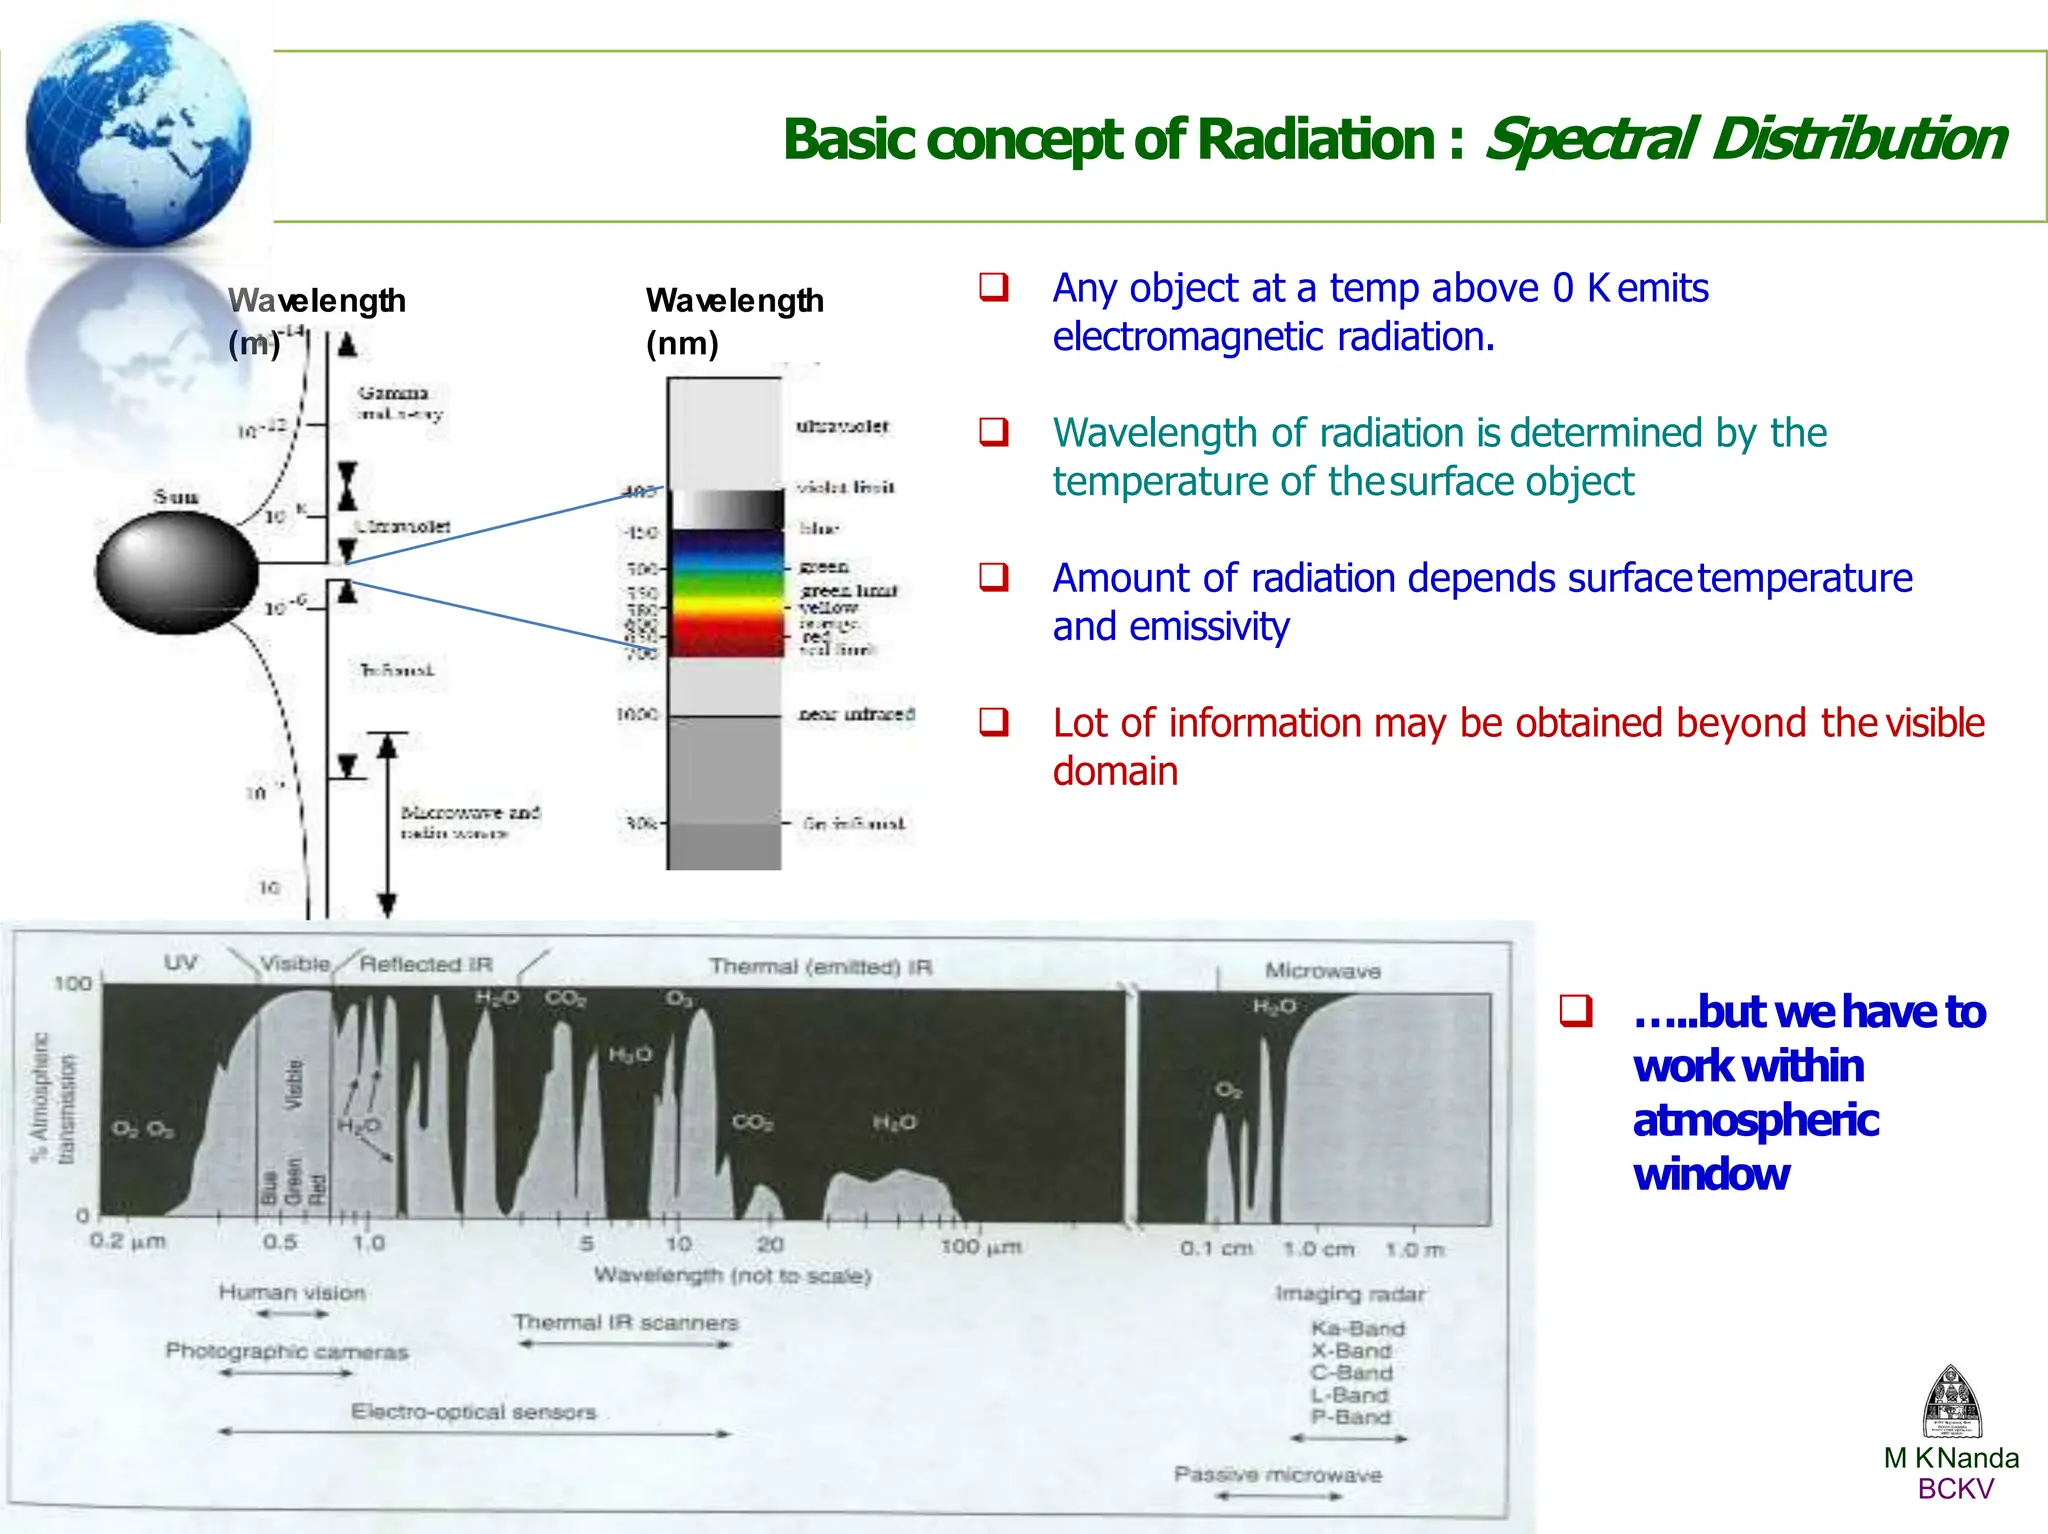
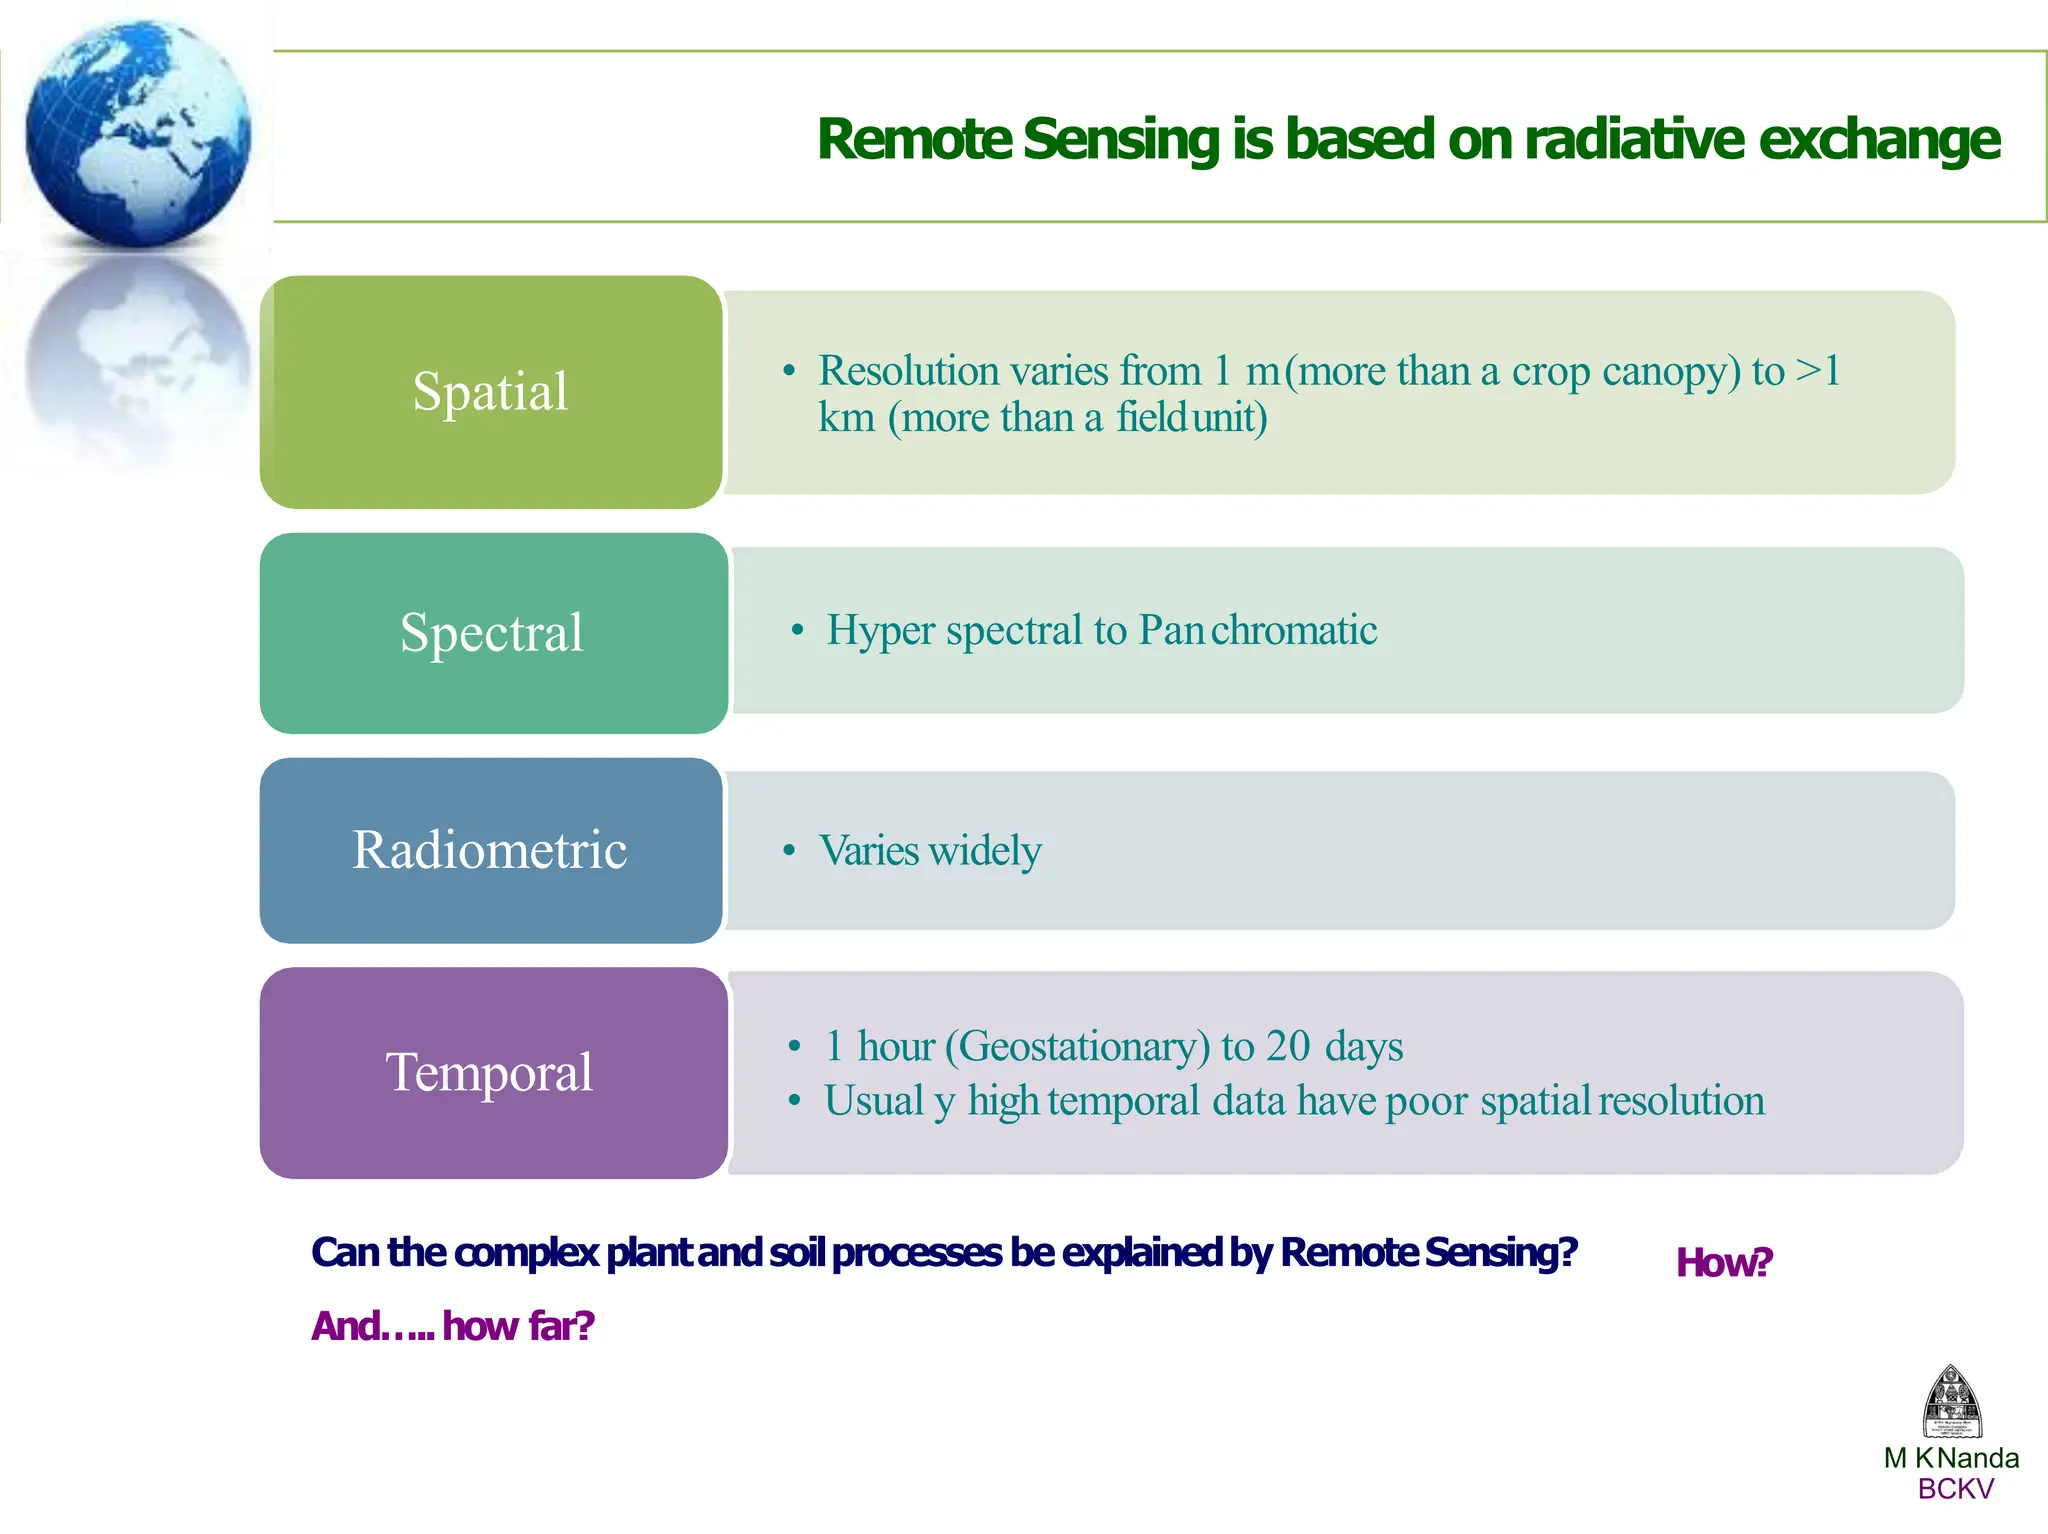
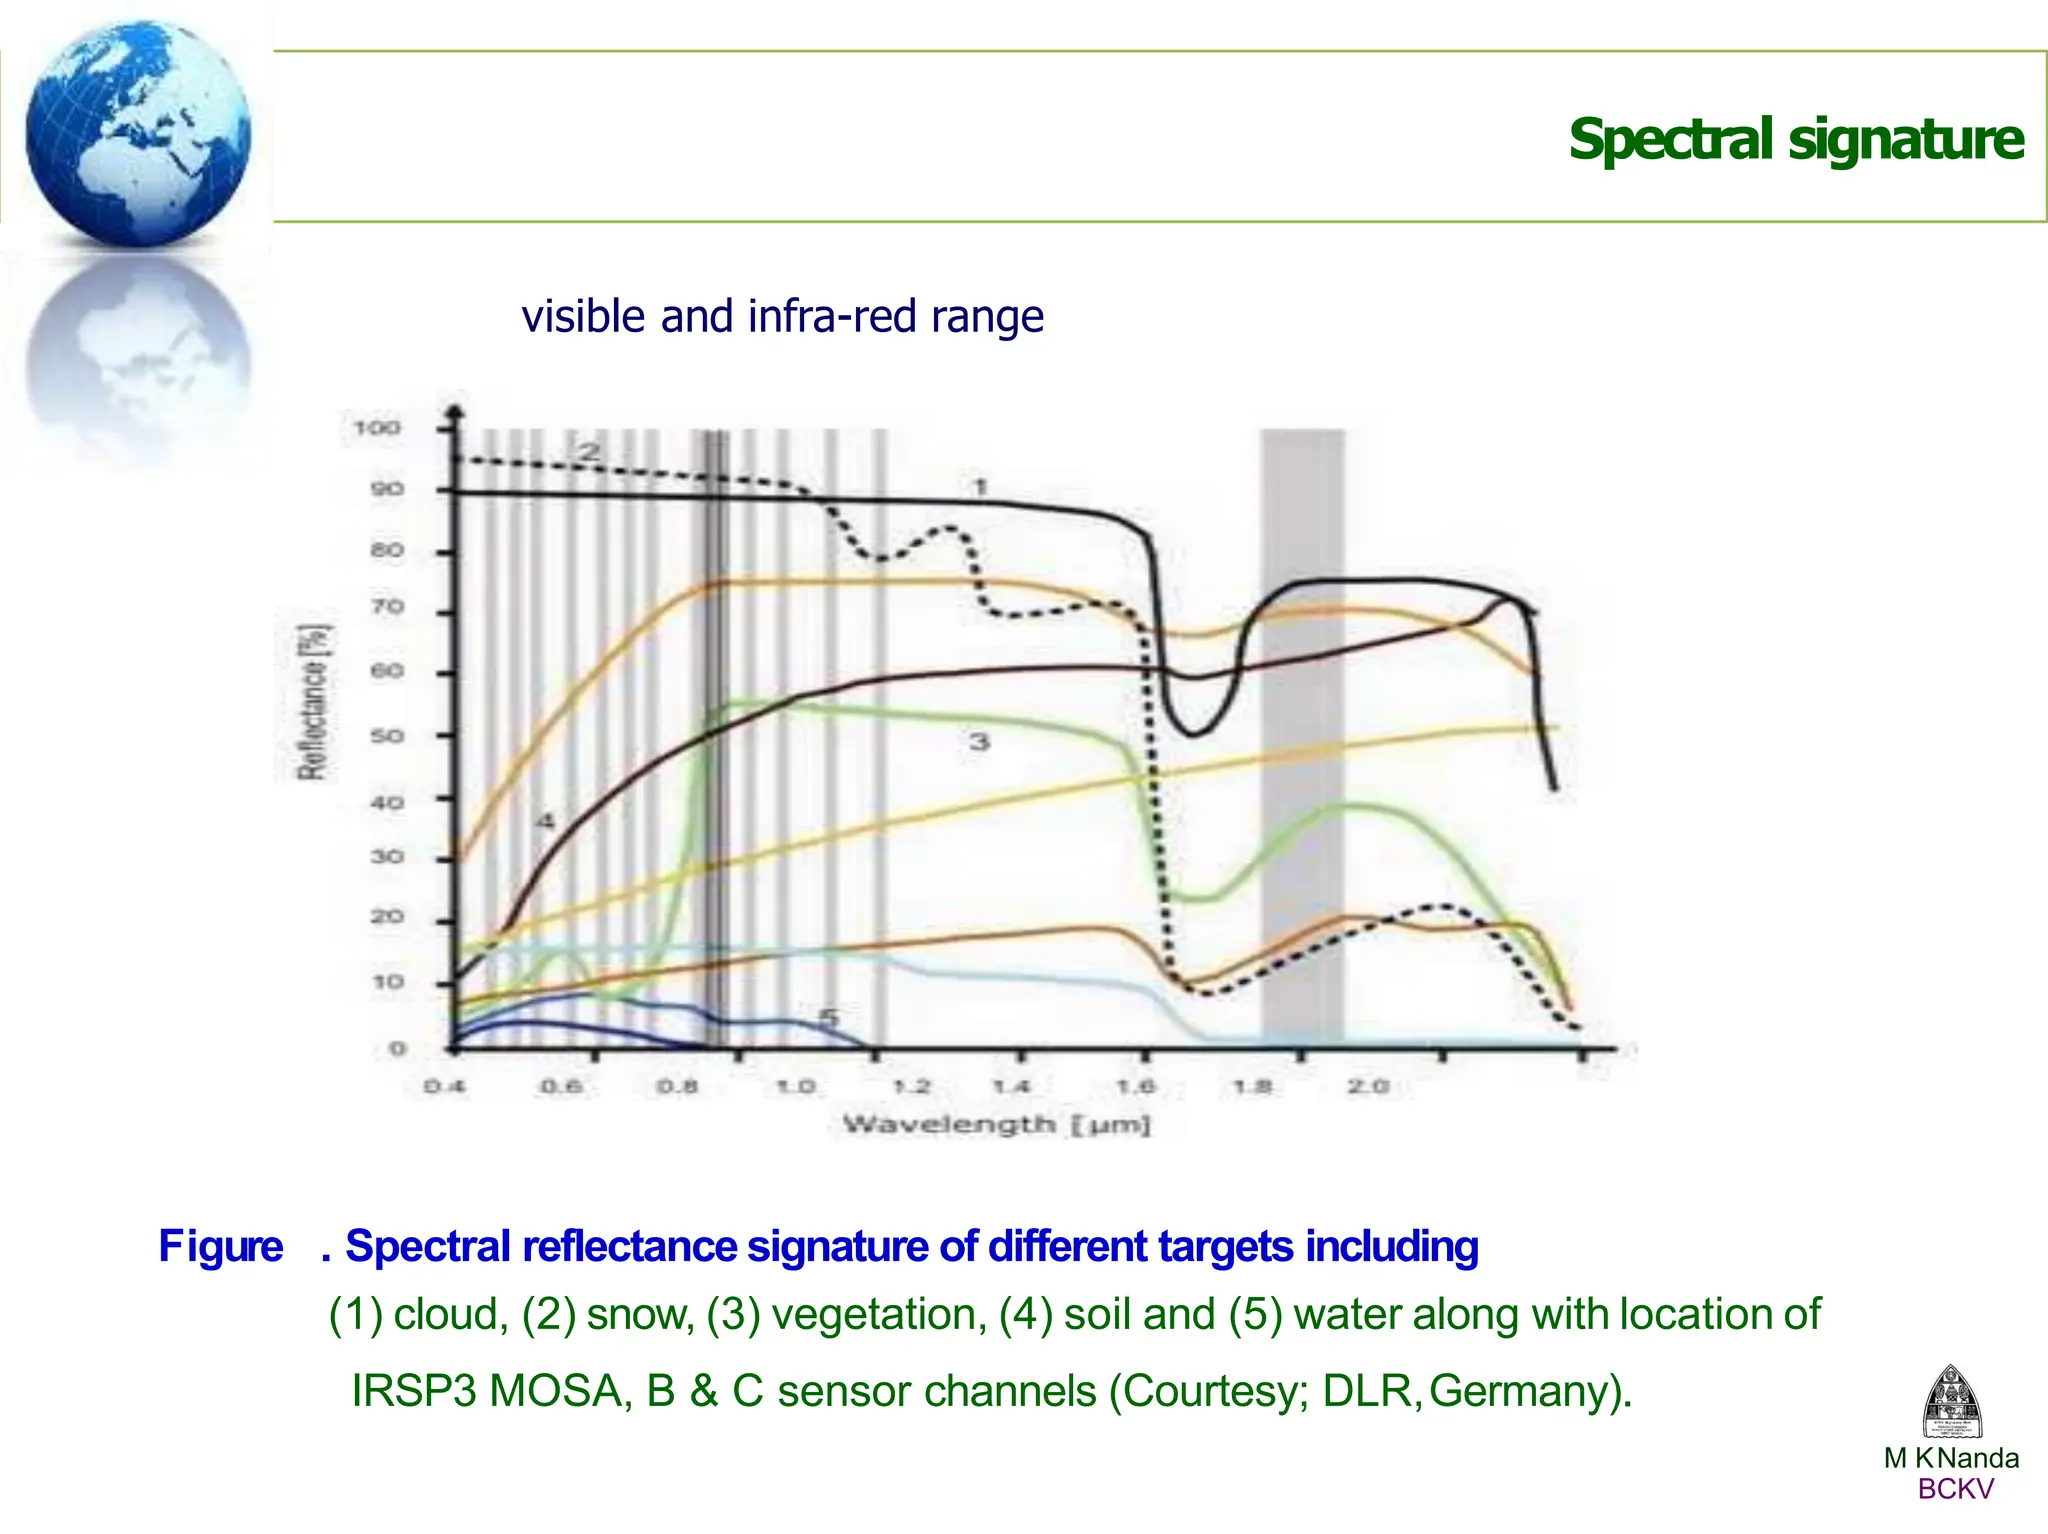
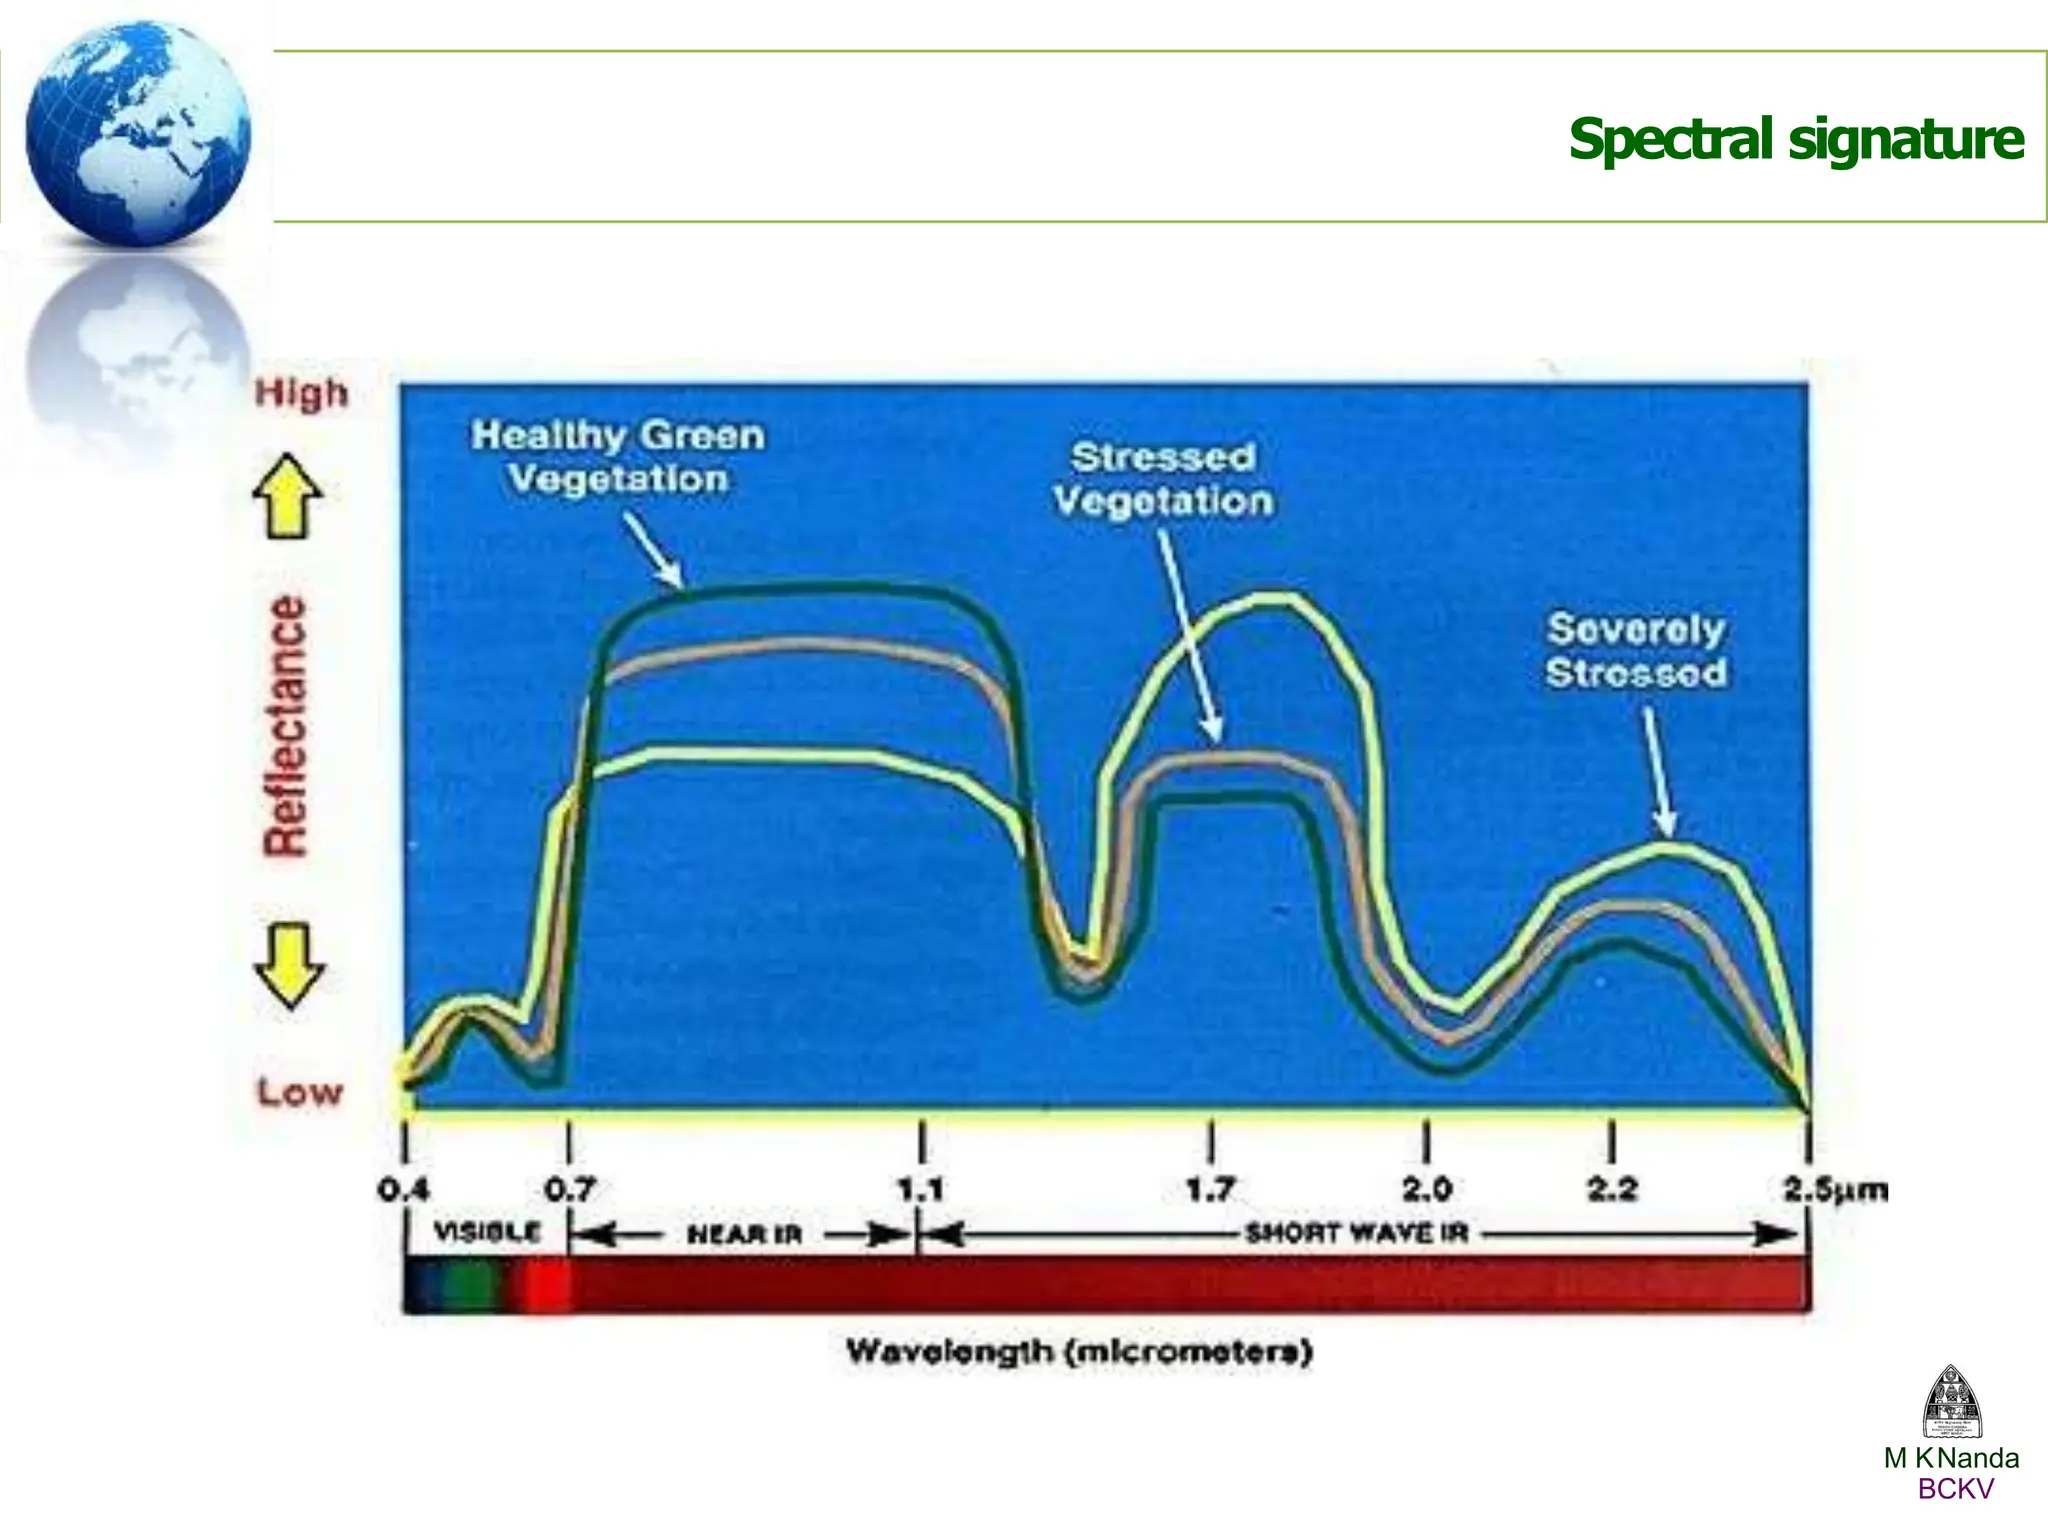
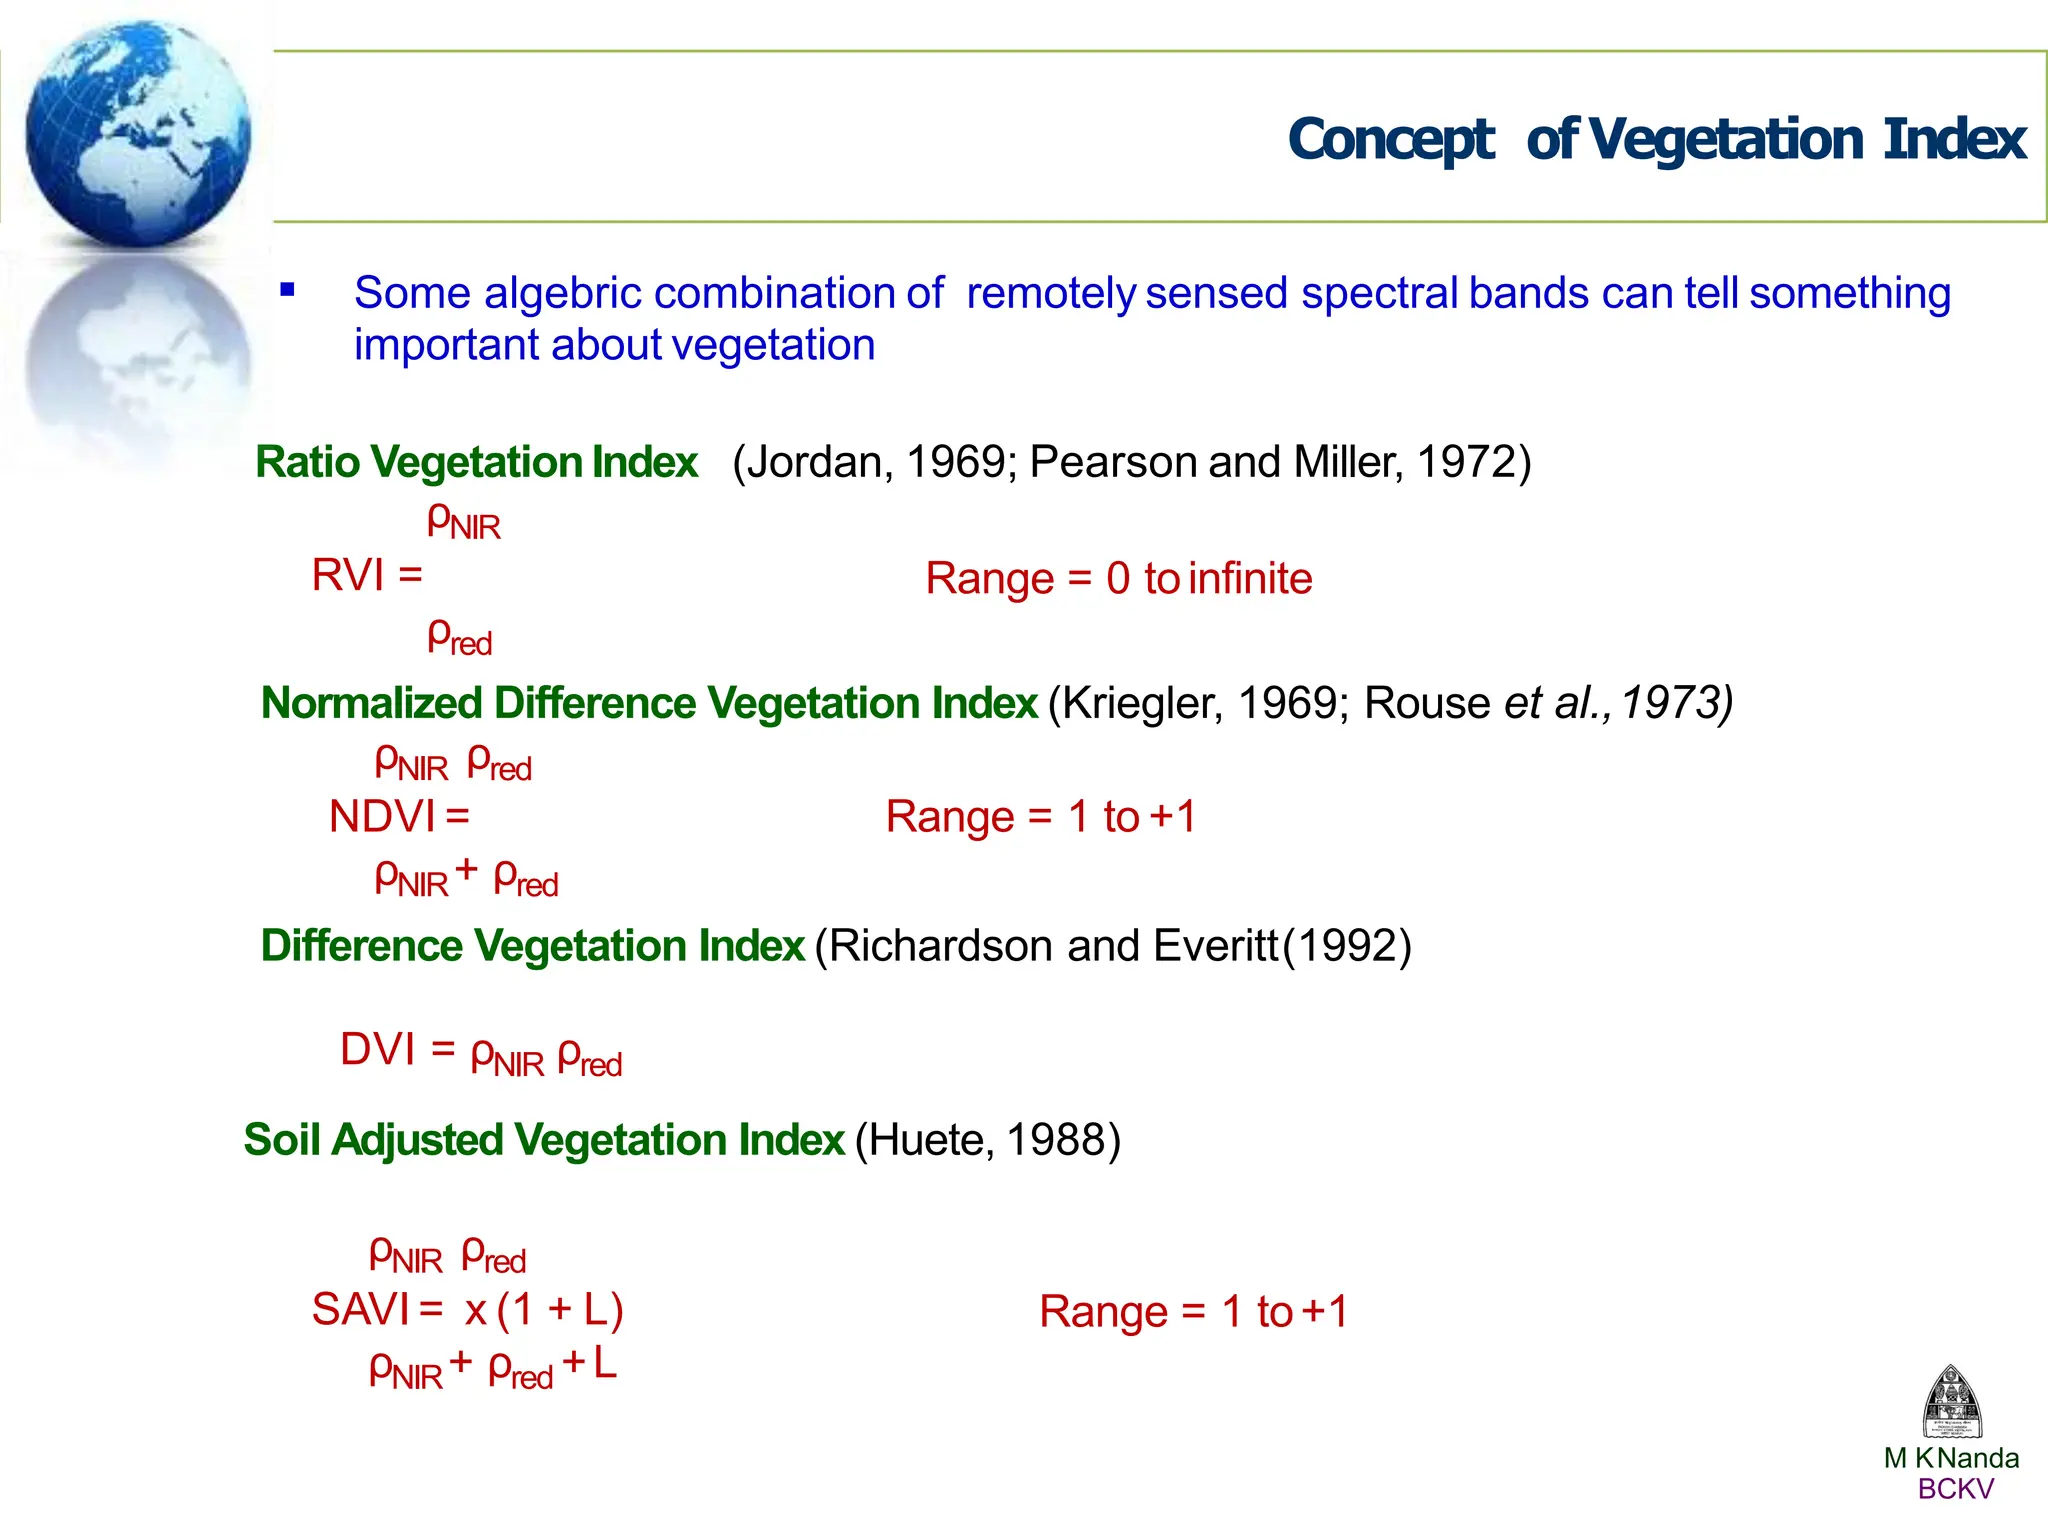
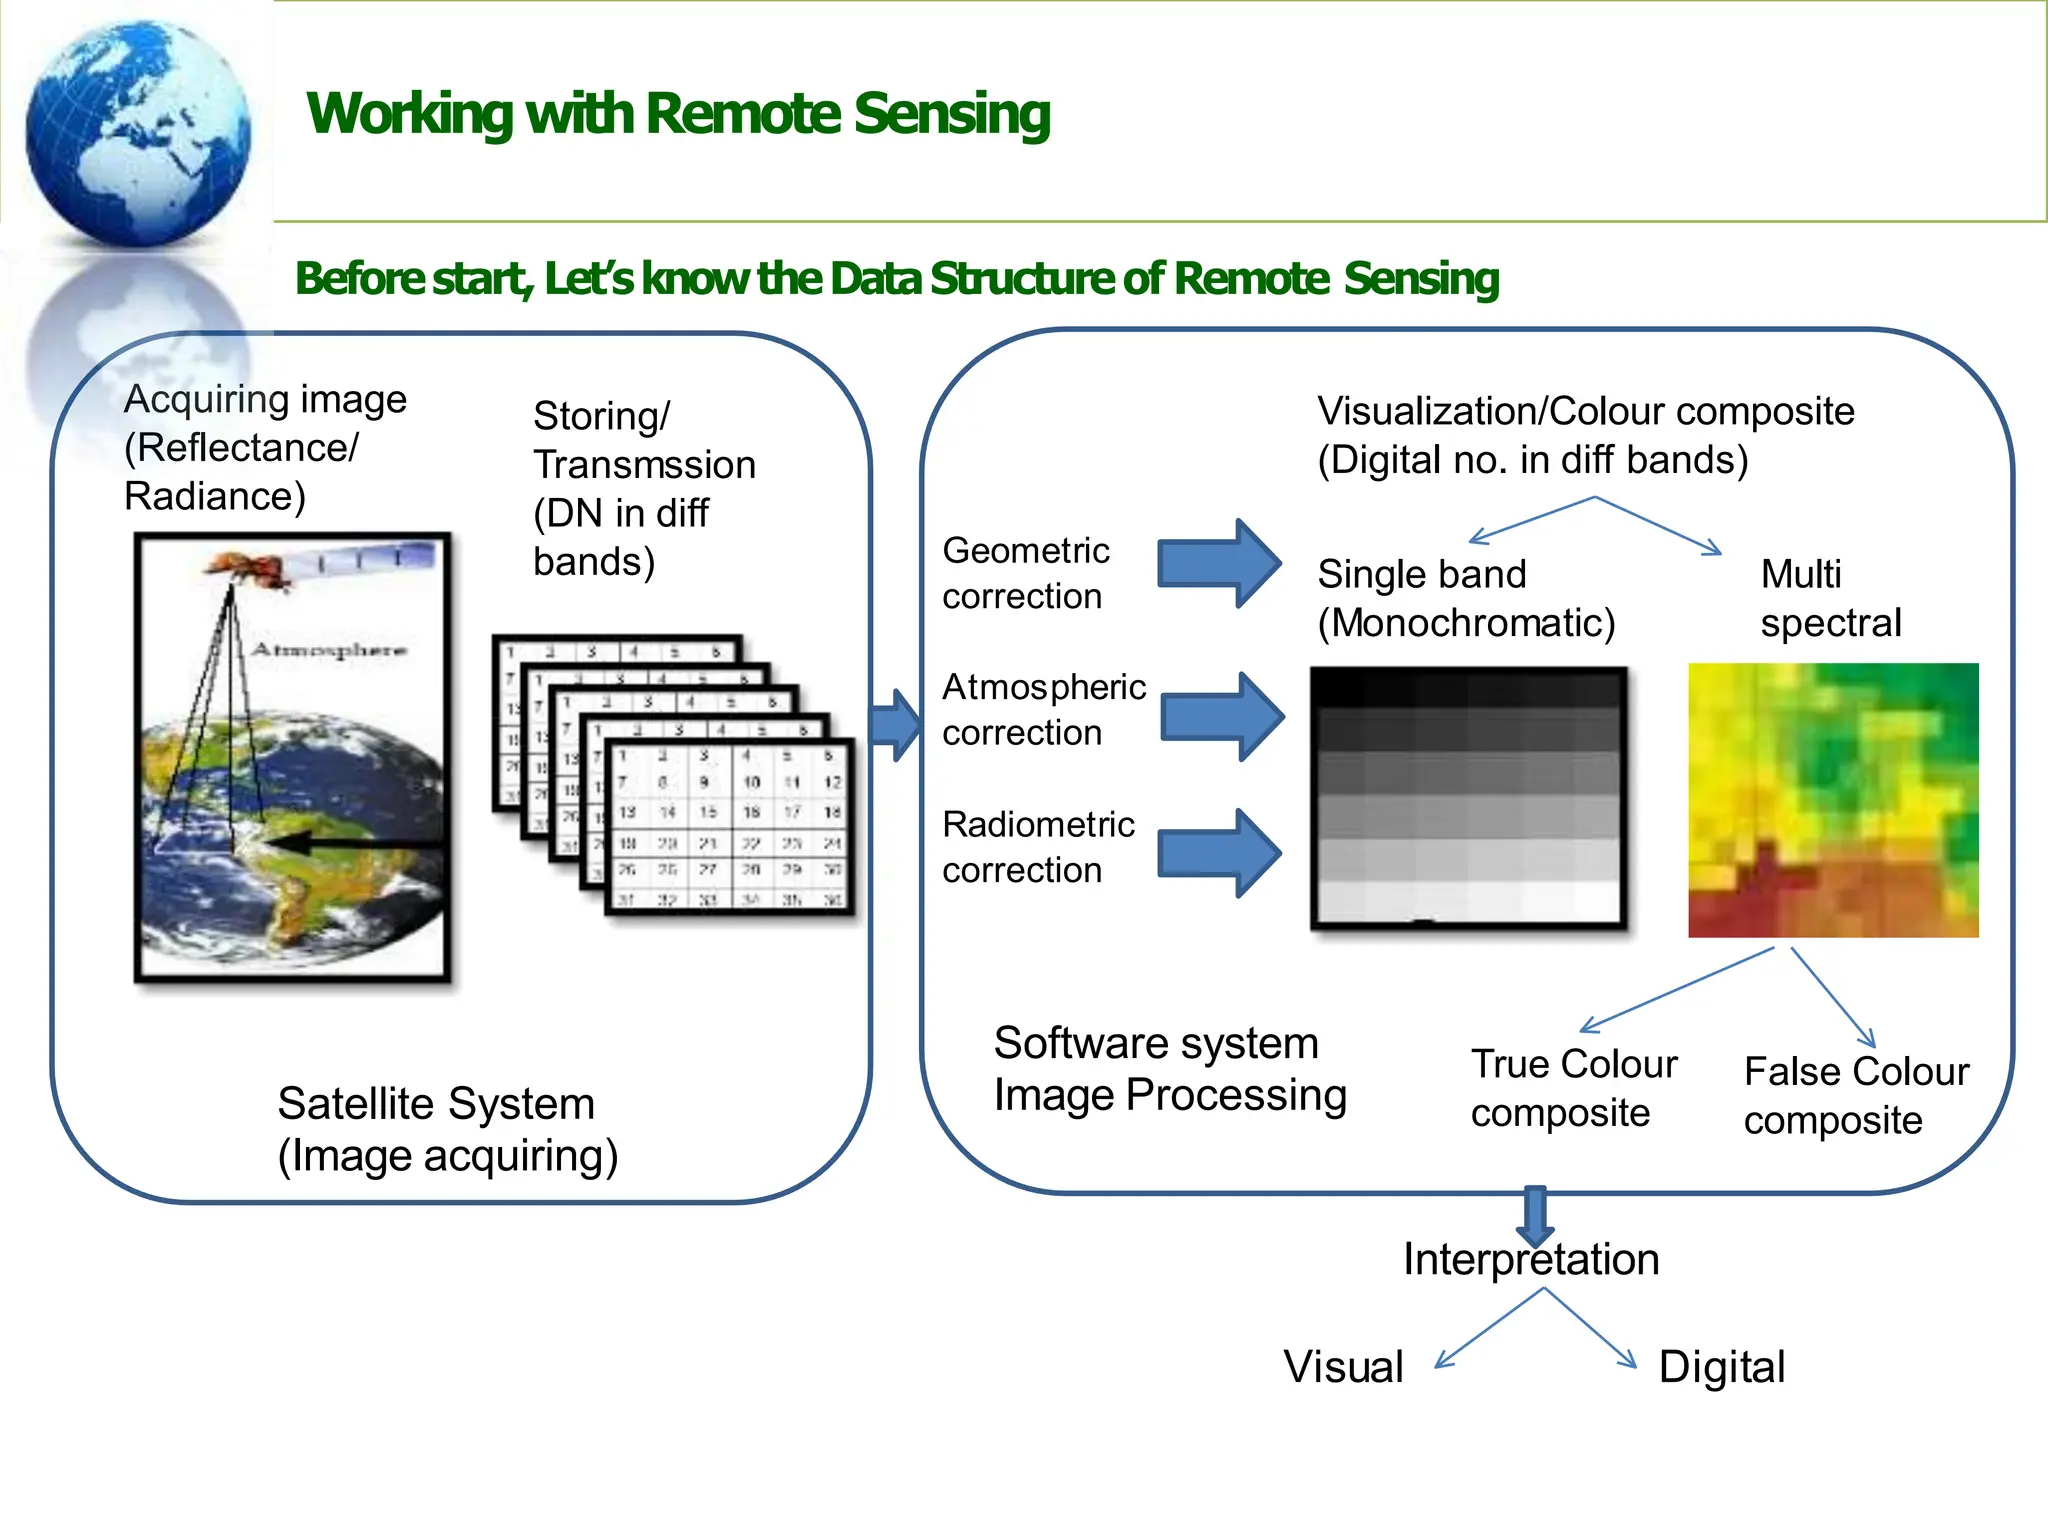
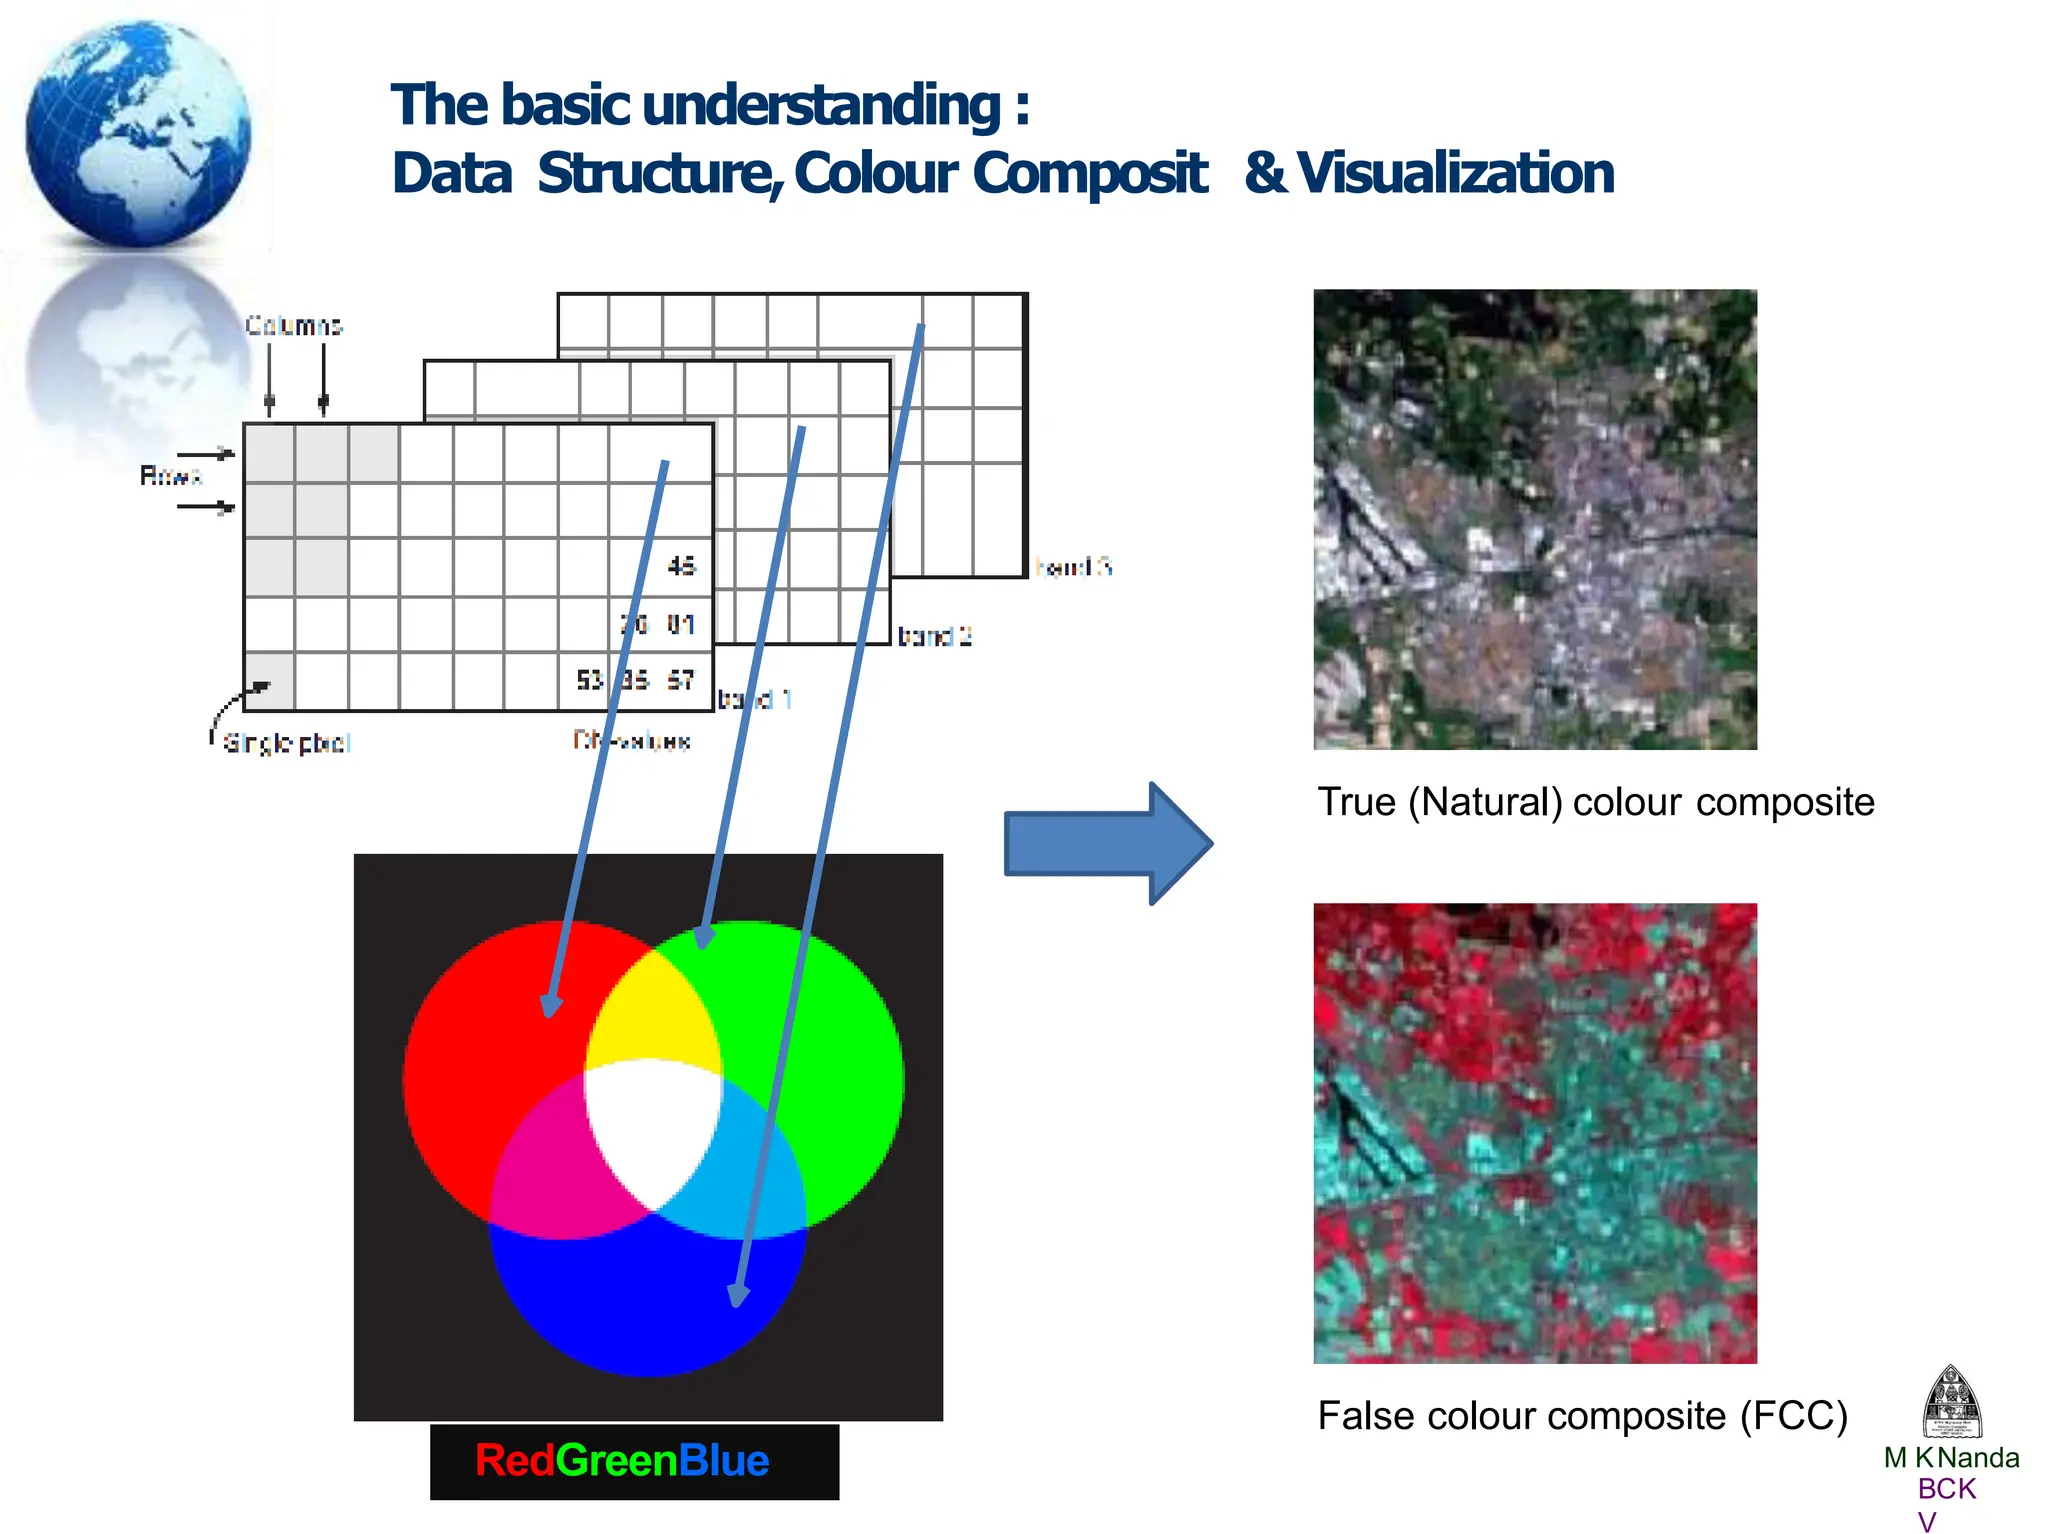
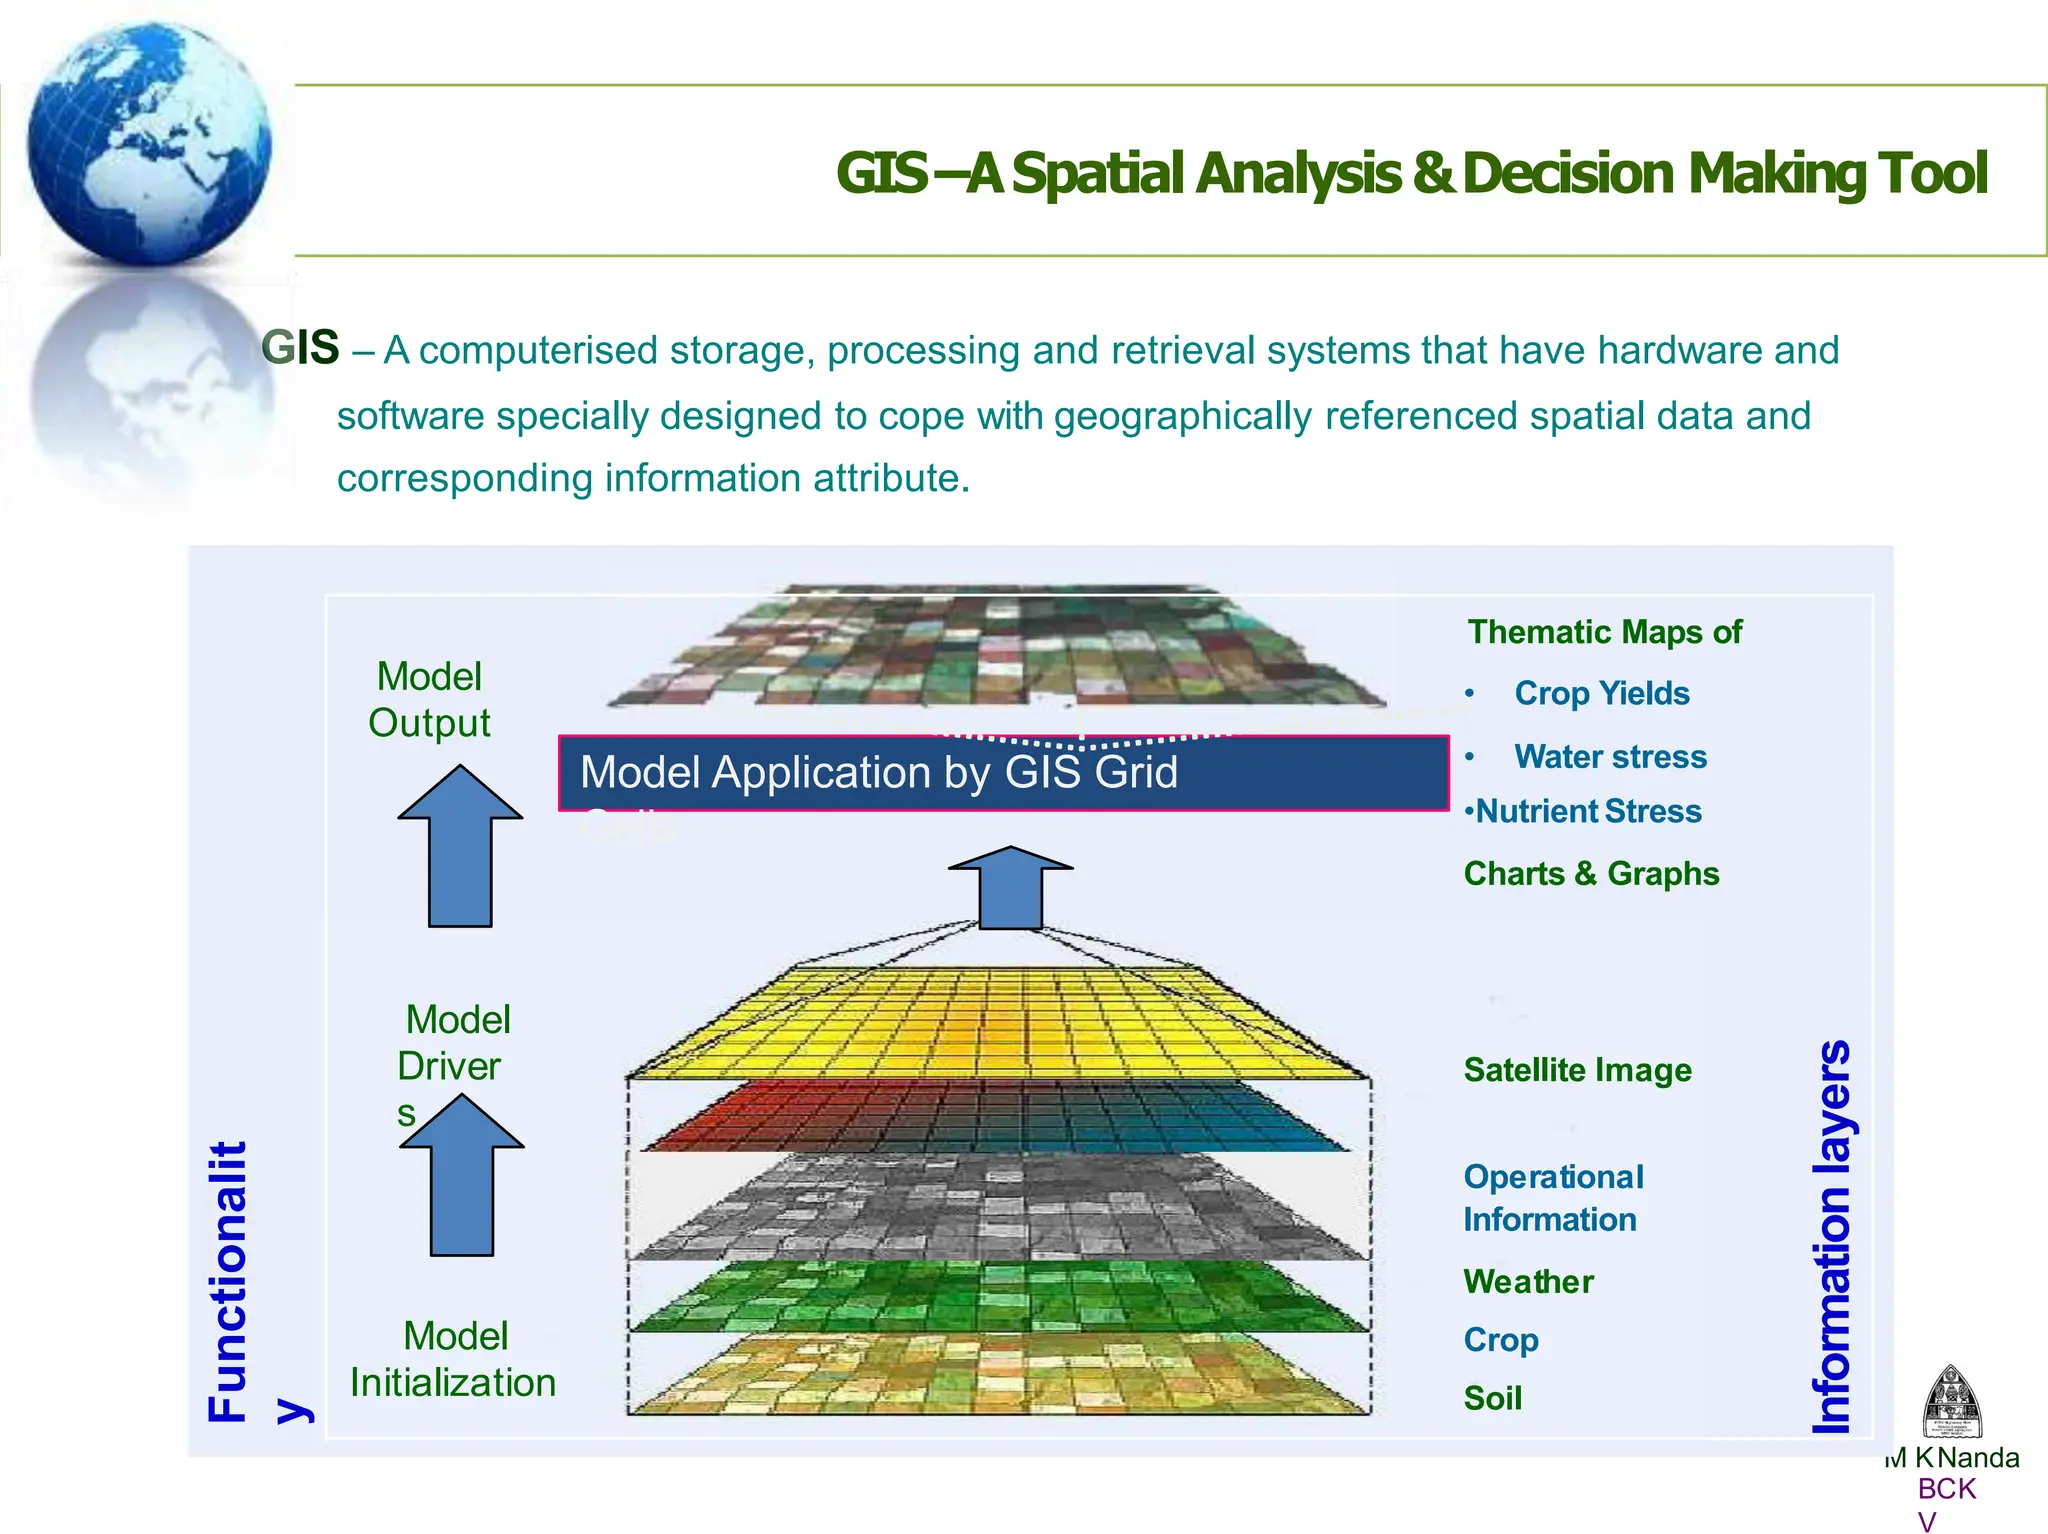
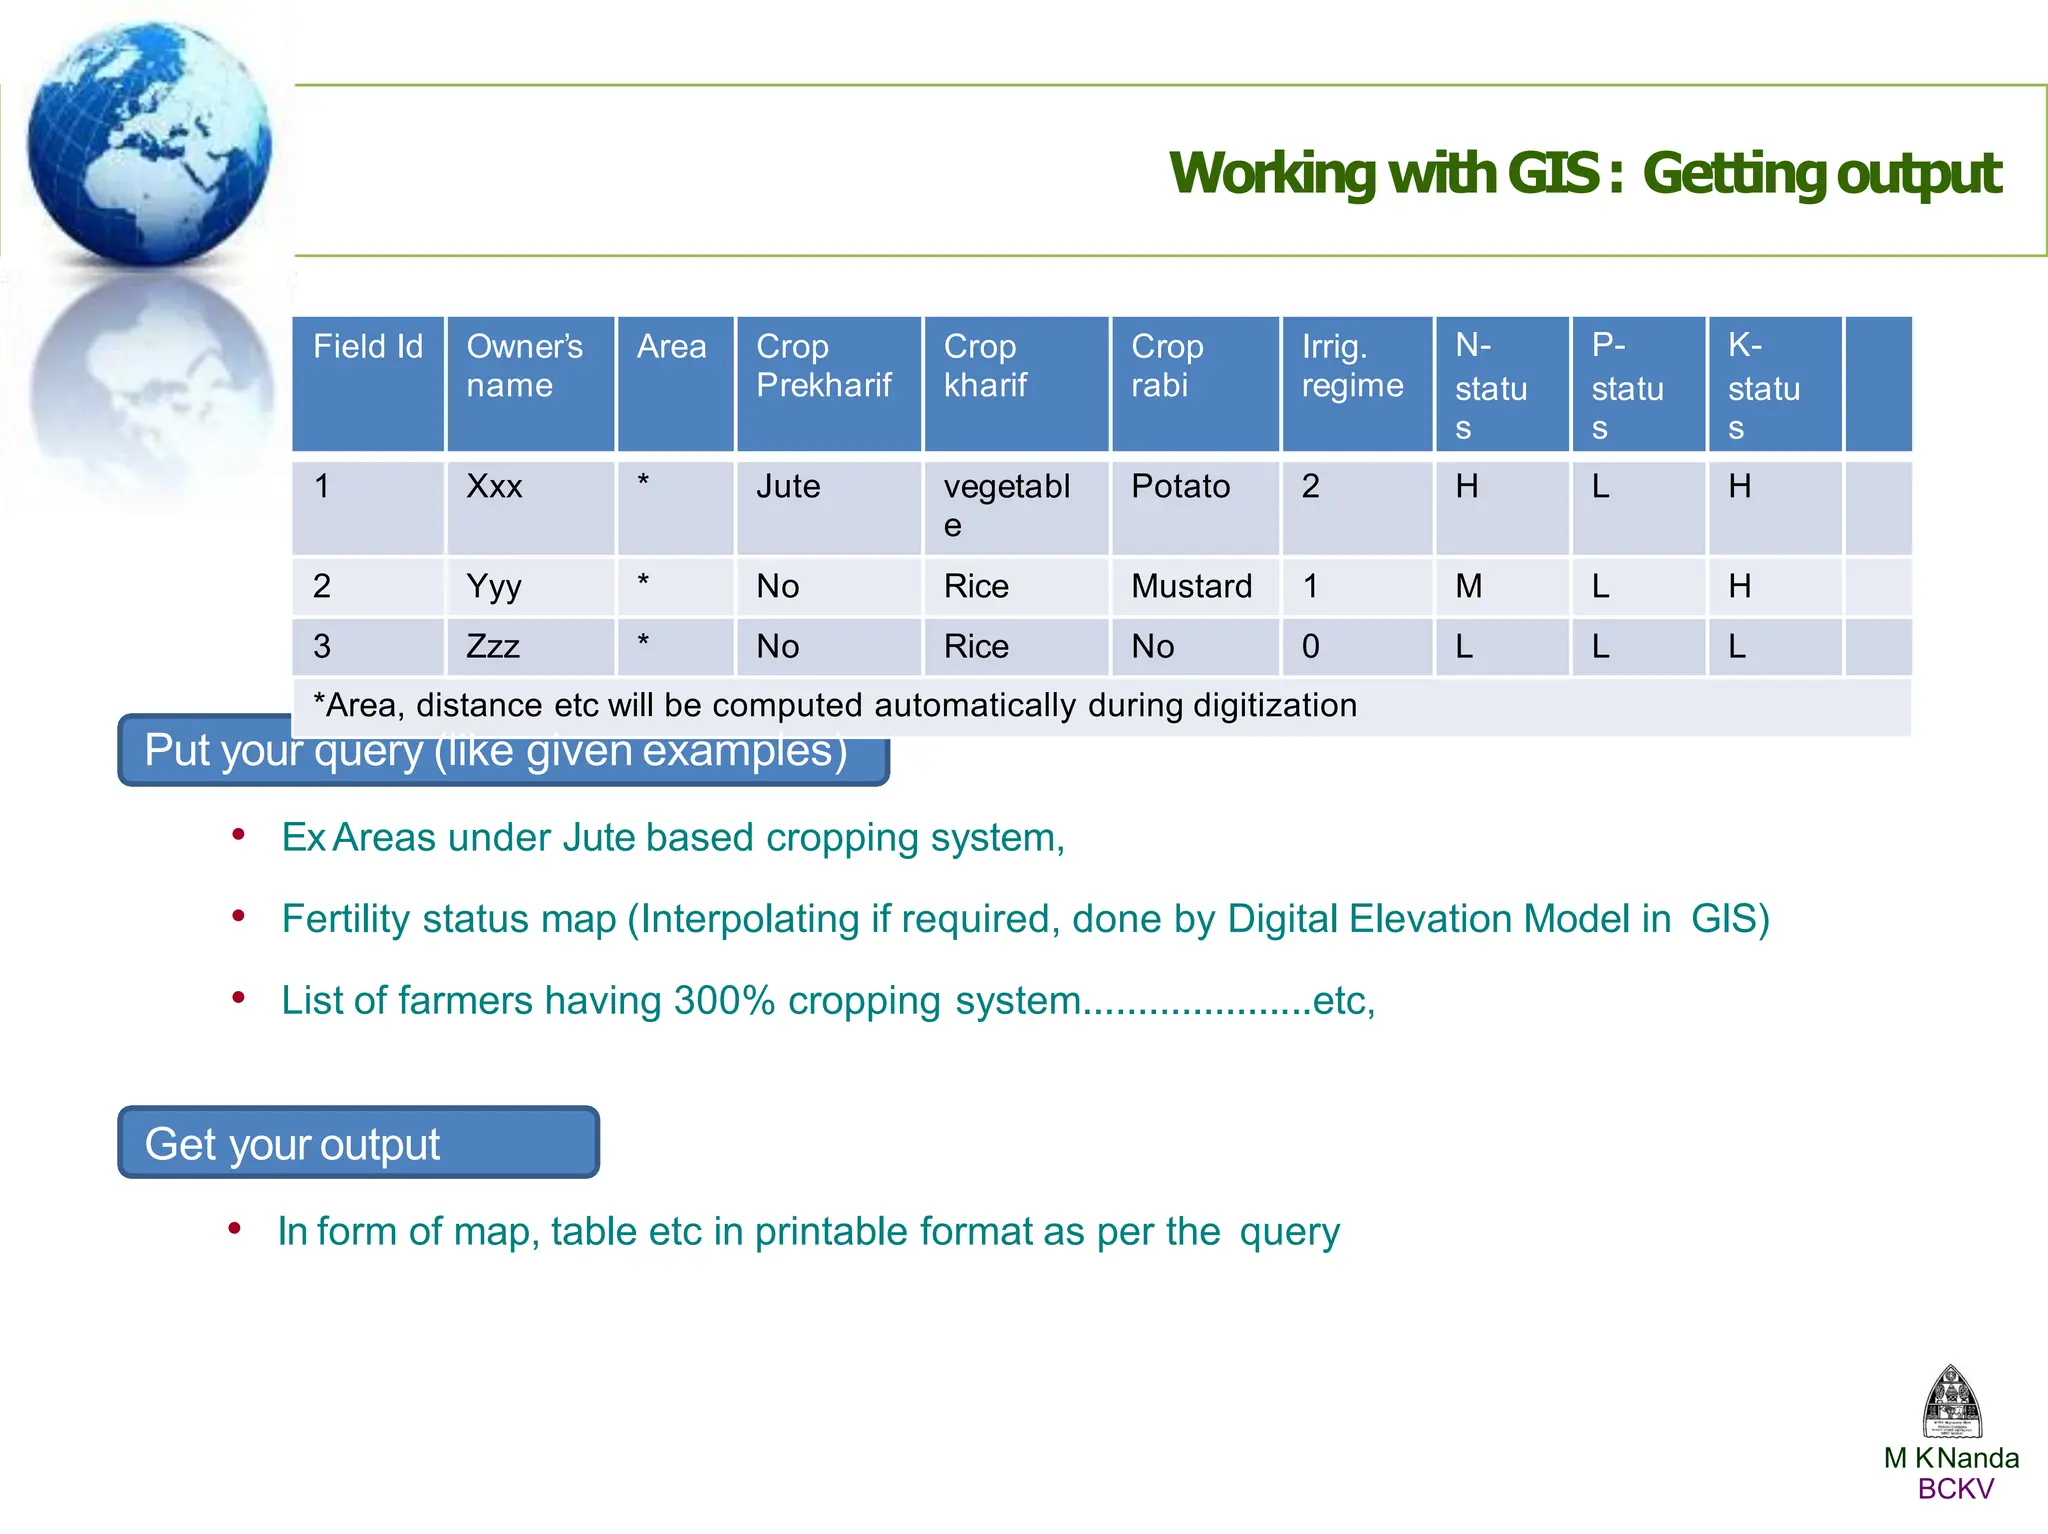
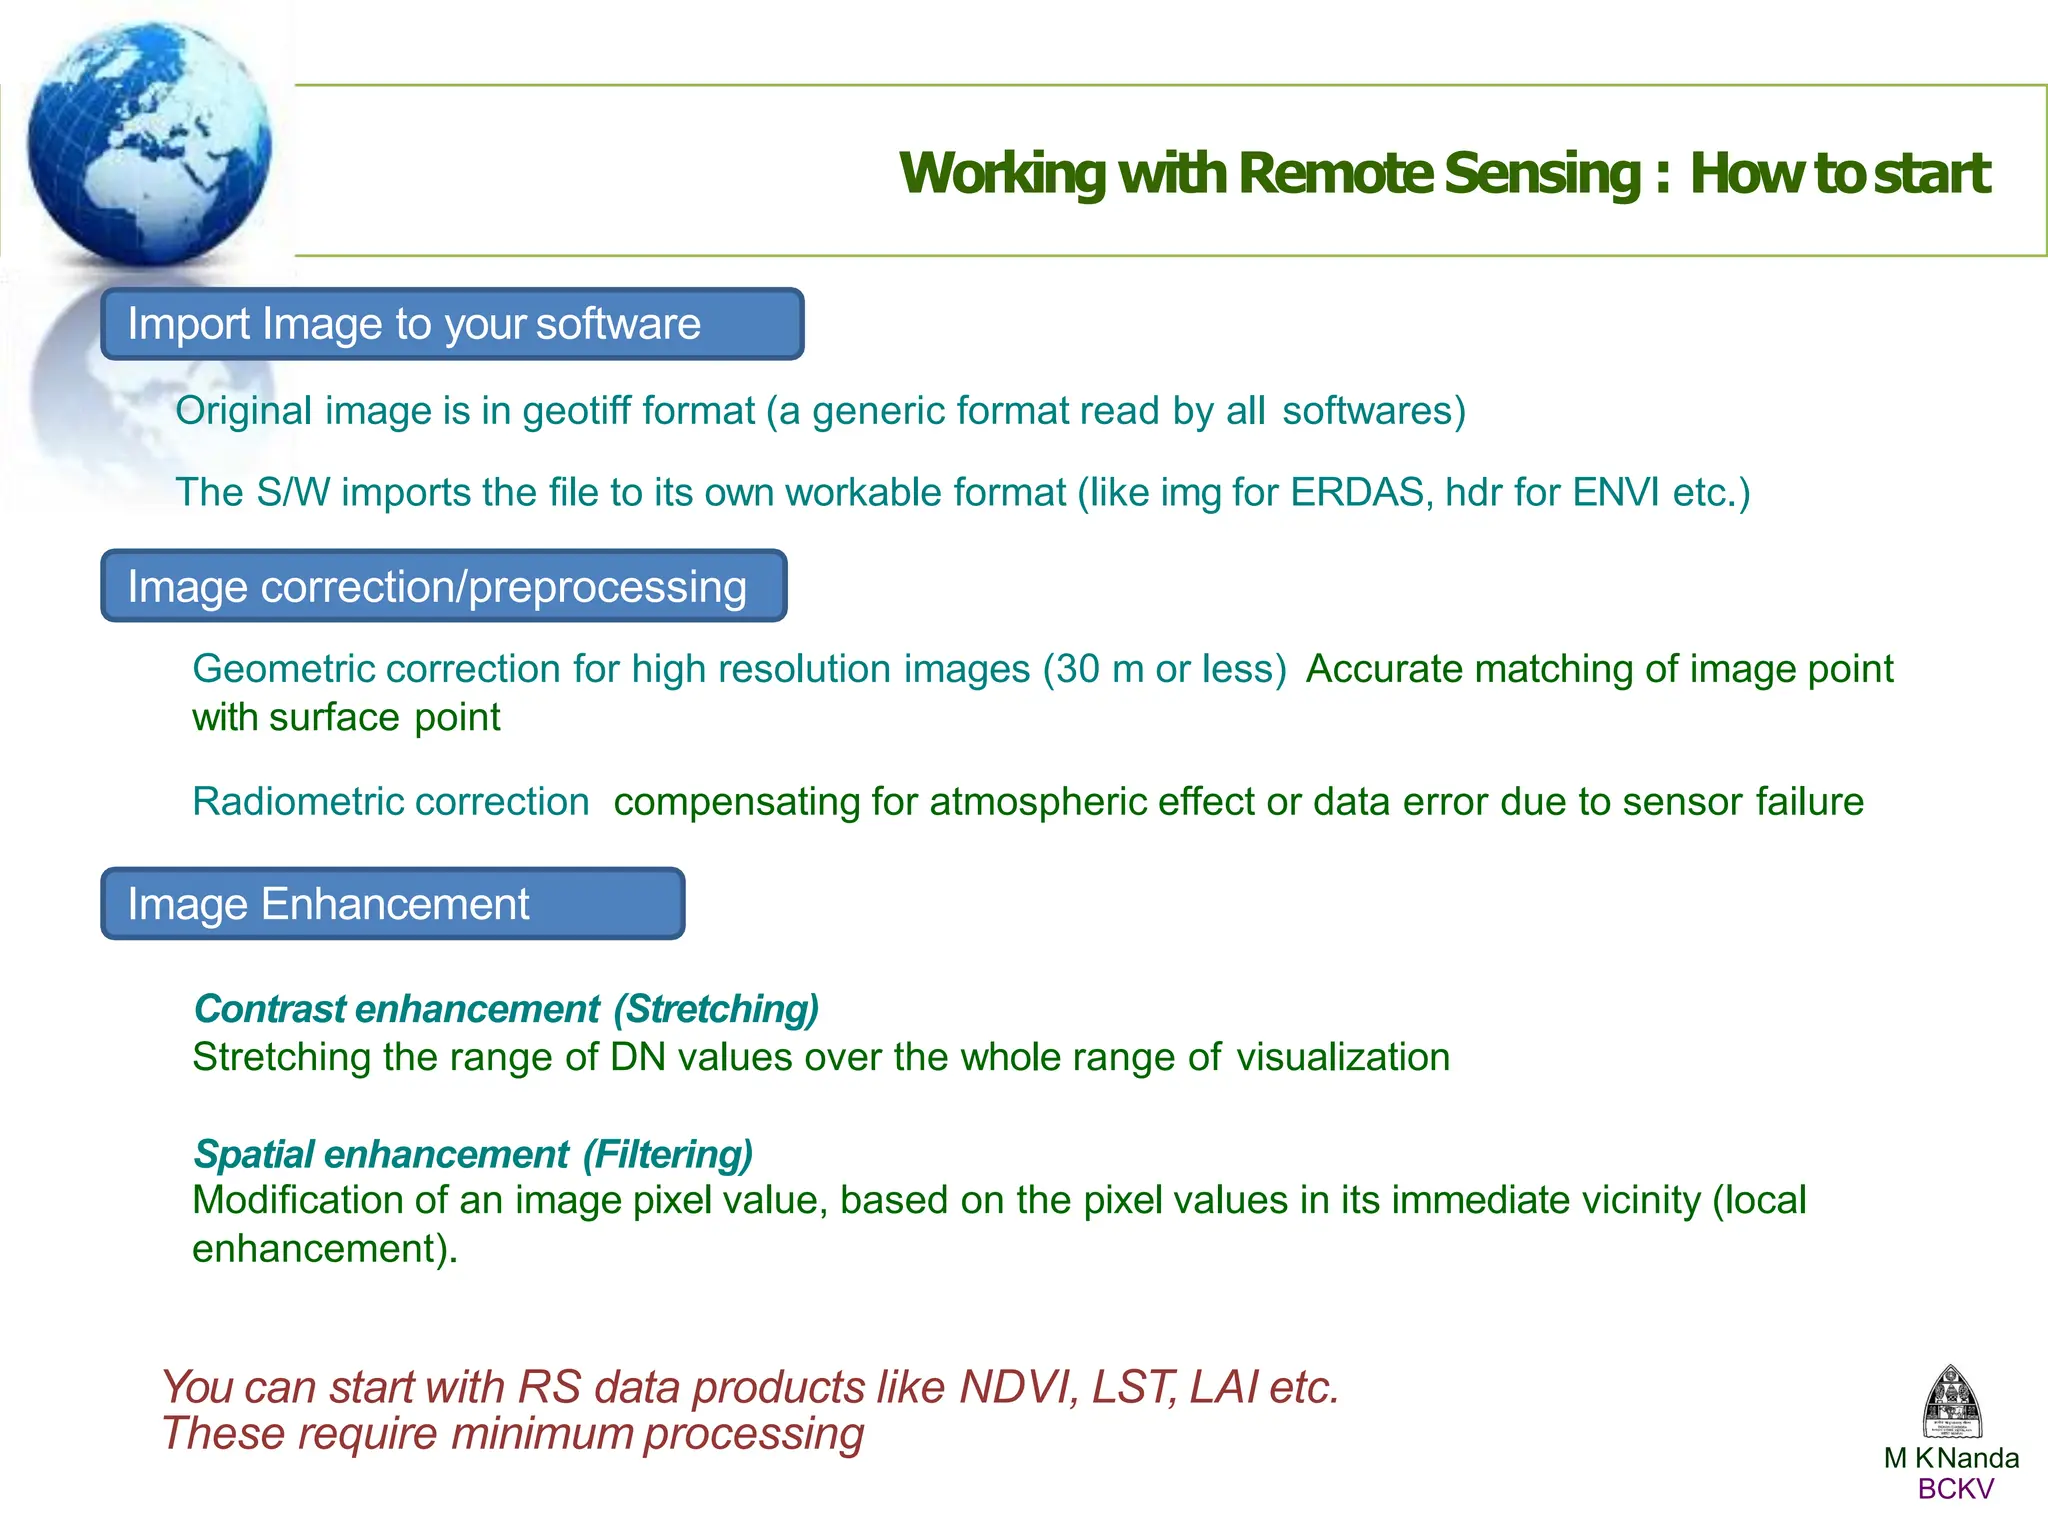
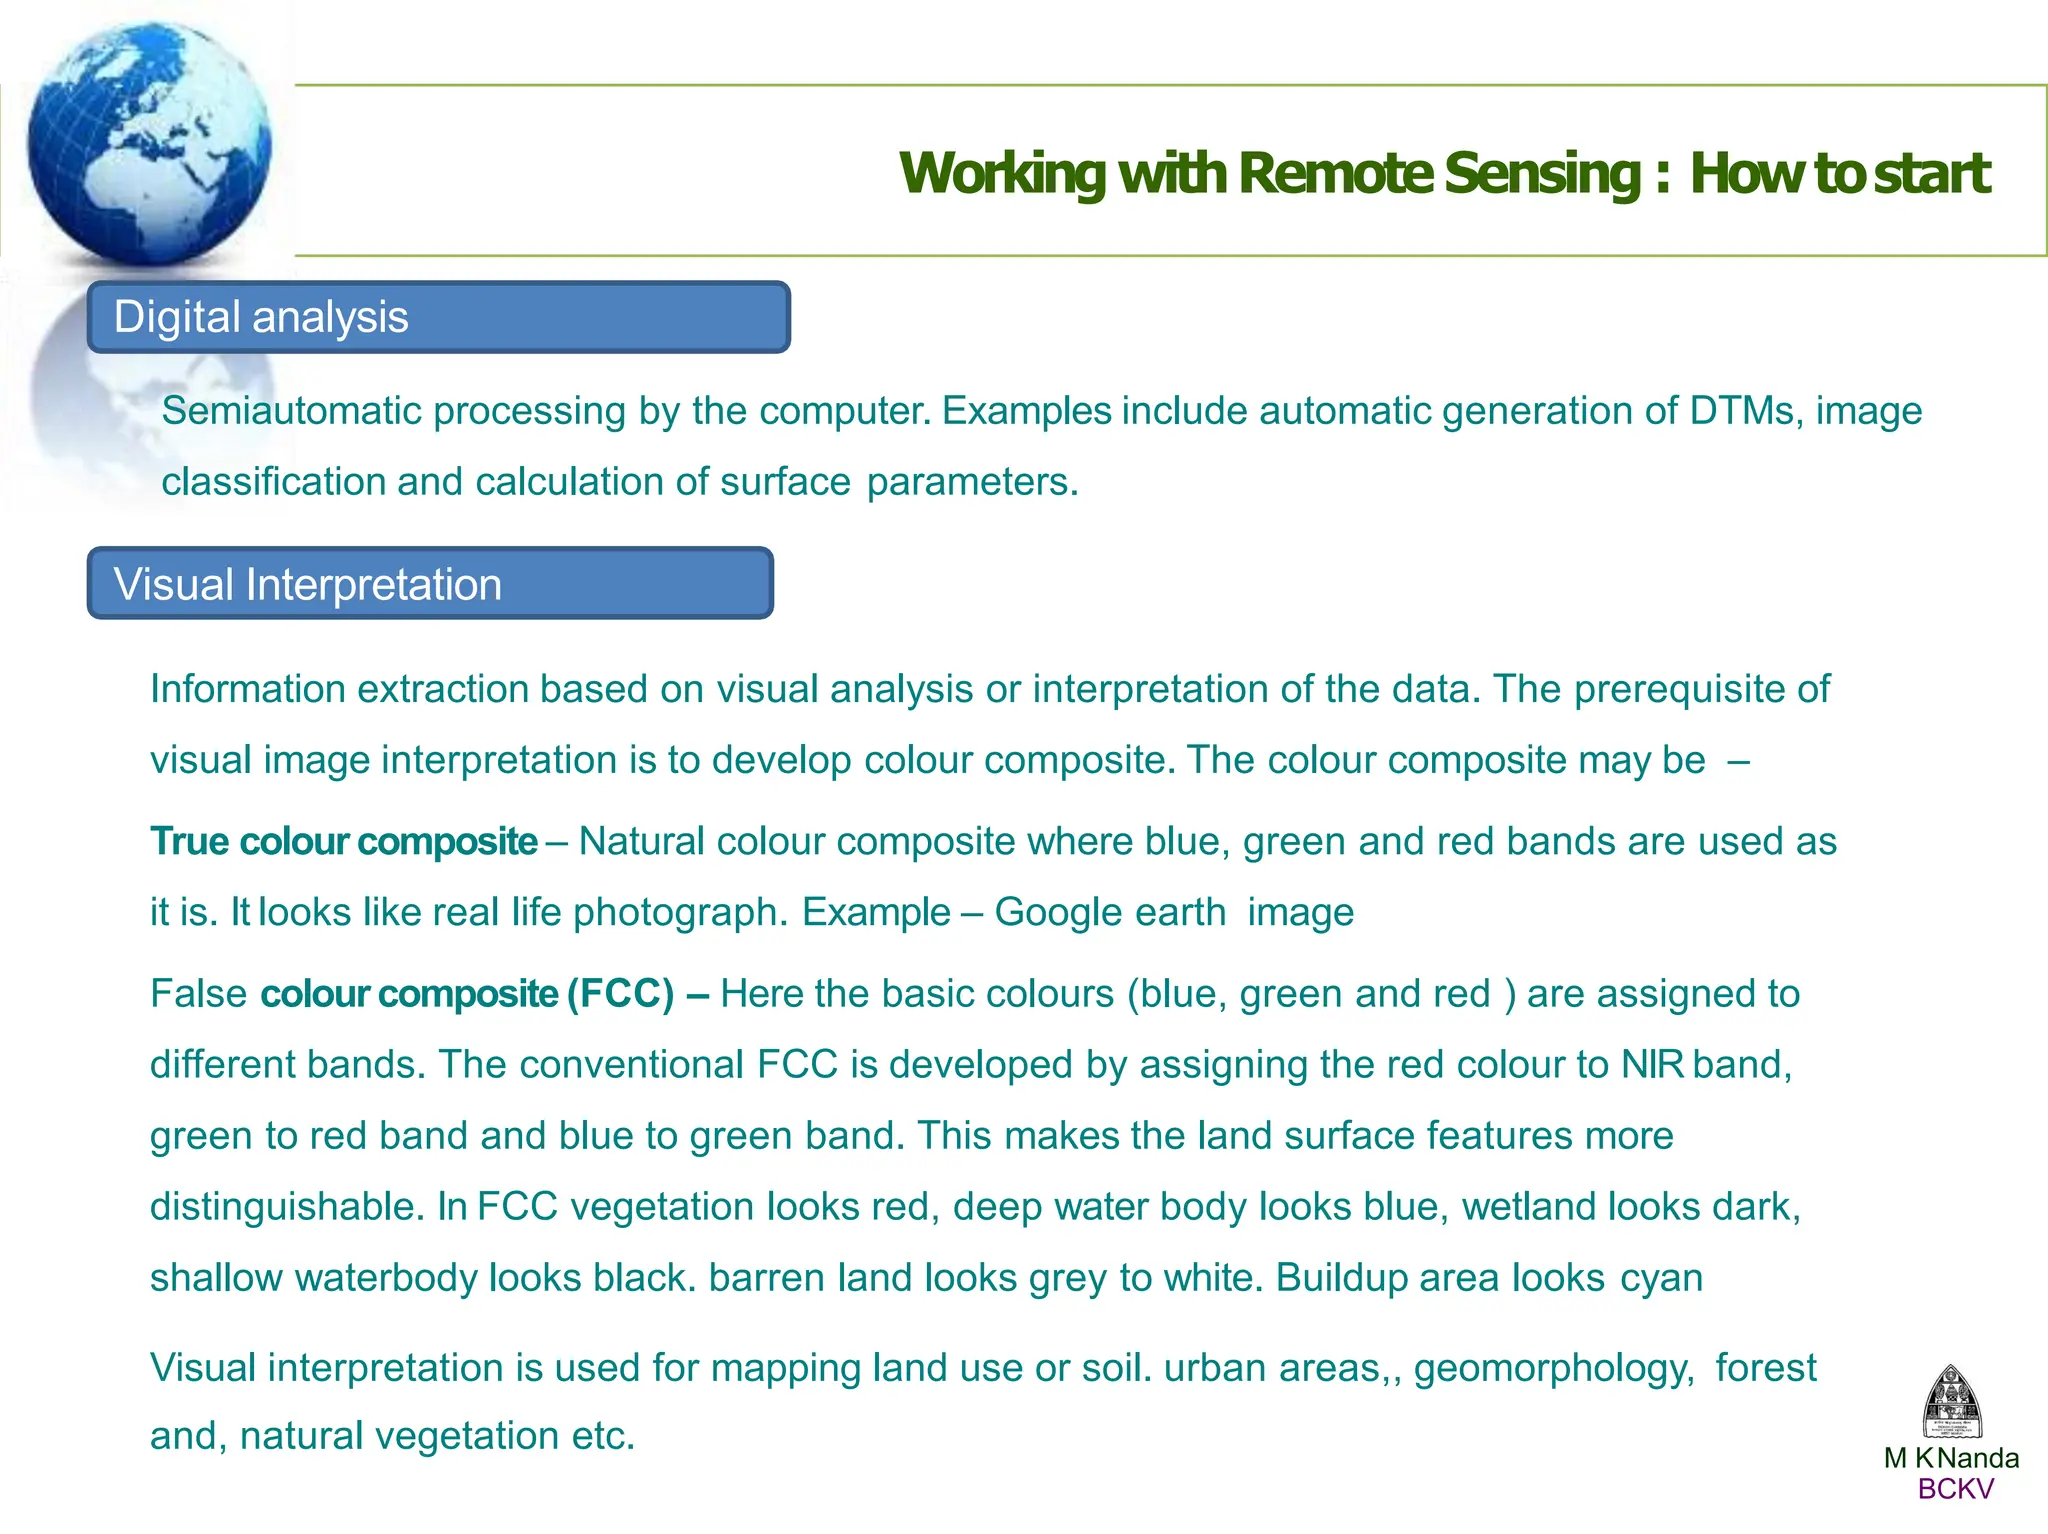
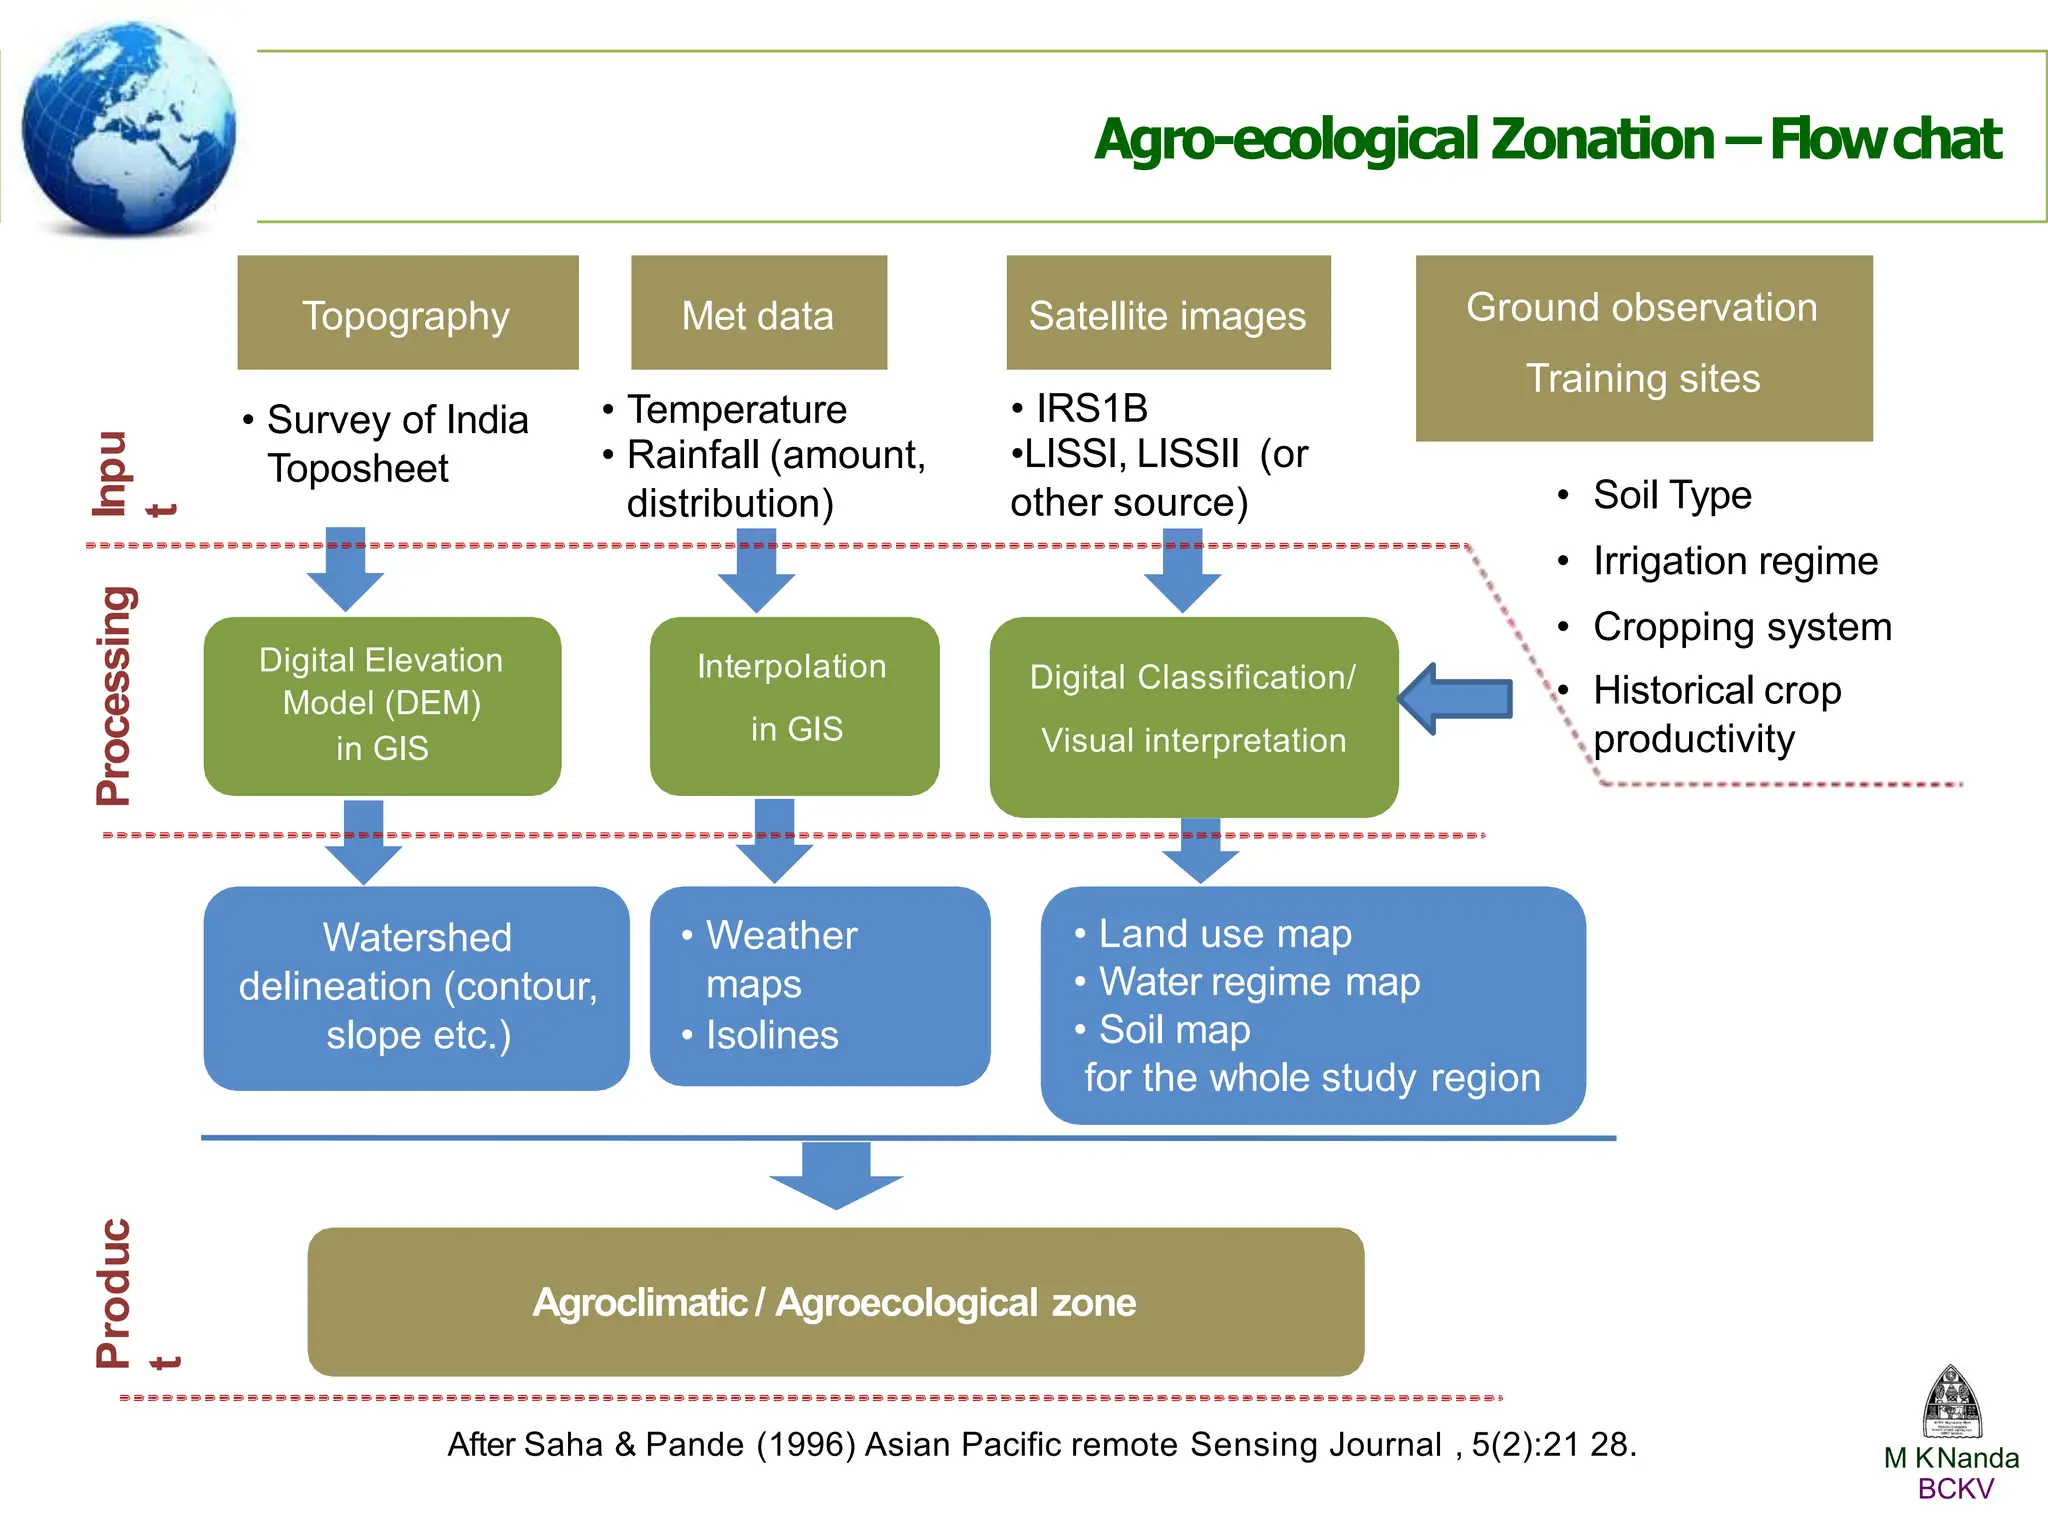
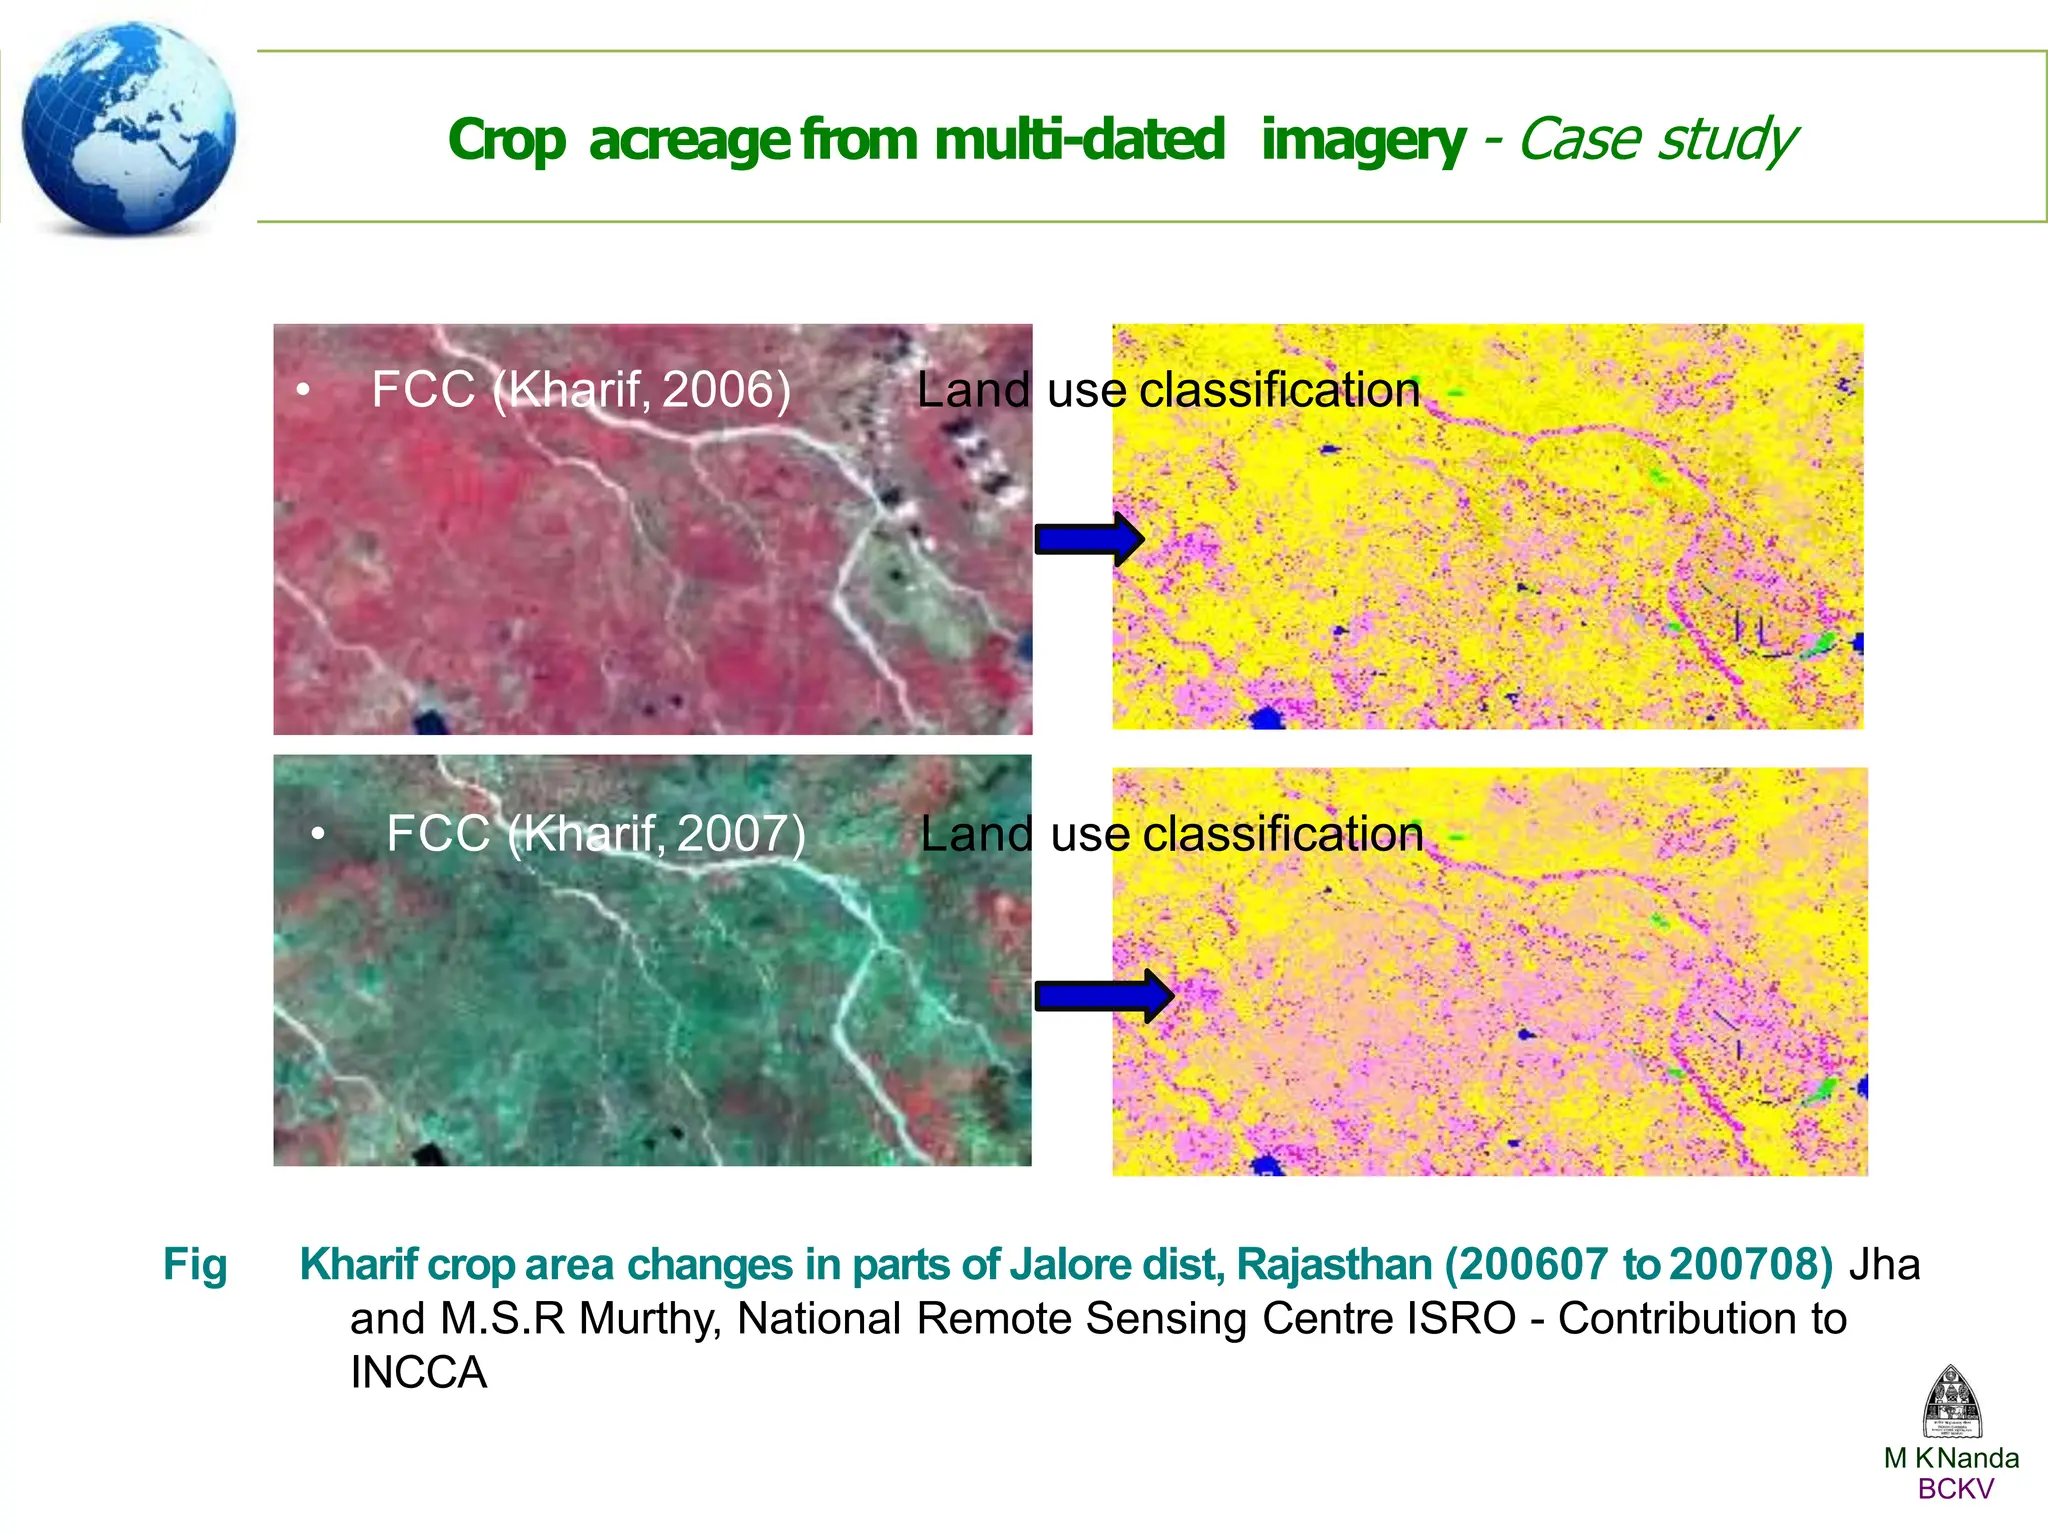
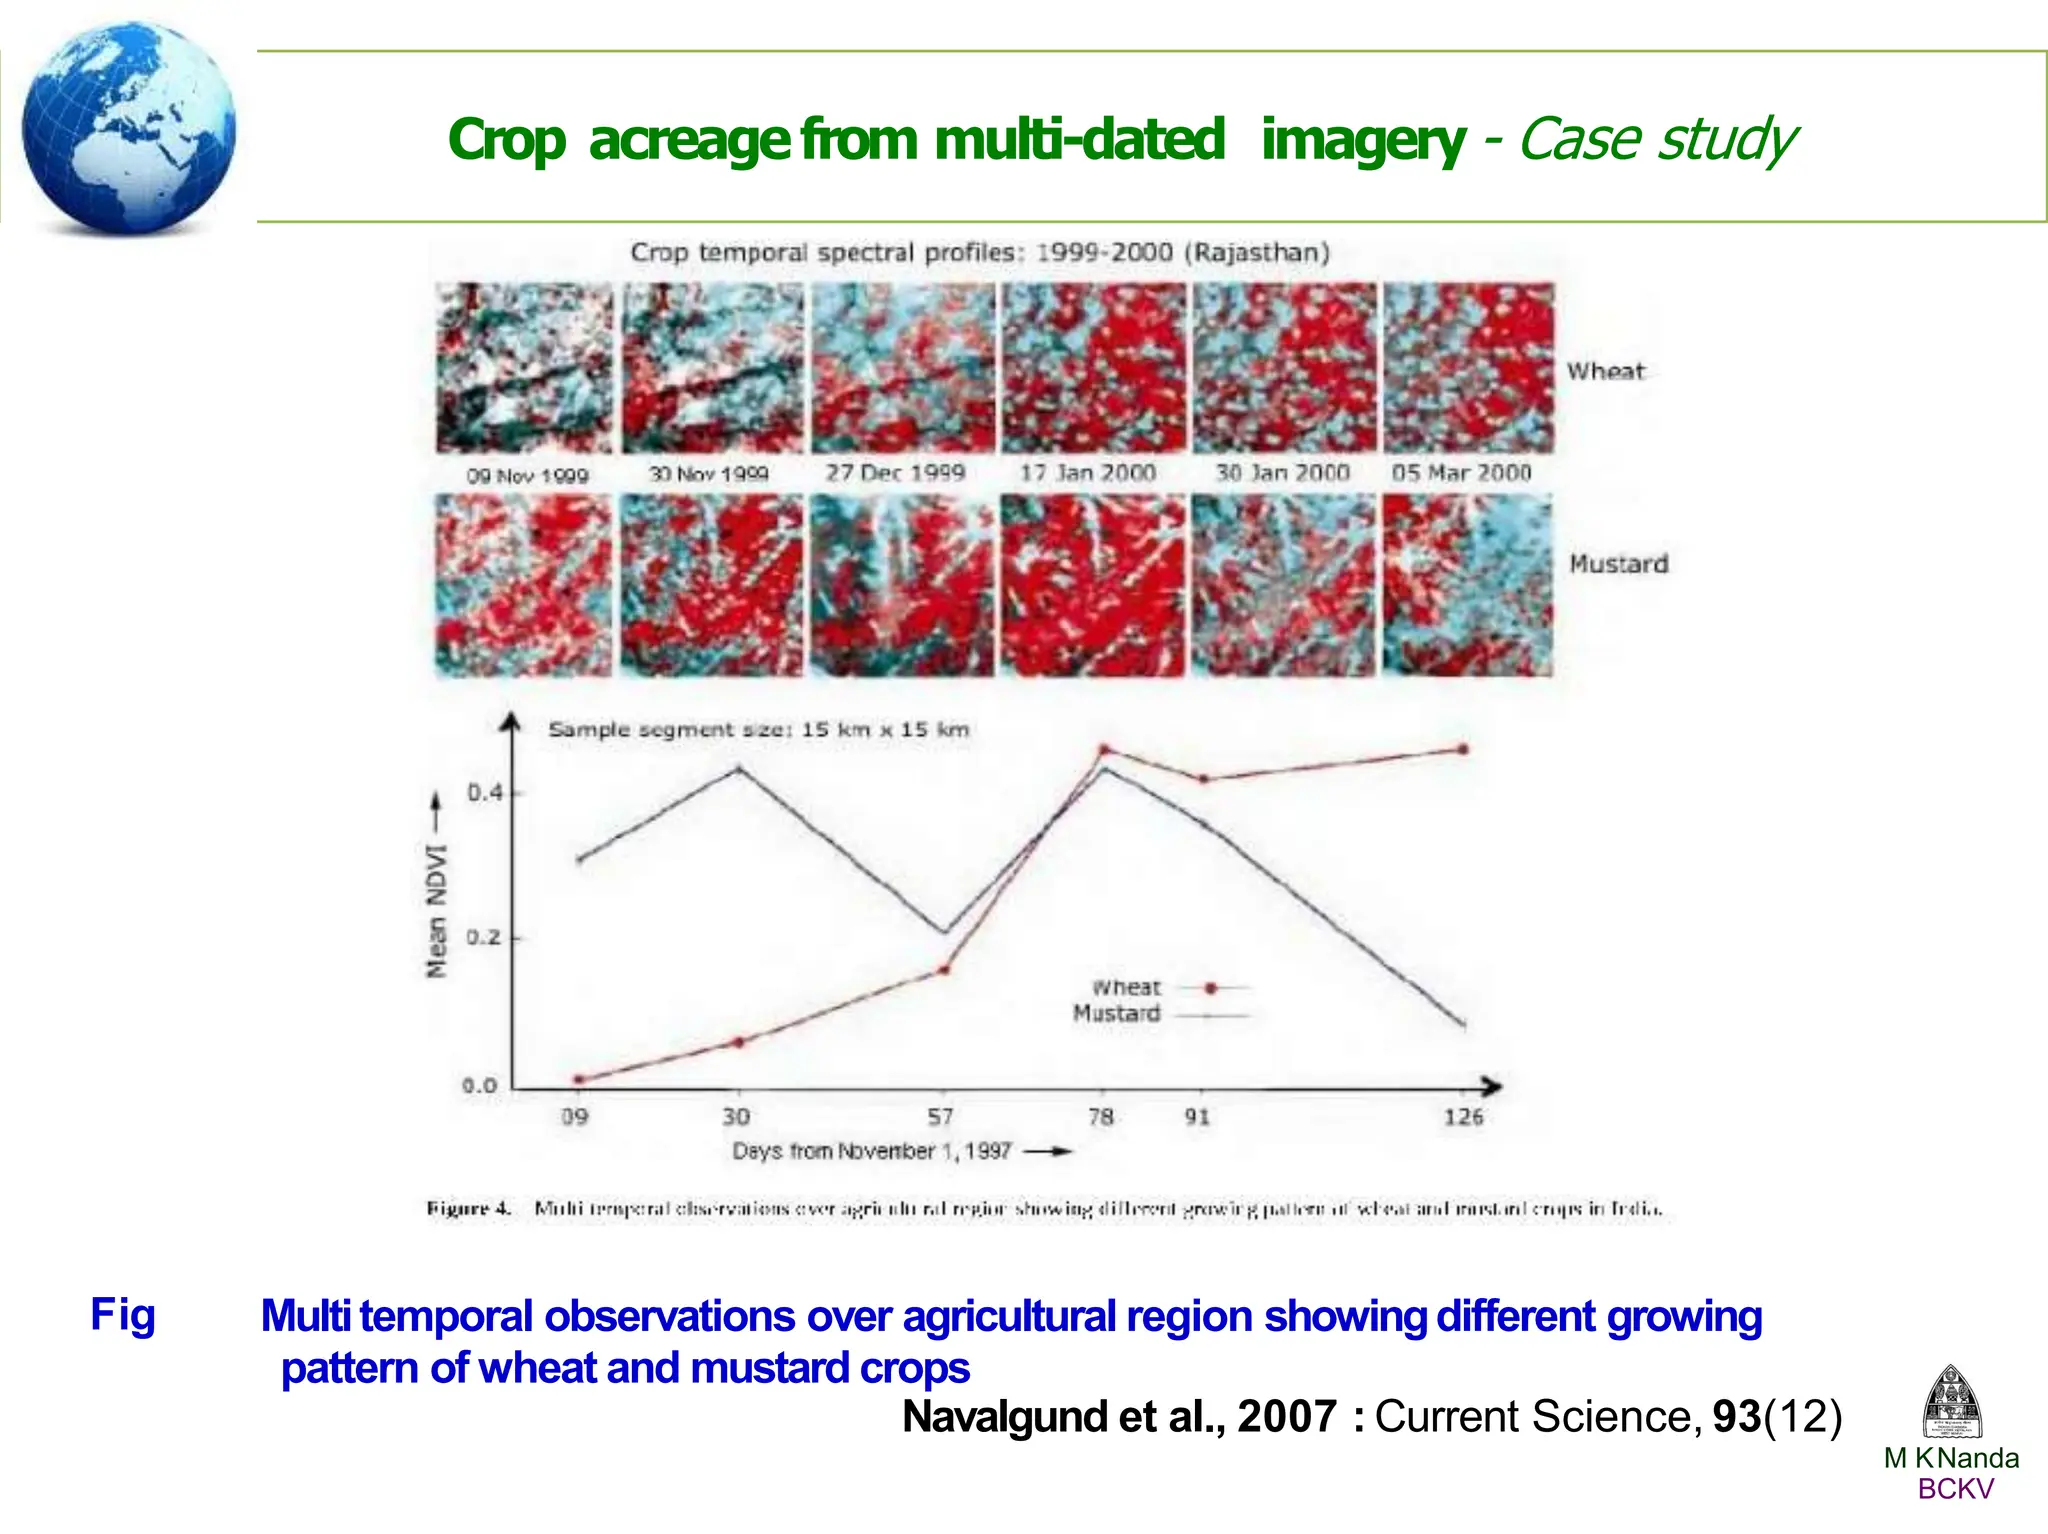
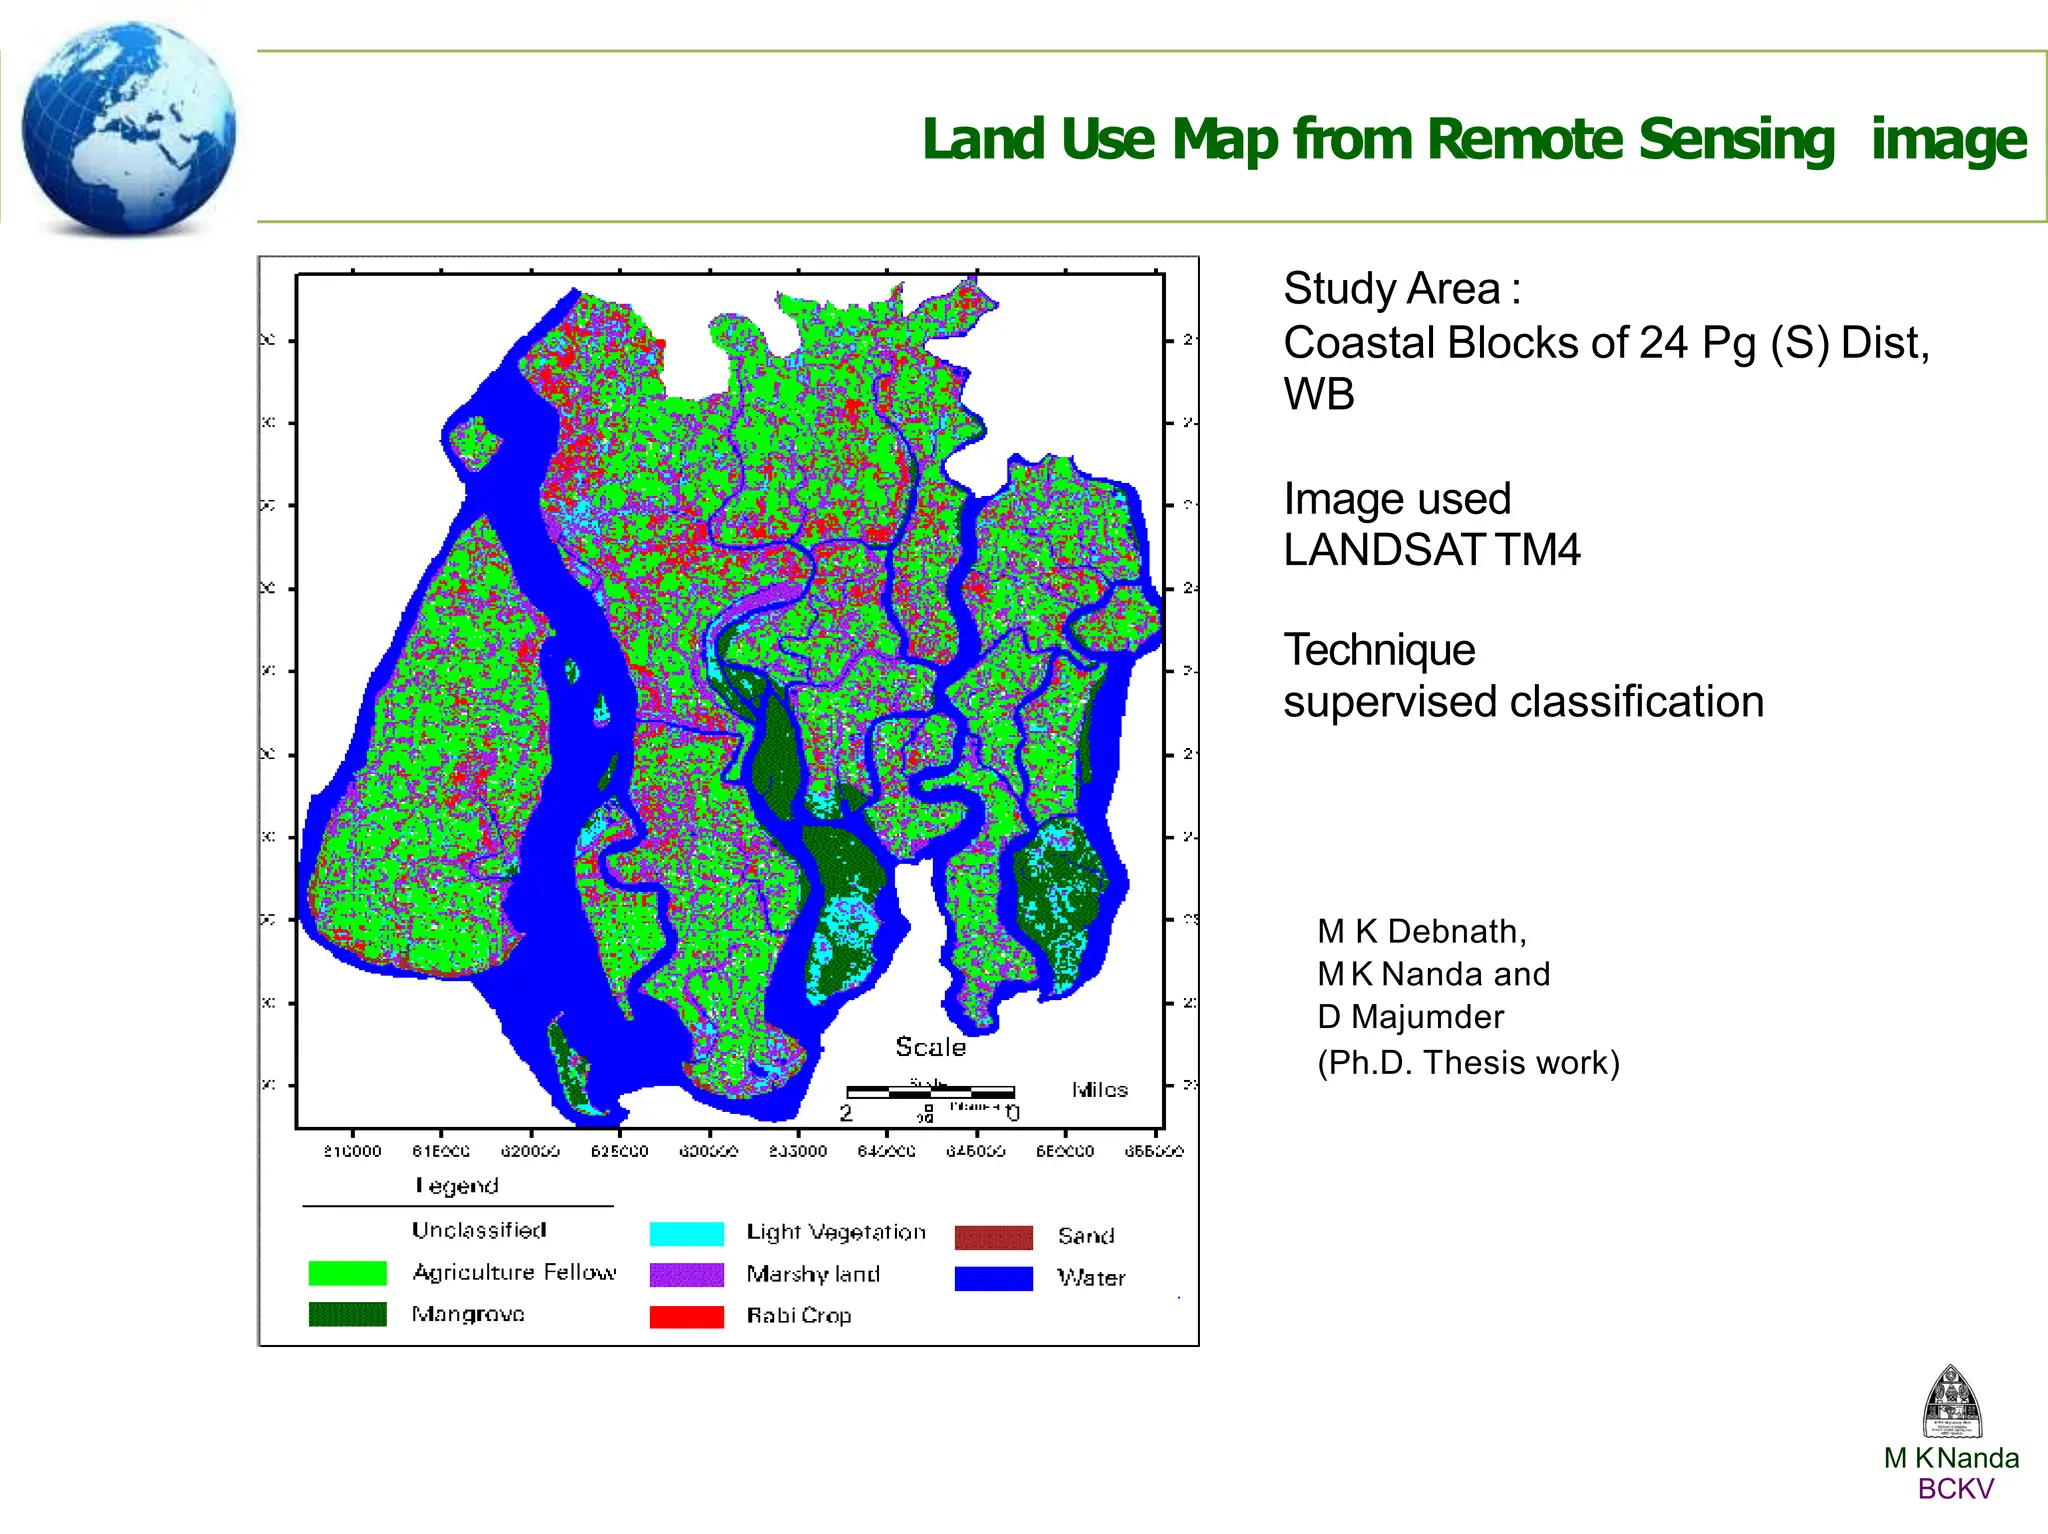
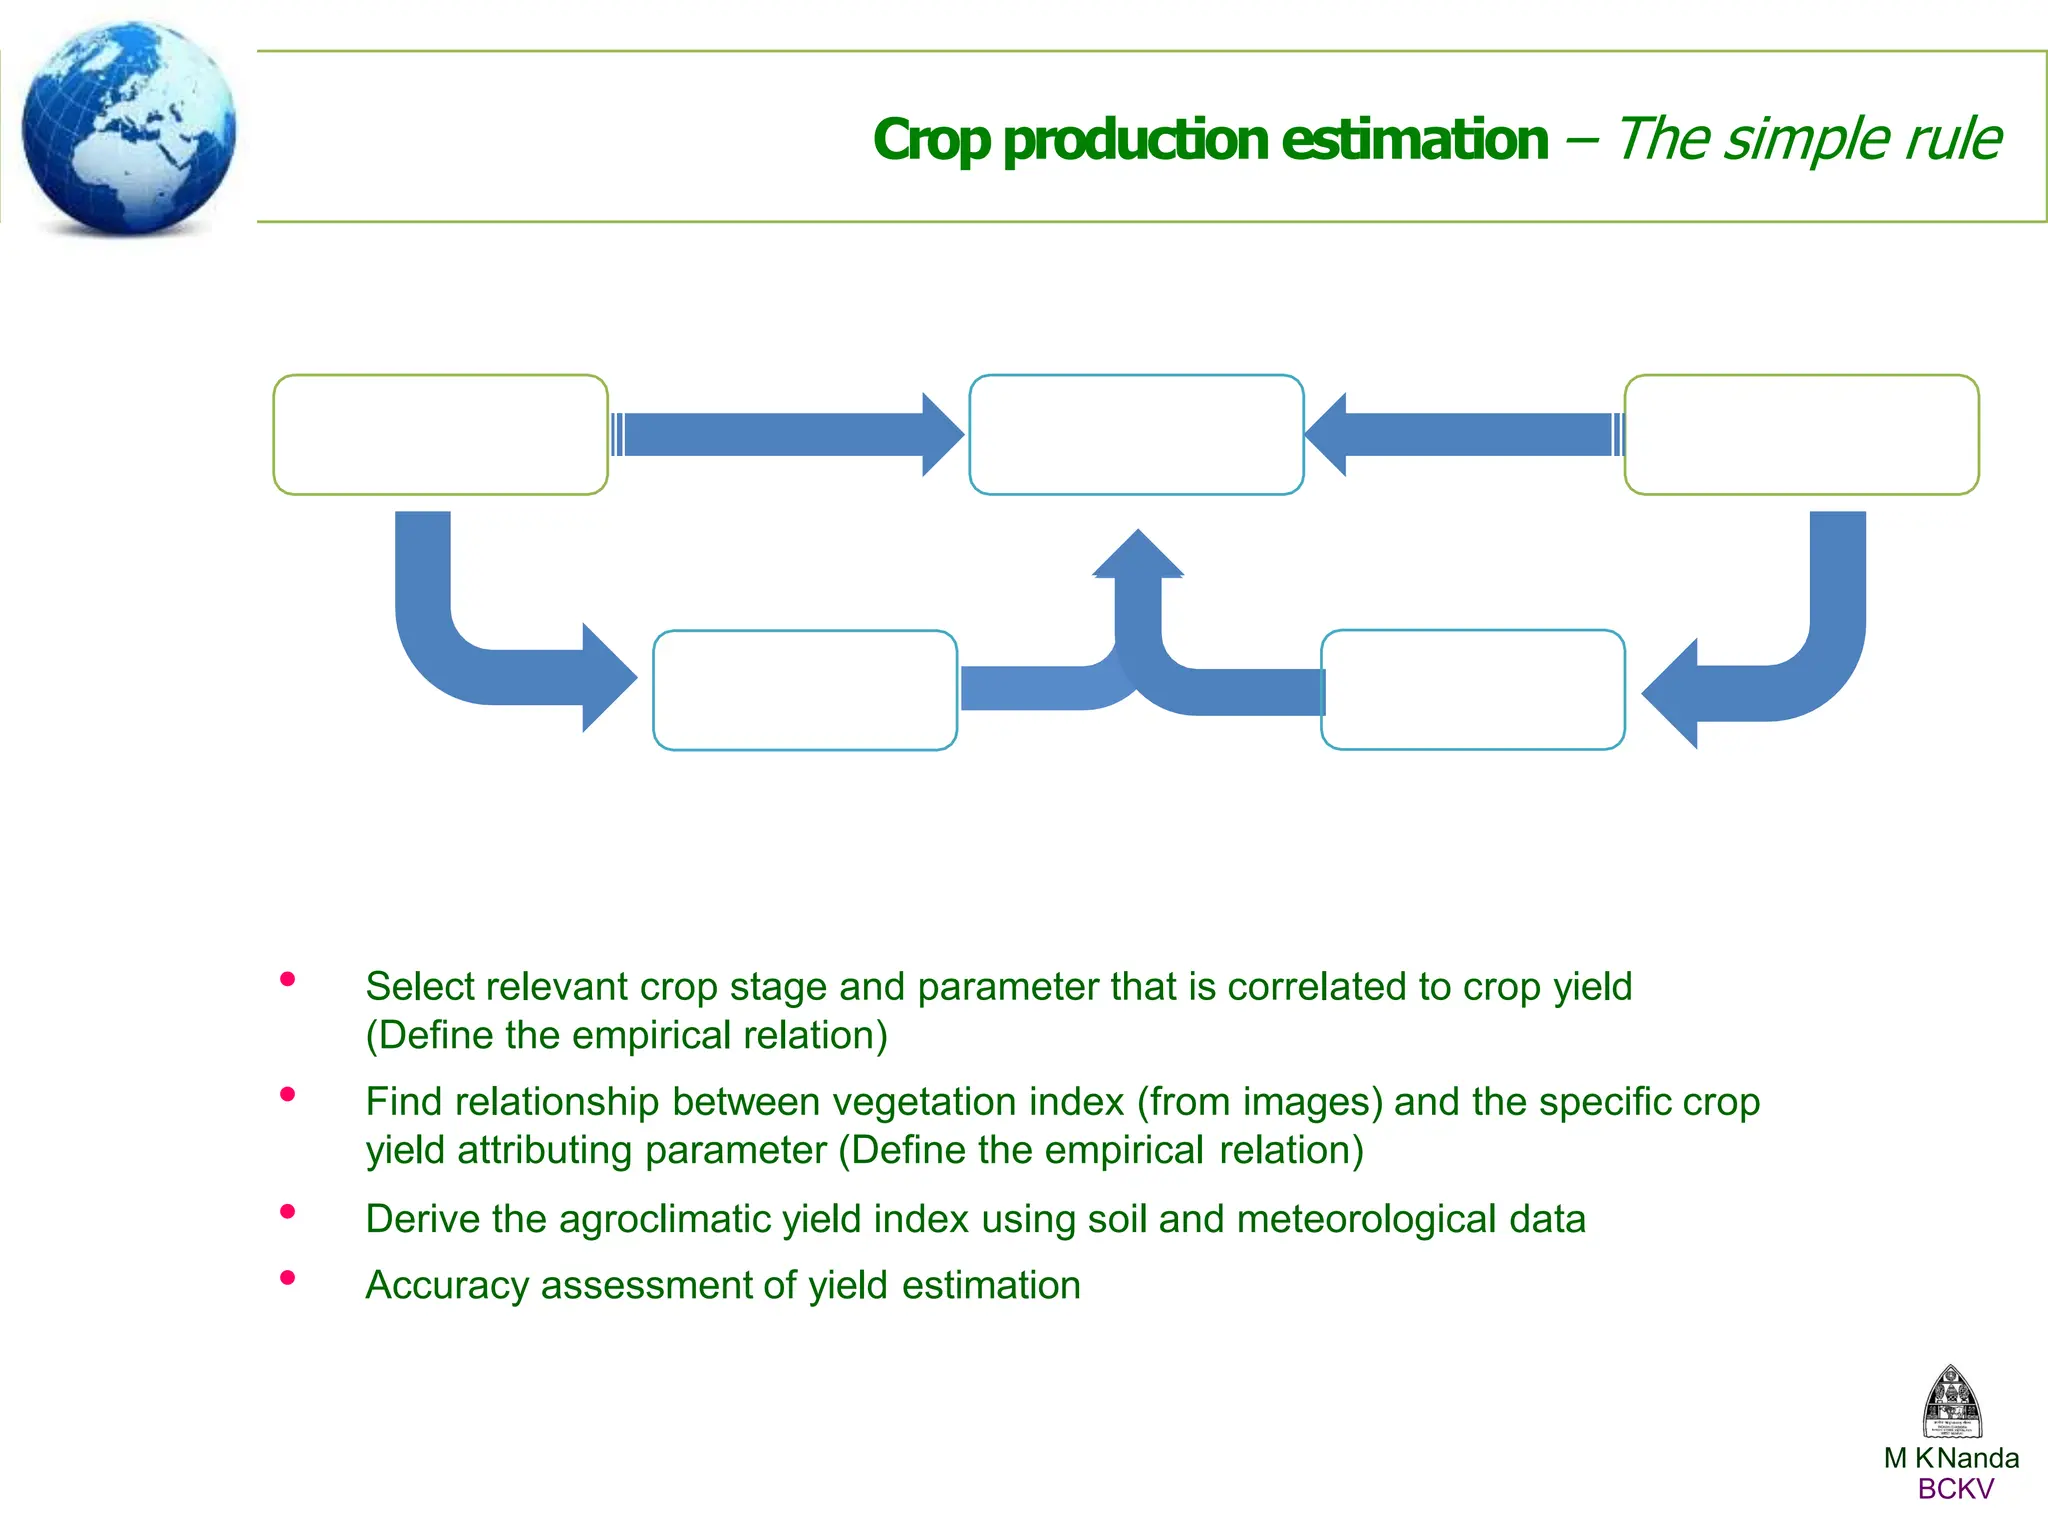
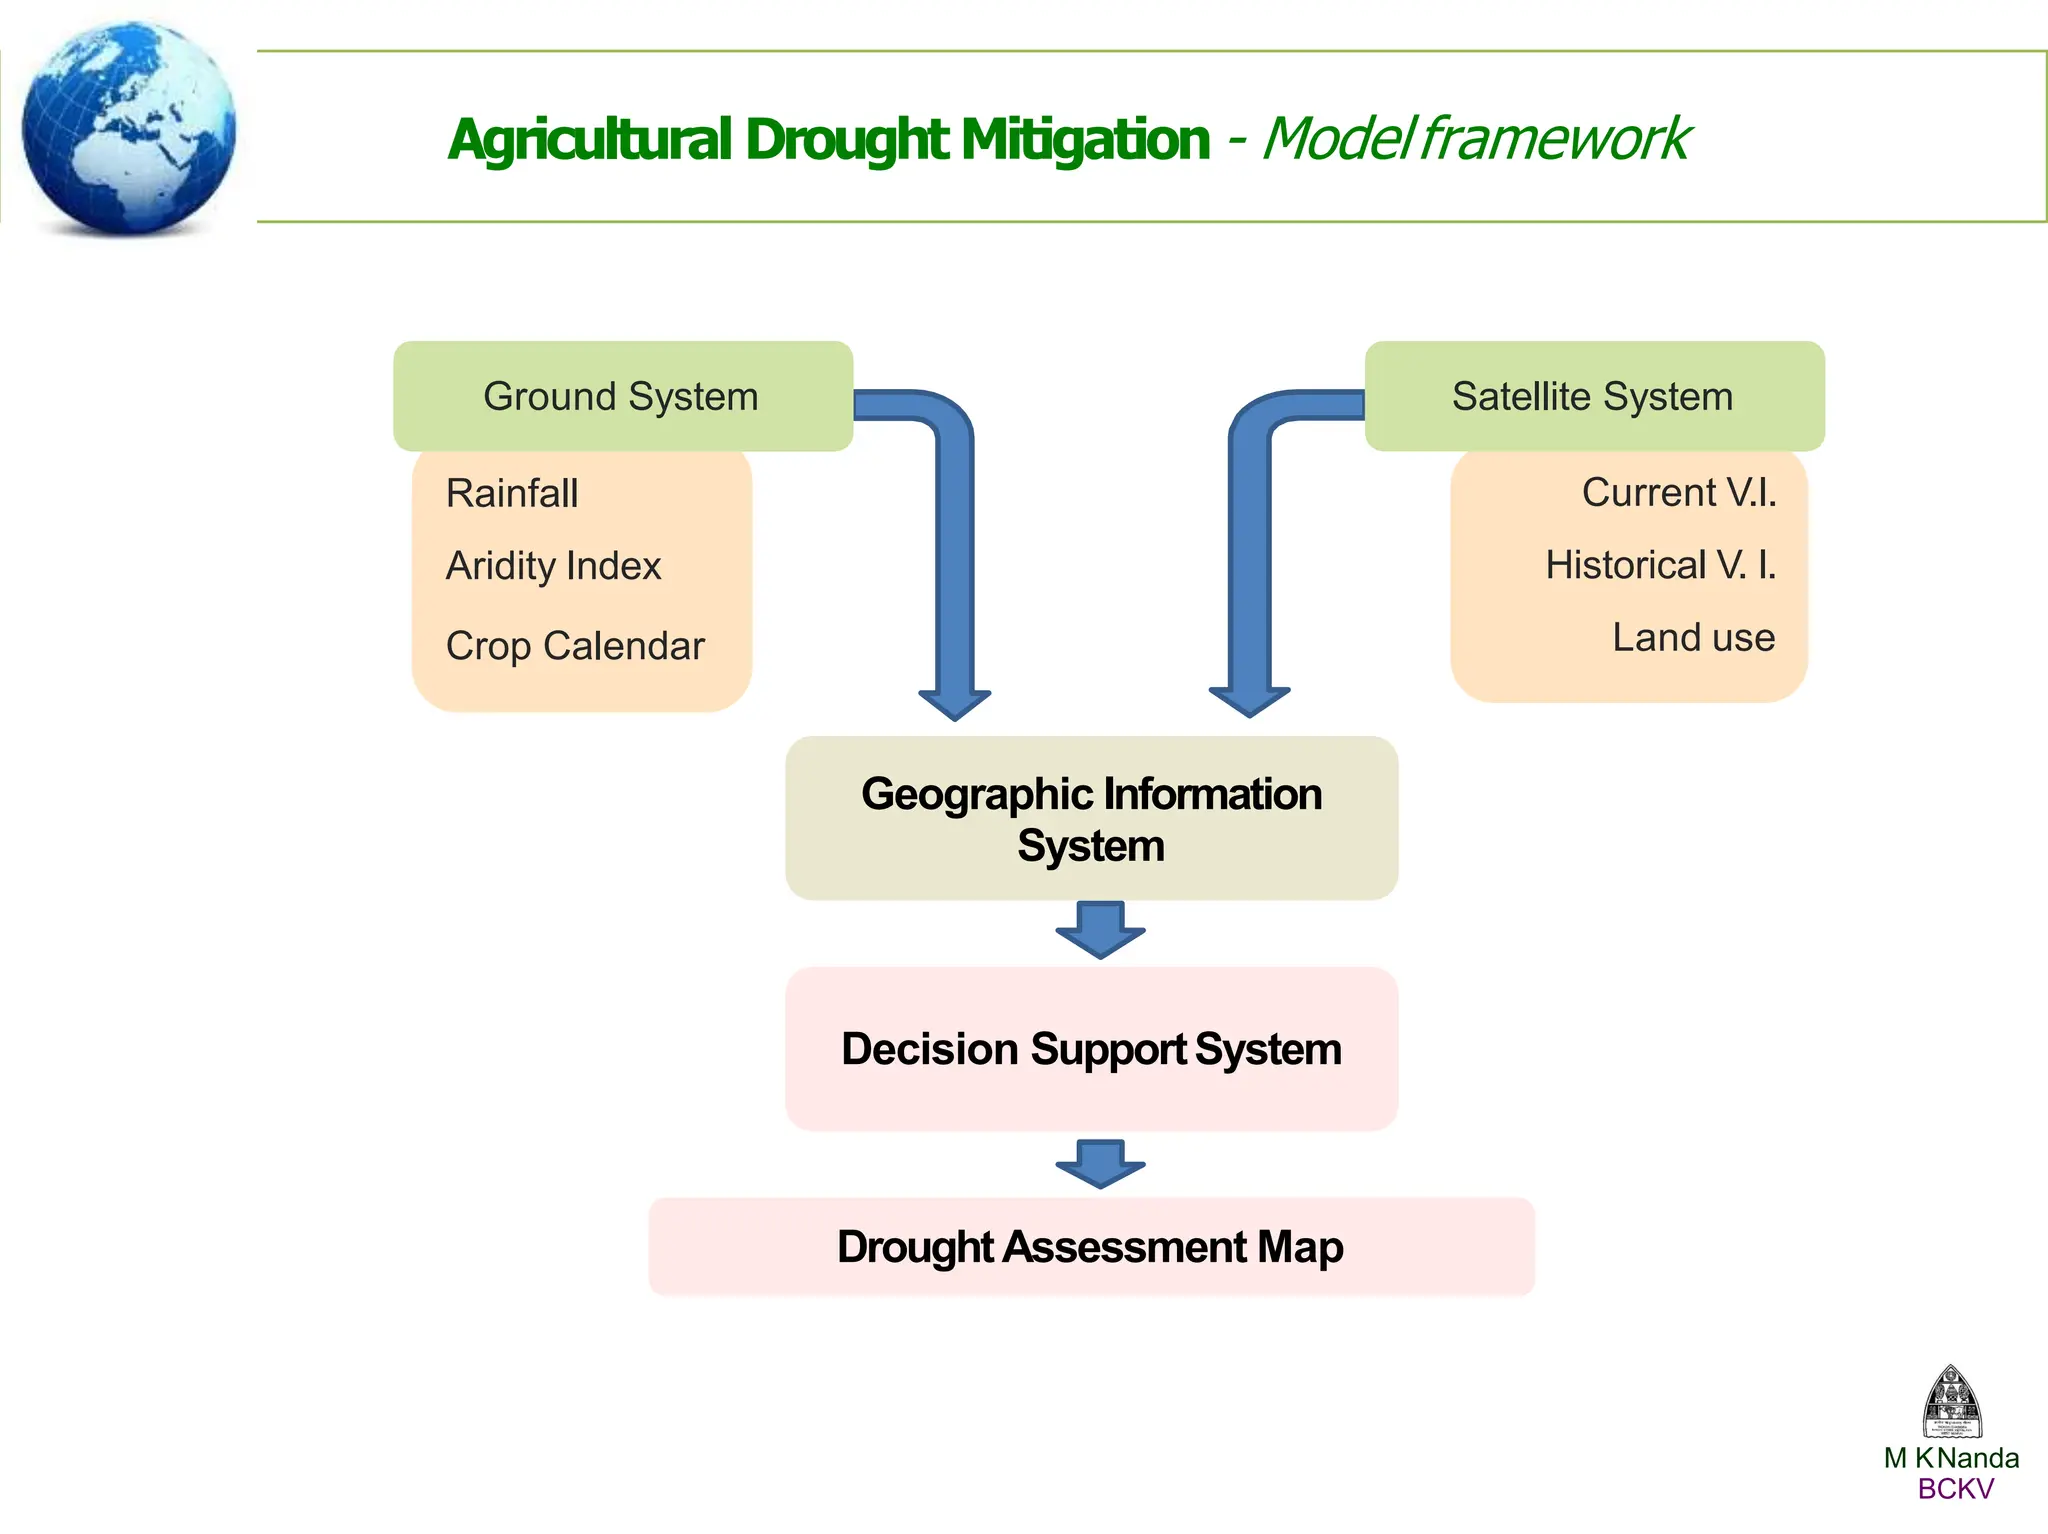
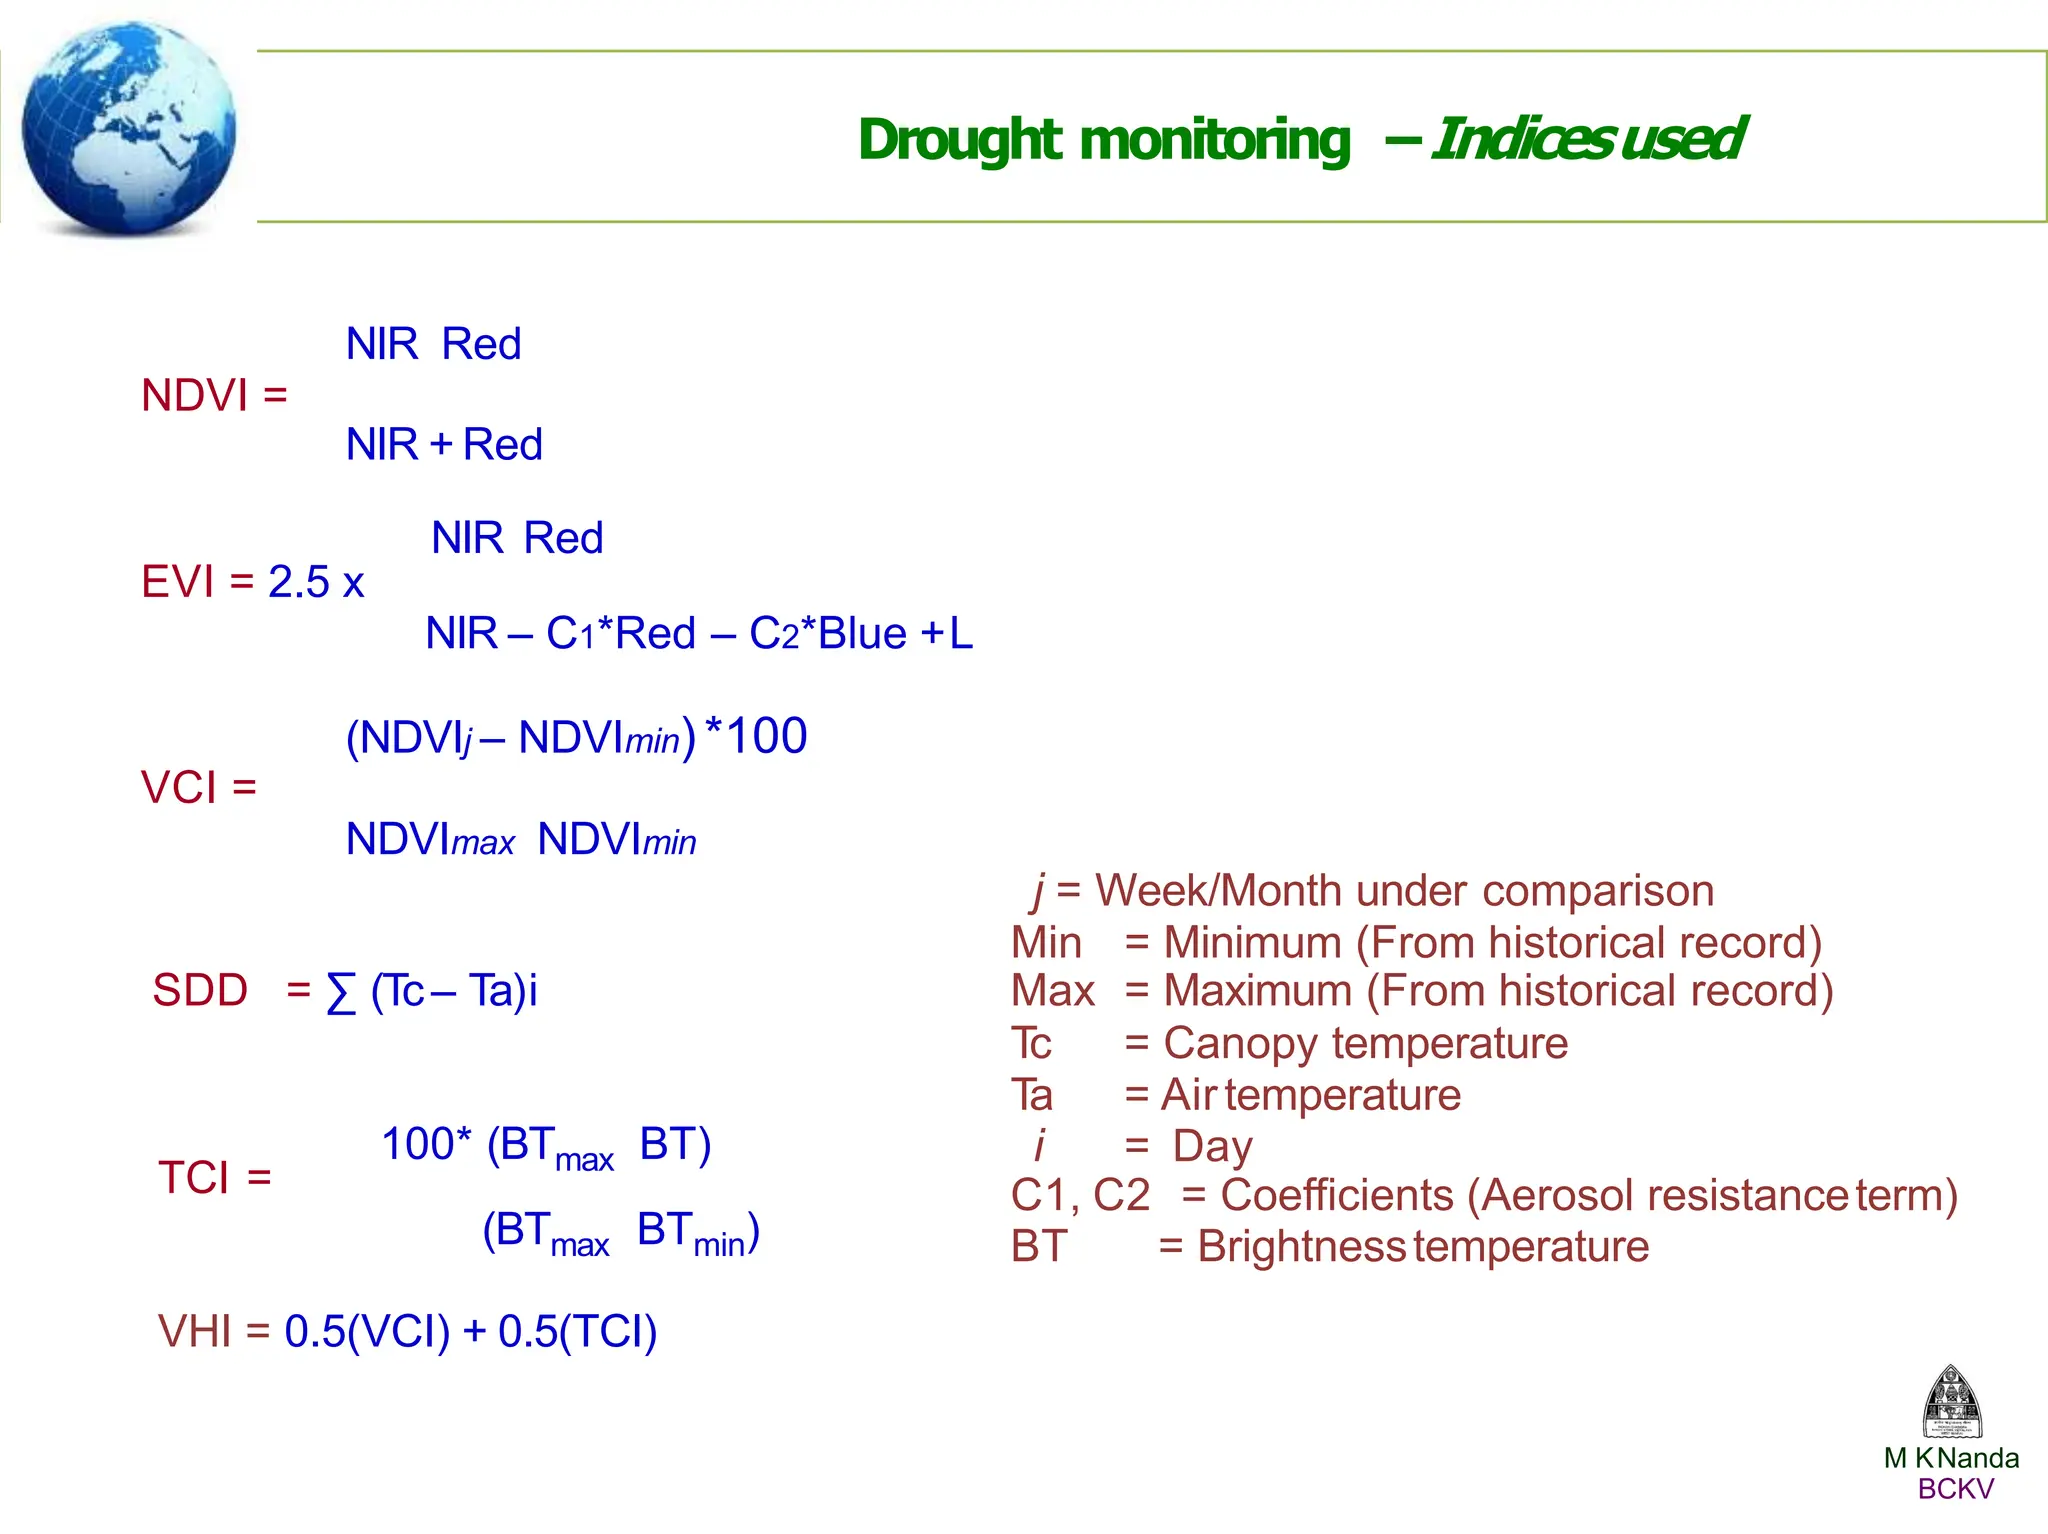
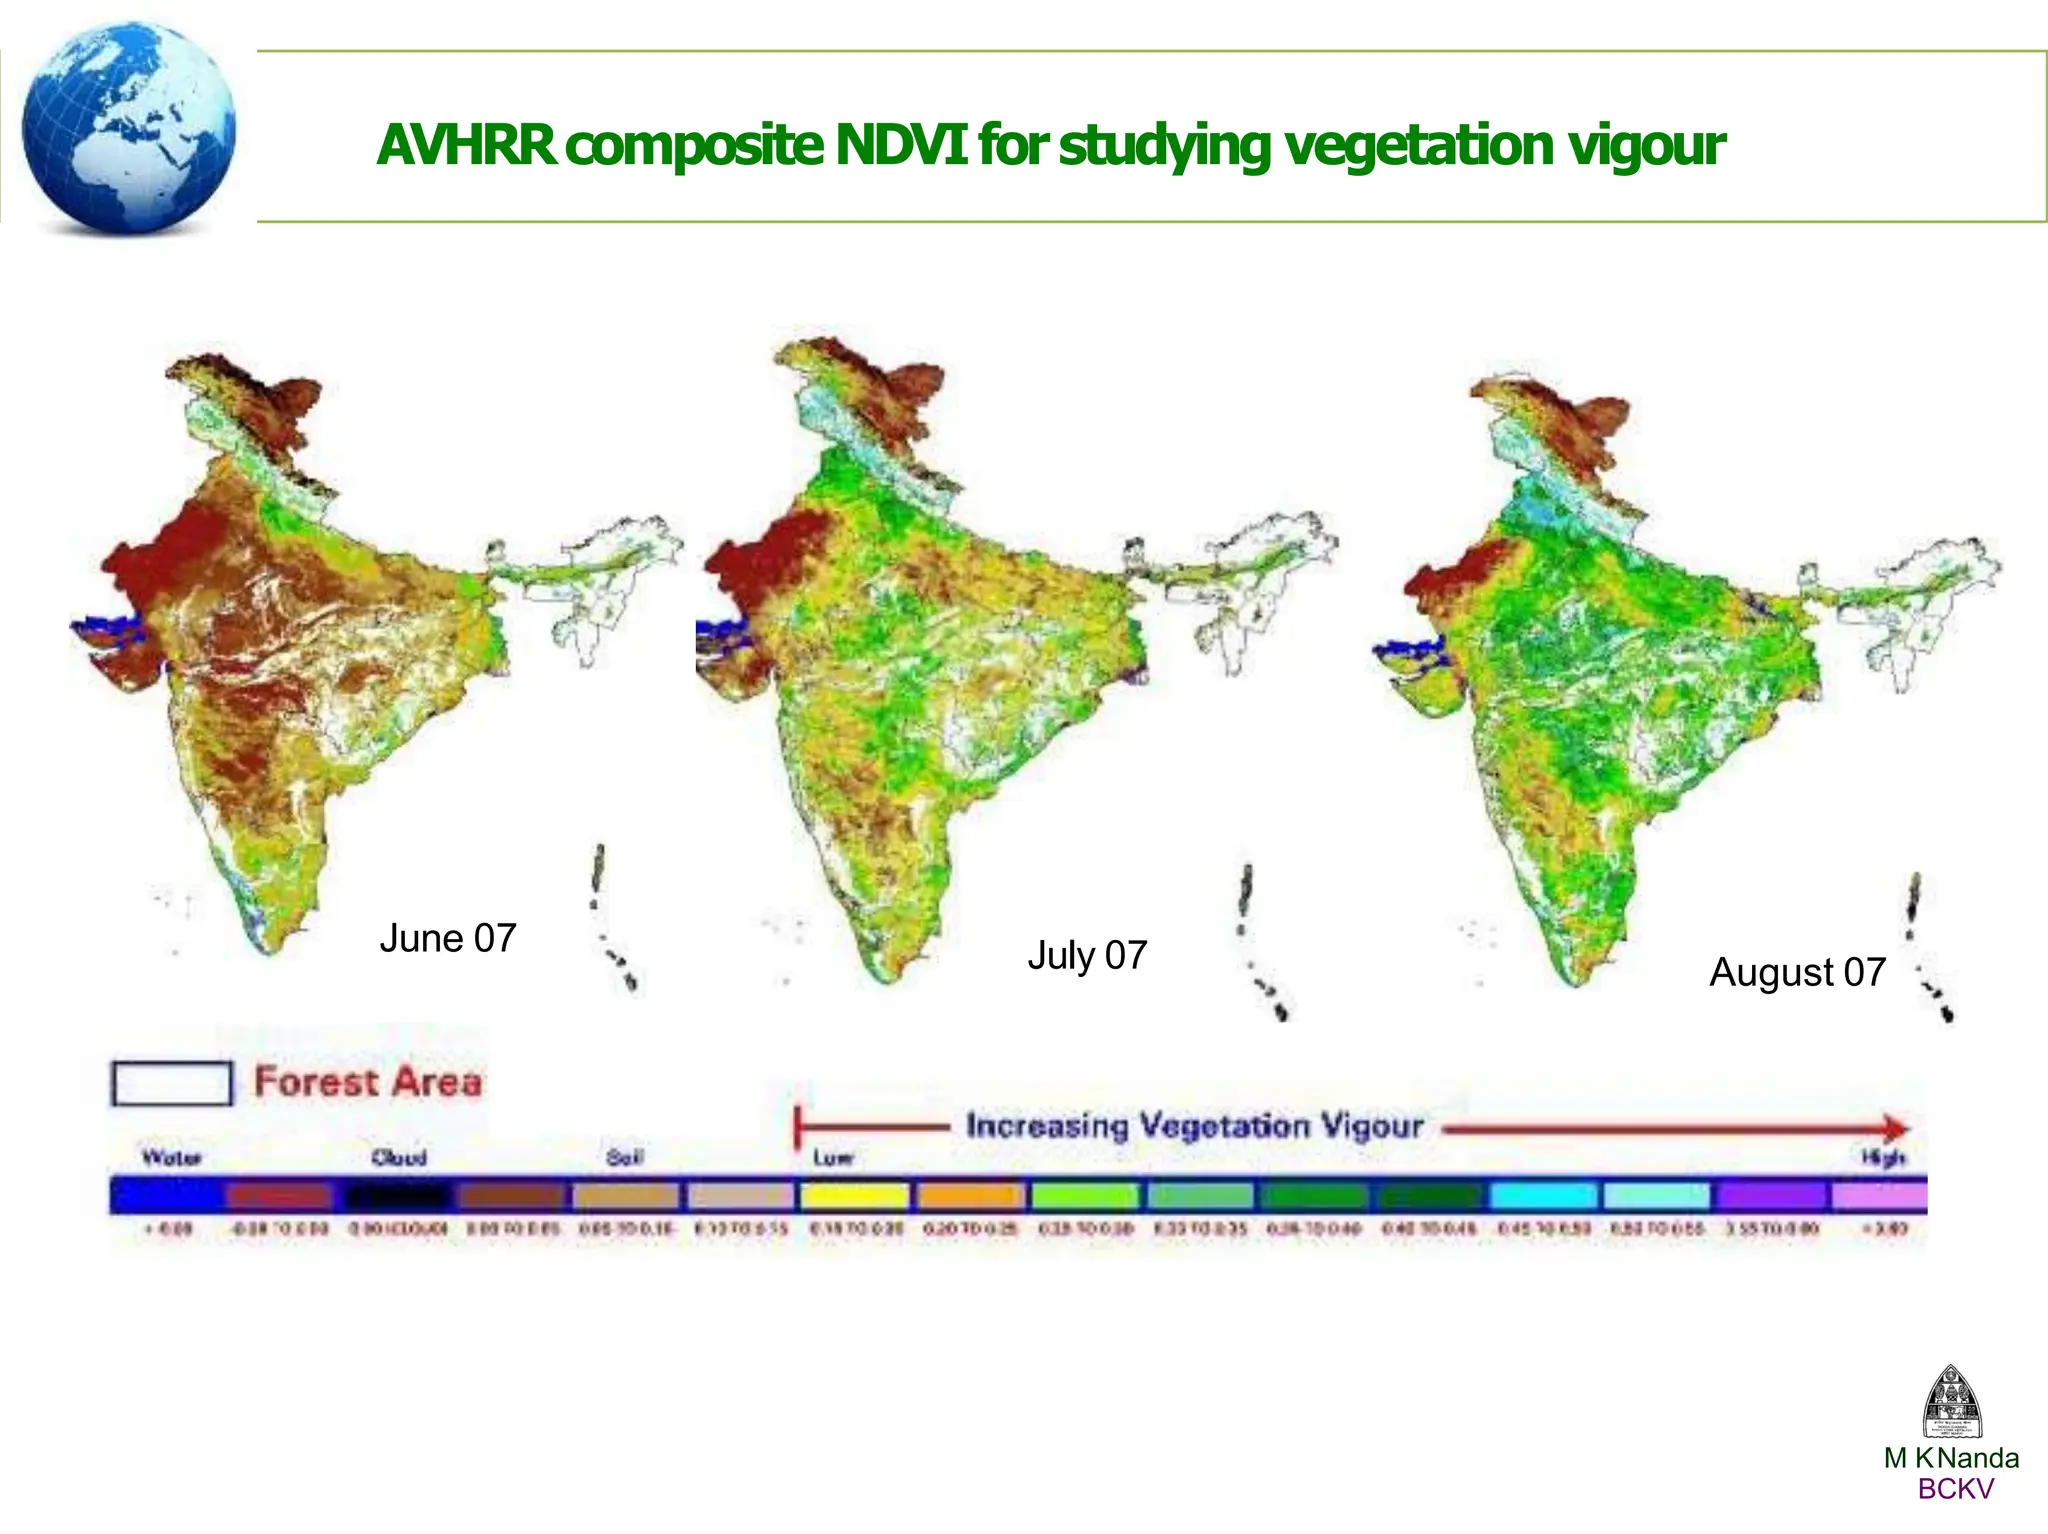
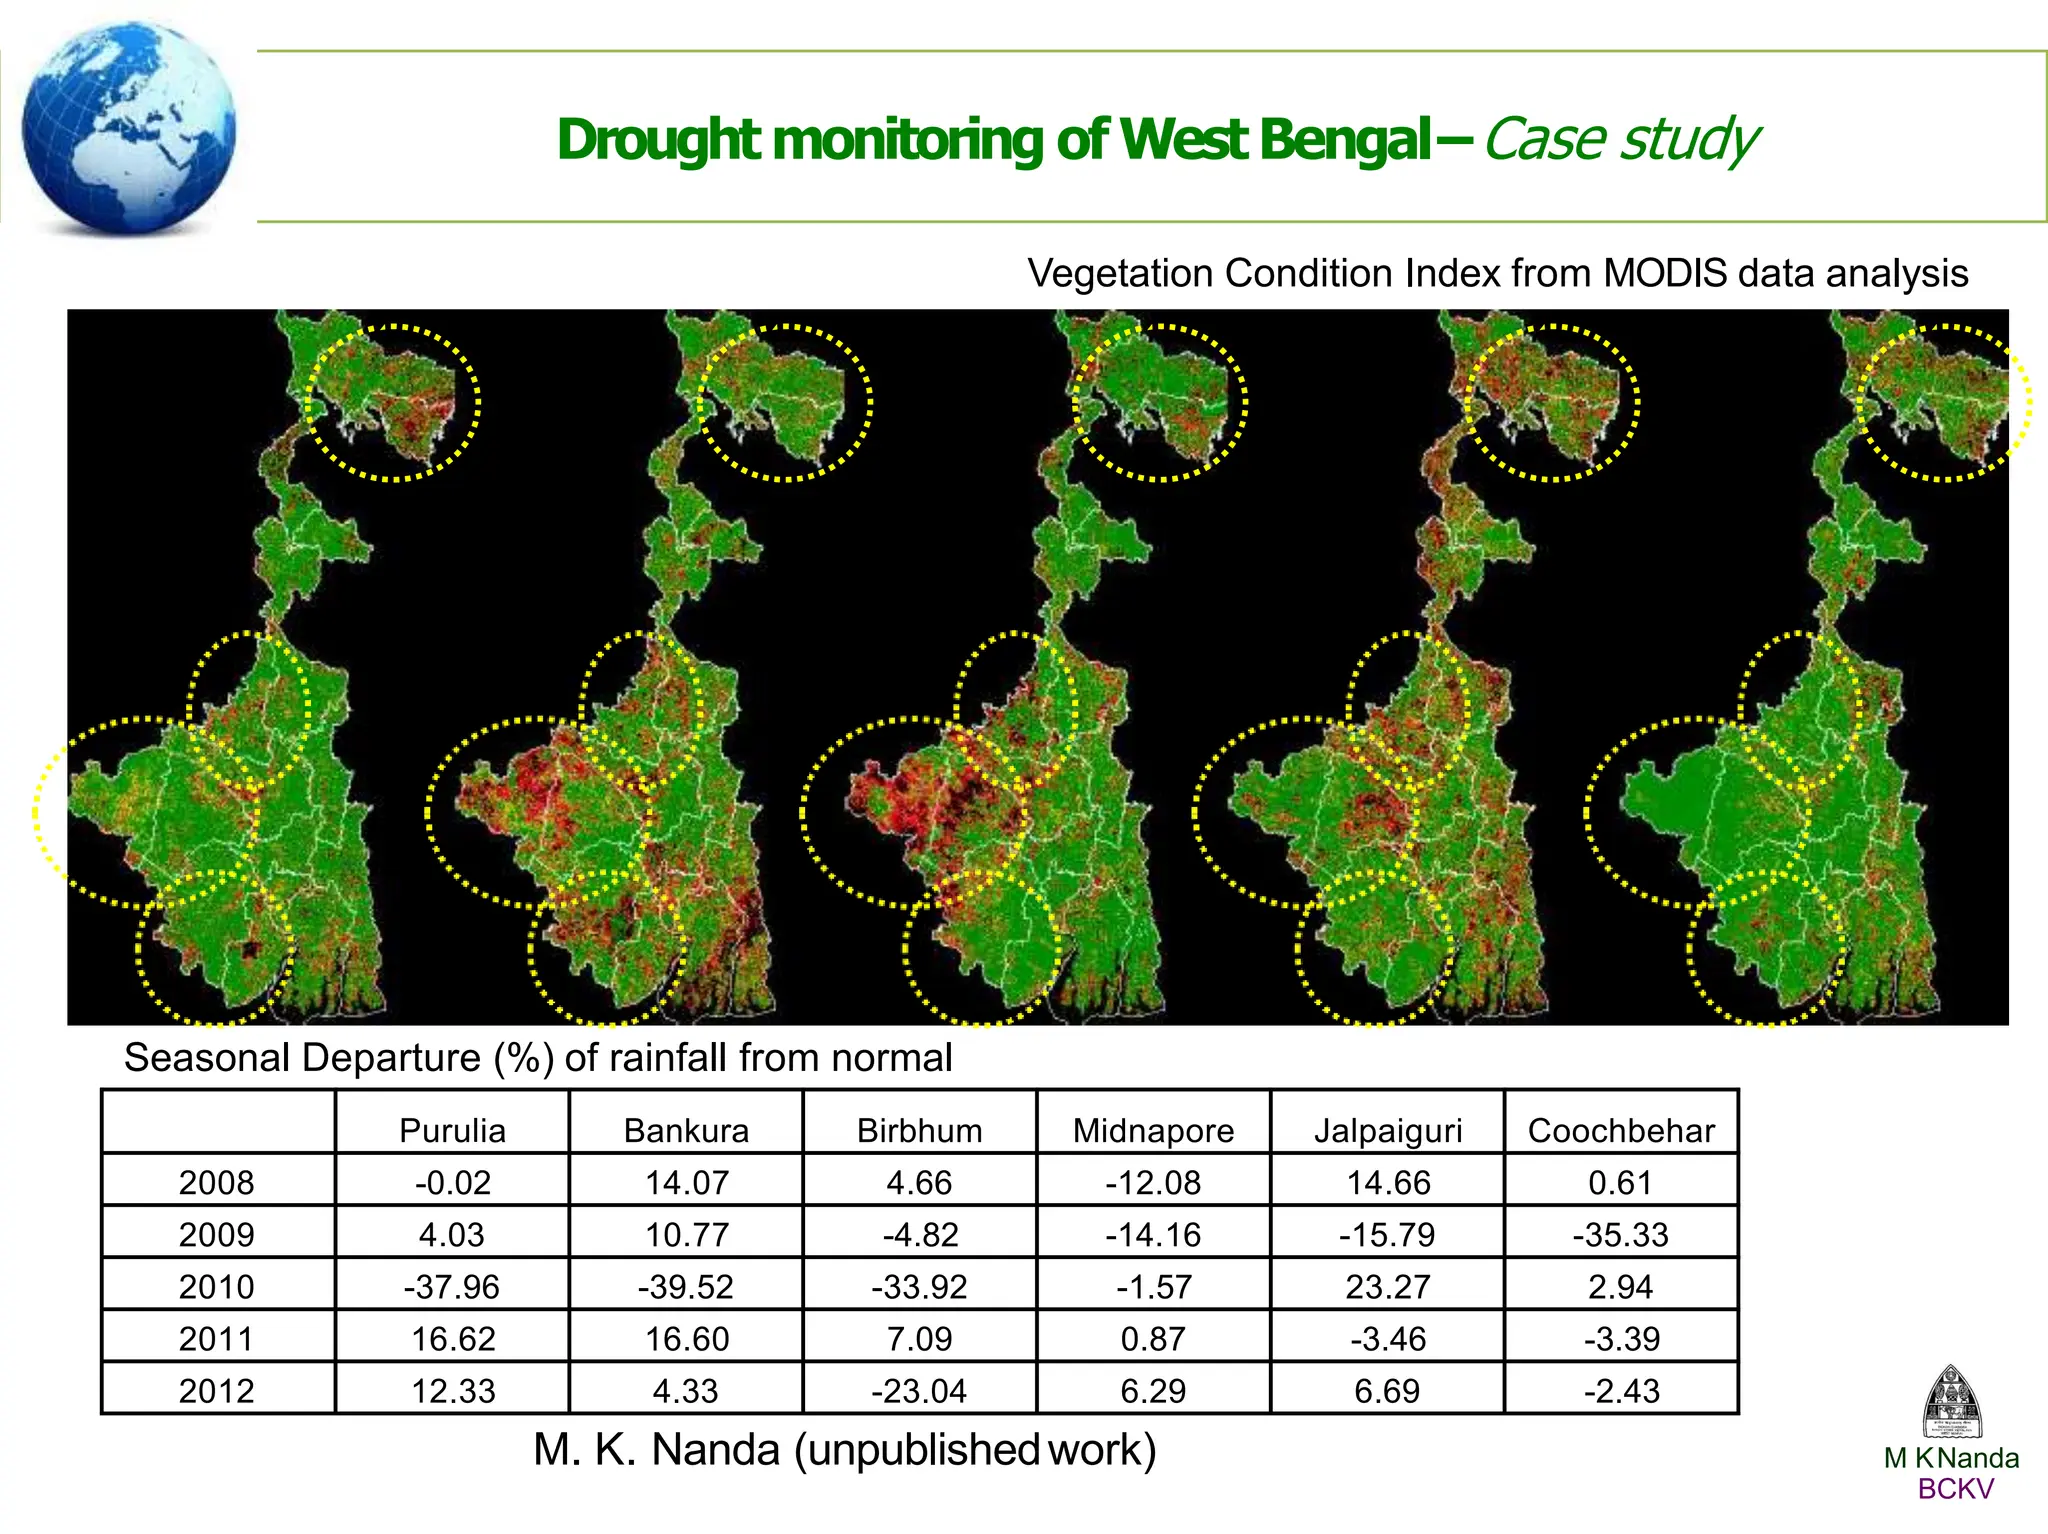
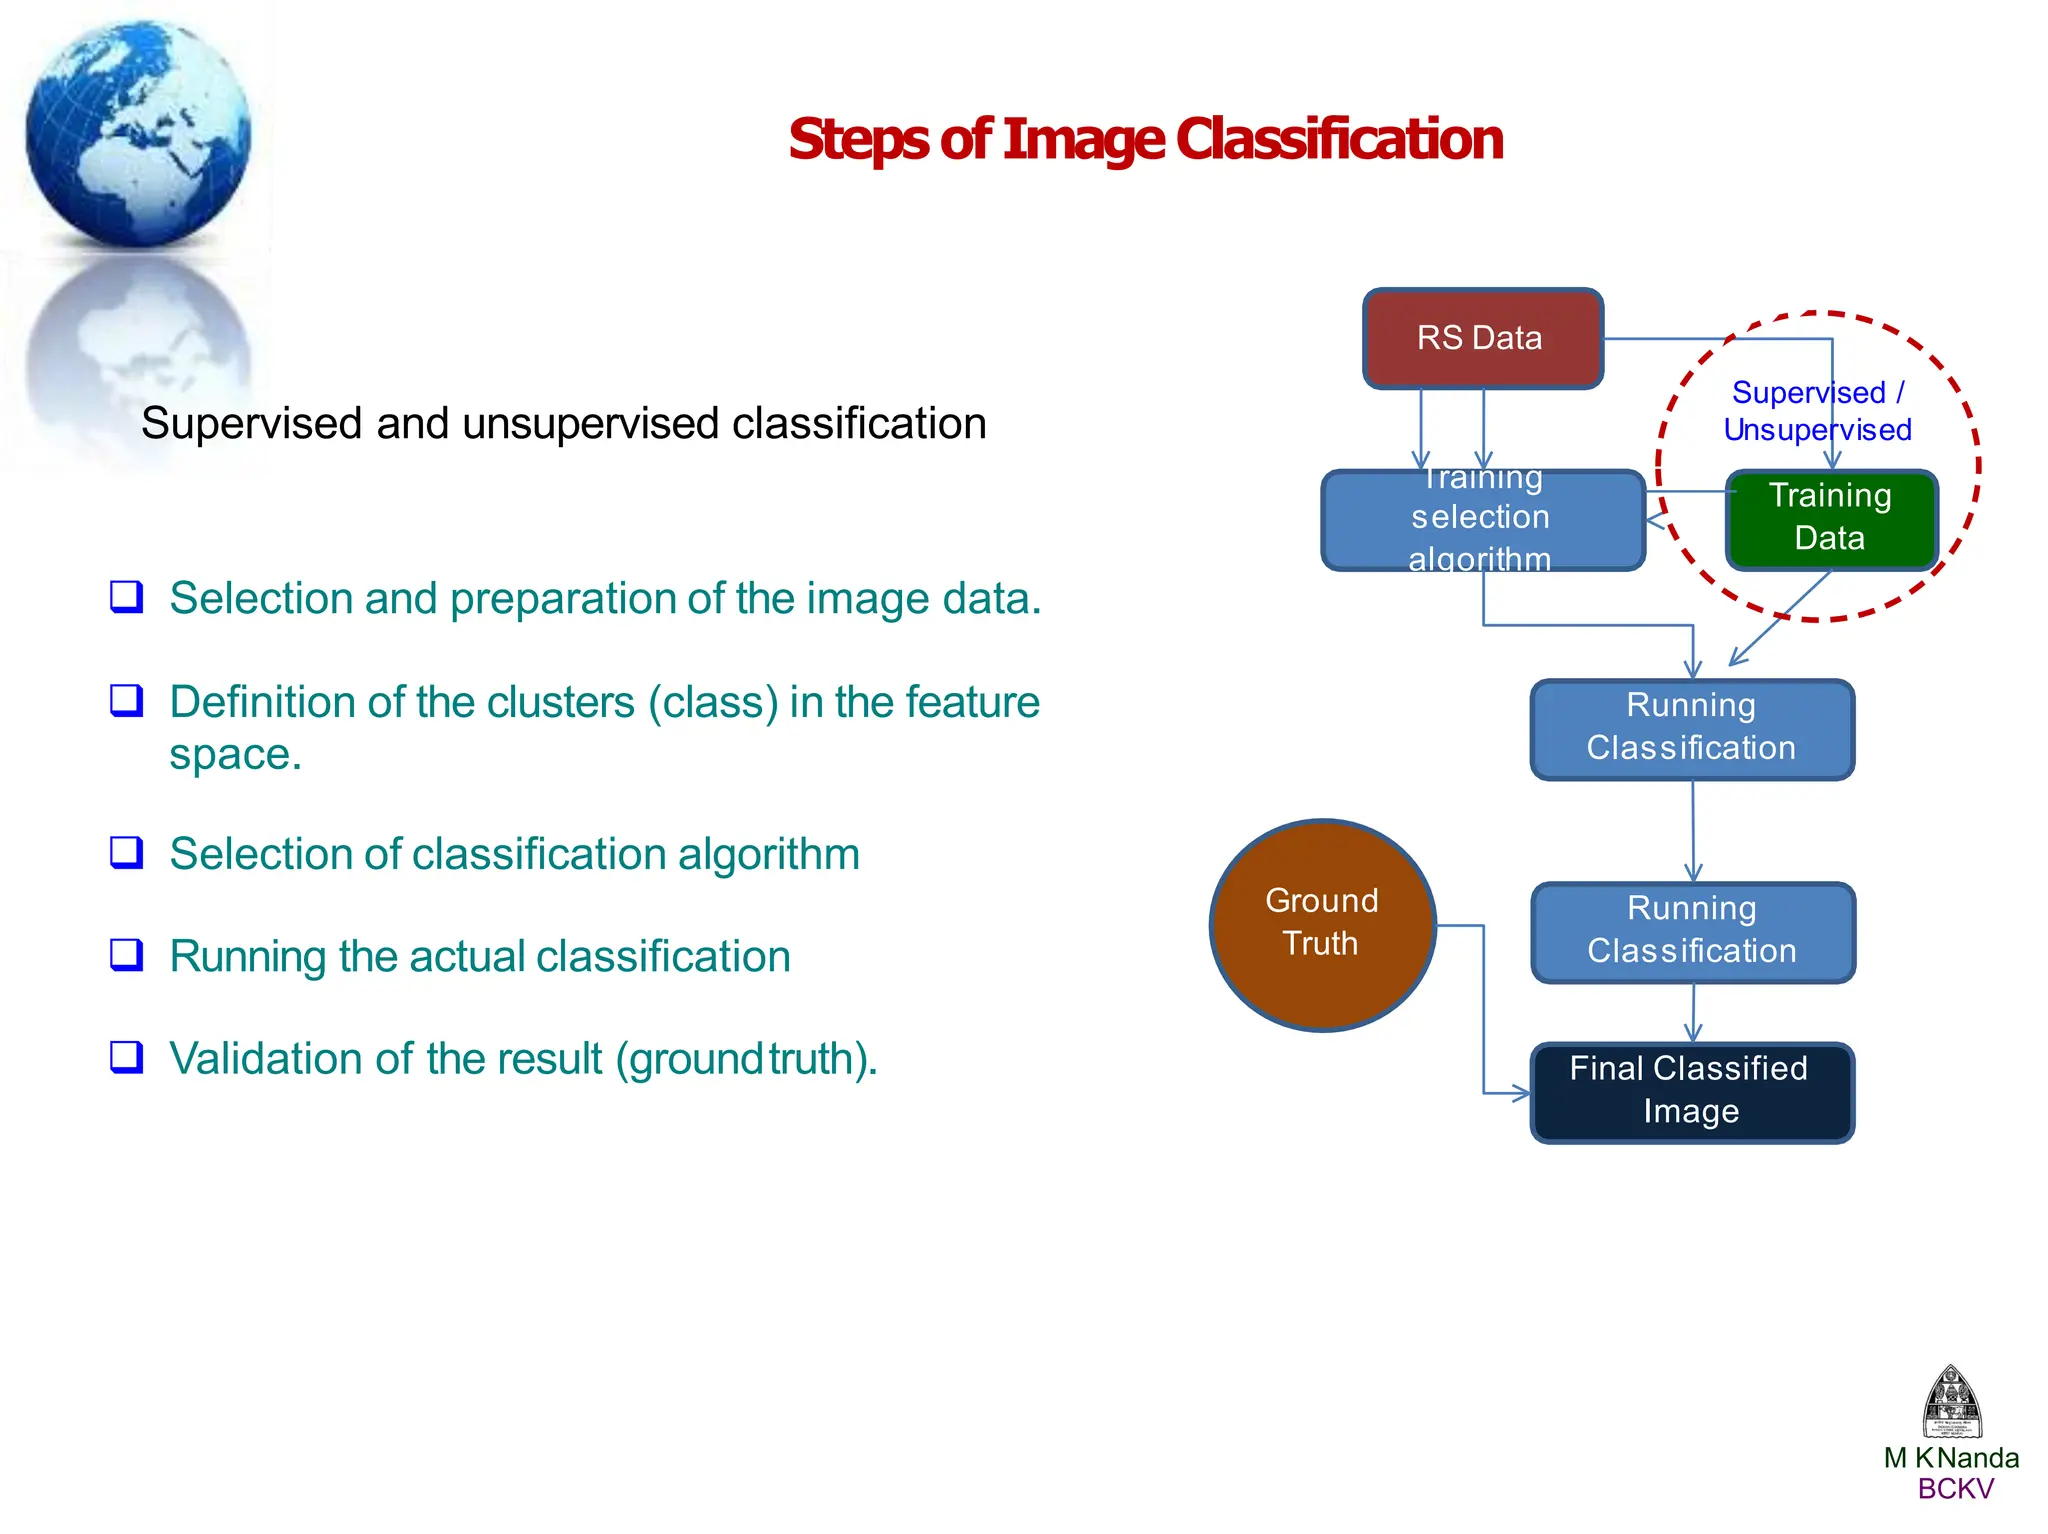
Application of Remote Sensing
in Crop Monitoring
Prof. M. K.
Nanda
Deptt. of Agril. Meteorology & Physics
BCKV, Mohanpur, Nadia,
WB
Email: mknandabckv@rediffmail.com
Whatis Geoinformatics?
Geoinformatics is the science and technology dealing with the structure and
character of spatial information, its capture, its analysis and, its storage,
processing, portrayal and dissemination, including the infrastructure
necessary to secure optimal use of this information.
Geoinformatics combines geospatial analysis and modeling, development of
geospatial databases, information systems design, humancomputer
interaction and both wired and wireless networking technologies.
M KNanda
BCKV
Componentsof Geoinformatics
Geoinformation combines different types of dataset, from GIS, remote
sensing and non-remote sensing, and socio-economic to generated
results in form of maps or other forms of reports for interpretation,
management and decision making in different fields.
Three major components:
Geographic Information Systems
(GIS), Global Positioning Systems
(GPS), and Remote Sensing (RS).
M KNanda
BCKV
Whatis RemoteSensing (RS)?
Whatis GeographicalInformation system(GIS) ?
and
Whatis GlobalPositioningSystem (GPS)?
M KNanda
BCKV
Remote Sensing –AnObservationTool
Incidence
Reflection
Emission
Ground
station
User
Cloud atmospheric particles
Scattering, Absorption, Reflection
M KNanda
BCKV
"If you can't explain it to a
six year old, you don't
understand it yourself."
Albert Einstein
Howdoes Remote sensingwork?
Incident
radiation
Reflected
radiation
Object Platform &
Processor
Colour Composite for
Visual Interpretation
Source
Signal
Sensor M KNanda
BCKV
Basic concept of Radiation : Spectral Distribution
Wavelength
(m)
Wavelength
(nm)
 Any object at a temp above 0 K emits
electromagnetic radiation.
 Wavelength of radiation is determined by the
temperature of thesurface object
 Amount of radiation depends surfacetemperature
and emissivity
 Lot of information may be obtained beyond the visible
domain
 …..but wehaveto
workwithin
atmospheric
window
M KNanda
BCKV
Sensors : Passive &Active
Passive sensor uses natural radiation (reflected or emitted)
Active sensor uses artificial source of radiation
M KNanda
BCKV
Static platforms :
Multispectral sensor mounted to a pole / Handheld Spectrometer,IR
thermometer Occasionally used in experiments
Moving platforms :
Airborne : Aircraft, Ultra Light Vehicles (ULVs), balloons,
Airship or kites are used asplatform.
Range from 100 m up to 30–40 km height.
Generally carries Aerial camera, Laser
Spaceborne: Satellite – Low height (Shuttleorbit),
Sun synchronous (Polar),
Geostationary (equatorial).
Range from 150–36,000 km height.
Mounted with multispectral scanner
Platforms
M KNanda
BCKV
First Arial Photograph (1859)
M KNanda
BCKV
Satellite Orbit
Equator
Inclination
angle
Descending
node
Orbit
South Pole
Geostationary
Sunsynchronous
Ascending
node
Ground track
M KNanda
BCKV
WhyRemote Sensing is required in Cropmonitoring?
• Pressure for high production
• Declining natural resources – water, soil productivity…..
• Climate change issue
• Market demand
• Geographically diverse situation demands differential approach (Spatial
decision making)
M KNanda
BCKV
Cost effectiveness
Though establishment cost is high, the maintenance cost very low as compared
to other means
Timeliness
Real time Information collection and processing - faster than any other system
Unbiasedinformationgeneration
As the informations are collected and processed mechanically the human bias is
avoided
Monitoring inaccessibleareas
Difficult/Inaccessible areas like deep forest, ocean, mountain peaks are being
monitored
Sensing typicalfeatures
Human vision (or other sensing organs) is sensitive in visible radiation. But lot of
informations can be generated from the infrared, microwave, radio wave signals
Advantages of Remote sensing
M KNanda
BCKV
Canthe complexplantandsoilprocesses be explainedbyRemoteSensing?
And…..how far?
How?
Remote Sensing is based on radiative exchange
• Resolution varies from 1 m(more than a crop canopy) to >1
km (more than a fieldunit)
Spatial
• Hyper spectral to Panchromatic
Spectral
• Varies widely
Radiometric
• 1 hour (Geostationary) to 20 days
• Usual y hightemporal data have poor spatialresolution
Temporal
M KNanda
BCKV
How does Remote Sensing differentiate features?
Concept of Spectral Signature and VegetationIndex
M KNanda
BCKV
visible and infra-red range
Figure . Spectral reflectance signature of different targets including
(1) cloud, (2) snow, (3) vegetation, (4) soil and (5) water along with location of
IRSP3 MOSA, B & C sensor channels (Courtesy; DLR,Germany).
Spectral signature
M KNanda
BCKV
Spectral signature
M KNanda
BCKV
Concept of Vegetation Index
 Some algebric combination of remotely sensed spectral bands can tell something
important about vegetation
(Jordan, 1969; Pearson and Miller, 1972)
Ratio VegetationIndex
ρNIR
RVI =
ρred
Range = 0 toinfinite
Normalized Difference Vegetation Index (Kriegler, 1969; Rouse et al.,1973)
ρNIR ρred
NDVI = Range = 1 to +1
ρNIR+ ρred
Difference Vegetation Index (Richardson and Everitt(1992)
DVI = ρNIR ρred
Soil Adjusted Vegetation Index (Huete, 1988)
M KNanda
BCKV
ρNIR ρred
SAVI = x (1 + L)
ρNIR+ ρred +L
Range = 1 to+1
WorkingwithRemote Sensing
Acquiring image
(Reflectance/
Radiance)
Storing/
Transmssion
(DN in diff
bands)
Visualization/Colour composite
(Digital no. in diff bands)
Single band
(Monochromatic)
Multi
spectral
Geometric
correction
Atmospheric
correction
Radiometric
correction
Satellite System
(Image acquiring)
Software system
Image Processing
True Colour
composite
False Colour
composite
Interpretation
Visual Digital
Beforestart, Let’sknowtheDataStructureof Remote Sensing
M KNanda
The basic understanding :
Data Structure,Colour Composit & Visualization
RedGreenBlue
True (Natural) colour composite
BCK
V
False colour composite (FCC)
M KNanda
GIS–ASpatial Analysis &Decision Making Tool
Model Application by GIS Grid
Cells
Model
Initialization
Model
Driver
s
GIS – A computerised storage, processing and retrieval systems that have hardware and
software specially designed to cope with geographically referenced spatial data and
corresponding information attribute.
Thematic Maps of
• Crop Yields
• Water stress
•Nutrient Stress
Charts & Graphs
Model
Output
Operational
Information
Weather
Crop
Soil
Information
layers
BCK
V
Functionalit
y
Satellite Image
What is
GIS
•
• GISystems – A computerized tool that helps solve
geographic problems.
• GIScience – A scientific approach to the fundamental
issues arising from geographic information.
GIStudies – the systematic study of society’s use of
geographic information, including institutional,
organizational and procedural issues.
• GIServices – The business of providing GIS data
and analysis tools to GIS users.
(derived from Longley, e al, 2001)
GISytems, GIScience, GIStudies, and
GIServices
Defining
GIS
Burrough (1986): GIS is ‘a set of tools for collecting, storing, retrieving at will,
transforming, and displaying spatial data from the real world for a particular
set of purposes’,
The components of a GIS include:
• the computer system (hardware and operating system),
• the software,
• the spatial data,
• data management and analysis proceduresand
• the people to operate the GIS.
Desirable capabilities of ‘well-designed
GIS’
a) Quick and easy access to large volumes of data.
b) The ability to:
• select detail by area or theme;
• link or merge one data set with another;
• analyze spatial characteristics of data;
• search for particular characteristics or features in an area;
• update data quickly and cheaply; and
• model data and assess alternatives.
c) Output capabilities (maps, graphs, address lists and summary
statistics) tailored to meet particular needs.
Some important areas of application of GIS
• Different Streams of Planning: Urban planning, housing, transportation
planning architectural conservation, urban design, landscape planning etc.
• Street Network Based Application: It is an addressed matched application,
vehicle routing and scheduling: location, development andsite selection and
disaster planning.
• Natural Resource Based Application: Management and environmental
impact analysis of wild and scenic recreational resources, flood plain,
wetlands, acquifers, forests, and wildlife.
• View Shed Analysis: Hazardous or toxic factories siting and ground water
modelling. Wildlife habitat study and migrational route planning.
• Land Parcel Based: Zoning, sub-division plans review, land acquisition,
environment impact analysis, nature quality management and maintenance
etc.
• Facilities Management: Can locate underground pipes and cables for
maintenance, planning, tracking energy use.
Data Structure in
GIS
Data vs information
• Data : representations that can be operated upon by a computer
• Information: data that has been interpreted by a human being.
Spatial data
• Spatial data : data that contains positional values.
• Geospatial data : spatial data that referenced to geographic
position
Spatial data that is not georeferenced can have positional data
unrelated to the Earth’s surface. Examples - position of atoms in
molecules in molecular chemistry, condition of internal organs in
medical science
Data Structure
Based on source data can be
• Primary data : collected through first-hand observation.
• Secondary data : collected by another individual or organization, for
example consumer surveys of customers buying ski equipment.
Data have three modes or dimensions
• Temporal – Date & time of occurrence;
• Thematic – Intensity, wind speed, amount of loss occurred etc. and
• Spatial – Where it was originated, where exactly it hit the landmass
(w.r.t. latitude & longitude)
Data Models in
GIS
Vector Data Model
• Vector data model represents objects by defining the location of their
boundaries of real-world objects using 2D geometric types: point, line, or
polygon and a real-world coordinate system.
Raster data model
• Array of cells, or pixels to define grids and encodes the grid cells based on
objects in the cell. Data (cells containing values that measure the presence/
absence/strength of some field or phenomena) are stored as an array of grid
values, with metadata held in a fileheader.
Attribute model
• Associating/manipulating the properties (features) of objects or cells
For a polygon map of water bodies the features like area of water body, depth
of water, salt content of water etc are stored in attribute model associated
with the vector map
Vector Data Model : Topological features
Topology deals with spatial properties that do not change under certain
transformations. A simple example will illustrate what we mean.
Advantages of arc-node structure over simplefeatures
Assume you have some features drawn on a sheet of rubber. Stretch the sheet
to different forms, do not tear it. The features will change in shape and size.
Some properties, however, do not change:
• area E is still inside areaD,
• the neighbourhood relationships between A, B, C, D, and E stay intact,
and their boundaries have the same start and end nodes, and
• the areas are still bounded by the same boundaries, only the shapes
and lengths of their perimetry have changed.
Map concept: Features and Properties
A map represents geographic features or other spatial phenomena by graphically
conveying information about locations andattributes.
Locational information : position of particular geographic features on the
Earth’s surface, as well as the spatial relationship between features
Attribute information : characteristics of the geographic features represented,
eg. feature type, name or number and quantitative information area or length
etc.
Thus the basic objective of mapping is to provide
• Descriptions of geographic phenomenon
• Spatial and non spatialinformation
• Map features like Point, Line, & Polygon
Soil Map of
Bhabanipur village
Map concept: Characteristics of a map
Map Features: point features - wells and schools, traffic posts
lines for features - streams, roads and contour lines
areas for features(polygons) lakes, cultivated lands
Scale in Digital Maps: Digital maps do not remain fixed in size. They can be
displayed or plotted at any possible magnification. In digital mapping, theterm
scale is used to indicate the scale of the materials from which the map was
made.
Map Resolution: how accurately the location and shape of map features can be
depicted for a given map scale. Scale affects resolution. Larger-scale map are
of high resolution. As map scale decrease, the map resolution diminishes
because features must be smoothed and simplified, or not shown at all.
Map Accuracy: how accurately features can be depicted. It includes the quality of
source data, the map scale and draftsman skills
Map Extent: the area on the Earth’s surface represented on the map. The
smaller the scale the larger the area covered.
Database Extent: database is the limit of the area of interest for the GIS project.
Data Automation: Logical organizing of map features and sequencing. Map data
are collected, automated and updated as series of adjacent map sheets.
Attributes are associated with features. Layer are edge matched and joined
into a single coverage for our study area as per requirement.
Map Projections & Coordinate System
Spatial Reference = Datum + Projection + Coordinate system
Geodesy - the shape of the earth and definition of earth datums
Map Projection - the transformation of a curved earth to a flat map
Coordinate systems - (x,y,z) coordinate systems for map data
Types of Coordinate Systems
• (1) Global Cartesian coordinates (x,y,z) for the whole earth
• (2) Geographic coordinates (φ, λ,z)
• (3) Projected coordinates (x, y, z) on a local area of the earth’s surface
Shape of the
earth
• When specifying location we need to use a model to describe the shape of the
Earth.
• At small scales, the Earth may be assumed to be round (i.e. a sphere).
• At larger scales, we need to model the Earth as an ellipsoid (an oblate spheroid)
.
• Ellipticity f (or ‘flattening’) is defined as (a-b)/a, where a is the semi-major axis
• Ealnlidptbiciistythfe
(
o
s
r
e
‘
fl
m
a
i
t
-
t
m
e
n
i
n
i
n
o
g
r’a)xisisd.efined as (a-
b)/a, where a is the semi-major axis and b is
the semi-minor axis.
• The ellipticity of the Earth is estimated by
the World Geodetic System 1984
(WGS84) as 0.003353 – i.e. it is almost a
sphere. Other ellipsoids with slightly
different estimates are used by different
mapping agencies.
• The ellipsoid used should be defined as part
of the datum.
Standard ellipsoid
For the earth:
• Major axis, a = 6378 km, Minor axis, b = 6357
km,
• Flattening ratio, f = (a-b)/a = 1/300(approx)
Standard Ellipsoids
Horizontal EarthDatums
An earth datum is defined by an ellipse and an axis of rotation
NAD27 (NorthAmerican Datum of 1927) uses the Clarke (1866) ellipsoid on a non
geocentric axis of rotation
NAD83 (NAD,1983) uses the GRS80 ellipsoid on a geocentric axis of rotation
WGS84(World Geodetic System of 1984) uses GRS80, almost the same as NAD83
Ellipsoid Major axis, a (m) Minor axis, b (m) Flattening ratio, f
Clarke(1866) 6,378,206 6,356,584 1/294.98
GRS80 6,378,137 6,356,752 1/298.57
The
Geoid
• An ellipsoid may not be sufficiently accurate for detailed
measurements at large scale.
• The Earth is actually slightly ‘pear-shaped’.
• It also has ‘bumps’ and‘hollows’ (ignoring terrain).
• For geodetic measurements, thegeoid
is used.
• This is defined as the ‘equipotential
surface that most closelycorresponds to
mean sea level’.
• Mean sea level varies from place to
place, so different mappingagencies
use slightly differentgeoids.
Geographic Coordinate
System
• Treating the Earth as a sphere, the
traditional approach is to use spherical
coordinates or geographical coordinates.
• These express location in termsof latitude and
longitude.
• Latitude is the angle at the centre of the earth
between the point of interest and theequator.
• Longitude  is the angle at the centre of the
Earth between the point of interest and the
prime meridian (i.e. the line running from pole
to pole through Greenwich).
• By convention the latitude of a place in the northern hemisphere is positive, andin
the southern hemisphere it is negative.
• Places east of Greenwich have a positive longitude, places west have a
negative longitude.
Global Cartesian Coordinate
System
• Used by satellite systems.
• Here a point is defined in the x-y-z space
• Treating the centre of the spheroid as the origin,
the Z-axis is aligned with the minor axis of the
ellipsoid (i.e. through the north pole), and the X
and Y axes lie on the equatorial plane. The X-
axis intersects the equator at the prime
meridian, and the Y axes is at right angles to it.
• Any point in 3-D space can be expressed
relative to the 3 axes.
Planar (Projected) Coordinate
System
• Two dimensional Cartesian coordinates are normally used for projected
maps.
• The X corodinate measures distance in an east-west direction, and the
Y coordinate measures it in a north-south direction.
• The true origin is at the centre of the map, but because negative values
are unwieldy, a false origin is usually defined to produce positivevalues.
• The location of the false origin (i.e. offset) and type of projection should be
specified in the datum.
•
• Global Positioning System (GPS) provides accurate,
continuous, worldwide, threedimensional position
and velocity information to users with the
appropriate receiving equipment. GPS disseminates
a form of Coordinated Universal Time (UTC).
The satellite constellation nominally consists of 24
satellites arranged in 6 orbital planes with 4
satellites per plane. GPS can provide service to an
unlimited number of users since the user receivers
operate passively (i.e., receive only). The system
utilizes the concept of oneway time of arrival (TOA)
ranging and determines the coordinates through
triangulation.
GPS- ANavigationTool
M KNanda
BCKV
We understand our resources are limited,
but enough to start with........
Working with RS and GIS
M KNanda
BCKV
Crop cultivation
and harvesting
• Land preparation
• Sowing
• Input management
• Water management
• Fertilization
• Pest management
Post harvest
• Marketing
• Transportation
• Packaging
• Storage
• Food processing
Precultivation
• Crop selection
• Land selection
• Calendar
definition
• Access to credit
Information for
the selection of thebest crop
according to their land,
access to input and credit,
market (Cost-Benefit), etc.
Information for the sound
management of thewhole cropping
activities, including the resilience to
natural (e.g. weather) and
anthropogenic shocks
Information related to
post-harvest and tools,
marketing & transportation
infrastructures, etc.
Information need
at different phases of agriculture
M KNanda
BCKV
WorkingwithRemote Sensing : Basic Requirements
Hardware
Standard Desktop computer / Laptop.
Internet facility to access imageries
Software
Commercial/Edu. version : ArcGIS, ERDAS Imagine, ENVI, IGIS, Gieomatica etc.
Open Source : ILWIS, GRASS, SPRING etc. (Freely downloadable from internet)
All the softwares are having user friendly tutorial
Data
Free data: INSATimage (1 km resolution with hourly periodicity) from MOSDAC server of ISRO
MODIS image (1 km and 250 m resolution at daily or composite) from Reverb Echo site
Landsat image (30 m resolution) from USGS site
SPOT vegetation
Paid data: LISS III (23 m) or LISSIV etc. to IKONOS, Cartosat etc.
M KNanda
BCKV
WorkingwithGIS: Howto start
•
•
•
Scan Toposheet/ map output as jpg or –tiff format
Import jpg or tiff file to your software
Make georeferencing Assigning latitude/longitude values (for >4 points) to raster layer &
Get your base mapready
Dig
r
e
it
s
i
a
za
m
t
p
io
lin
n
g
•
•
Digitize the features Polygons, Lines or Points on the georeferenced raster layer
Different features are saved as several layers
Adding attributes
• Tag the attribute layers to the respective vector layers with reference column
like Field Id for individual polygon in a polygon layer
• You can add one or more fields or parameters to the existing attribute
M KNanda
BCKV
Field
Id
Owner’s
name
Area Cropping
system
Irrigation
regime
N-
status
P- status K- status
1 Xxx R-M
2 Yyy J-V-R
3 Zzz
WorkingwithGIS: Gettingoutput
Field Id Owner’s
name
Area Crop
Prekharif
Crop
kharif
Crop
rabi
Irrig.
regime
N-
statu
s
P-
statu
s
K-
statu
s
1 Xxx * Jute vegetabl
e
Potato 2 H L H
2 Yyy * No Rice Mustard 1 M L H
3 Zzz * No Rice No 0 L L L
M KNanda
BCKV
*Area, distance etc will be computed automatically during digitization
Put your query (like given examples)
• ExAreas under Jute based cropping system,
• Fertility status map (Interpolating if required, done by Digital Elevation Model in GIS)
• List of farmers having 300% cropping system.....................etc,
Get your output
• In form of map, table etc in printable format as per the query
WorkingwithRemote Sensing : Howtostart
Import Image to your software
Original image is in geotiff format (a generic format read by all softwares)
The S/W imports the file to its own workable format (like img for ERDAS, hdr for ENVI etc.)
Image correction/preprocessing
Geometric correction for high resolution images (30 m or less) Accurate matching of image point
with surface point
Radiometric correction compensating for atmospheric effect or data error due to sensor failure
Image Enhancement
Contrast enhancement (Stretching)
Stretching the range of DN values over the whole range of visualization
Spatial enhancement (Filtering)
Modification of an image pixel value, based on the pixel values in its immediate vicinity (local
enhancement).
You can start with RS data products like NDVI, LST, LAI etc.
These require minimum processing M KNanda
BCKV
WorkingwithRemote Sensing : Howtostart
Digital analysis
Semiautomatic processing by the computer. Examples include automatic generation of DTMs, image
classification and calculation of surface parameters.
Visual Interpretation
Information extraction based on visual analysis or interpretation of the data. The prerequisite of
visual image interpretation is to develop colour composite. The colour composite may be –
True colour composite – Natural colour composite where blue, green and red bands are used as
it is. It looks like real life photograph. Example – Google earth image
False colour composite (FCC) – Here the basic colours (blue, green and red ) are assigned to
different bands. The conventional FCC is developed by assigning the red colour to NIR band,
green to red band and blue to green band. This makes the land surface features more
distinguishable. In FCC vegetation looks red, deep water body looks blue, wetland looks dark,
shallow waterbody looks black. barren land looks grey to white. Buildup area looks cyan
Visual interpretation is used for mapping land use or soil. urban areas,, geomorphology, forest
and, natural vegetation etc. M KNanda
BCKV
Agro-ecological Zonation –Flowchat
Topography Met data Satellite images
Agroclimatic/ Agroecological zone
Digital Classification/
Visual interpretation
Watershed
delineation (contour,
slope etc.)
Ground observation
Training sites
• Soil Type
• Irrigation regime
• Cropping system
• Historical crop
productivity
• Land use map
• Water regime map
• Soil map
for the whole study region
Interpolation
in GIS
• Weather
maps
• Isolines
Digital Elevation
Model (DEM)
in GIS
• Temperature
• Rainfall (amount,
distribution)
• Survey of India
Toposheet
• IRS1B
•LISSI, LISSII (or
other source)
Inpu
t
After Saha & Pande (1996) Asian Pacific remote Sensing Journal , 5(2):21 28. M KNanda
BCKV
Processing
Produc
t
Agro-ecological Zones of Doon Valley
Saha & Pande (1996) Asian Pacific remote Sensing Journal , 5(2):21 28.
M KNanda
BCKV
Agro-ecological Zones of Doon Valley
Saha & Pande (1996) Asian Pacific remote Sensing Journal , 5(2):21 28.
M KNanda
BCKV
How Remote Sensing is applied in Crop monitoring?
Let’s see some examples
M KNanda
BCKV
• Studyingagro-climaticpotential
Soil resource inventory, climatic study, ecological zonation, Land
evaluation and land use planning etc.
• Crop inventory
Crop acerage estimation, production forecasting, Carbon exchange,
evapotranspiration, Stress monitoring and forewarning- moisture stress,
nutrient stress Disease pest, etc.
• Disaster management (contingent planning)
Flood, drought, Crop loss estimates etc.
Basic areas of application
M KNanda
BCKV
• Crop acreage and production estimation
• Crop condition assessment (waterstress, nutrient
stress, disease pest monitoring etc)
• Evapotranspirationandwaterbudgeting
• Agricultural drought monitoring
Crop Inventory
M KNanda
BCKV
CAPE–Programme sponsored by ministry of Agriculture for estimation of large
area crop acreage and yieldwheat, rice, cotton, groundnut, mustard
FASAL Forecasting Agricultural output using Space, Agro meteorological and
Land based observations
Crop discrimination&acreage–
• Satellite data + sample survey
• Using multi dated satellite data
• Multispatial resolution satellitedata
Crop yieldprediction –
• Spectral yield model
• Integrated yield (Agroclimatic, soil edhapic, management practice +RS derived
vegetation index) model
• Temporal crop growthapproach
• Biophysical simulationmodel
Crop acreage &production estimation (CAPE)
M KNanda
BCKV
Crop acreage estimation Basic Principles
Historical data
InseasonR.S.
Imageries
(Multidated)
Ground Truthdata
Image
Classification
Class Proportion
Enumeration
Acreage
Training
Signature
Generation
M KNanda
BCKV
Fig . Change in wheat growingarea in Western M. P. as seen usingAWiFSdata
Navalgund et al., 2007 : Current Science, 93(12)
Crop acreagefrom multi-dated imagery - Case study
M KNanda
BCKV
• FCC (Kharif, 2006) Land use classification
• FCC (Kharif, 2007) Land use classification
Fig Kharif crop area changes in parts of Jalore dist, Rajasthan (200607 to200708) Jha
and M.S.R Murthy, National Remote Sensing Centre ISRO - Contribution to
INCCA
Crop acreagefrom multi-dated imagery - Case study
M KNanda
BCKV
Crop acreagefrom multi-dated imagery - Case study
Fig
M KNanda
BCKV
Multitemporal observations over agricultural region showingdifferent growing
pattern of wheat and mustard crops
Navalgund et al., 2007 : Current Science, 93(12)
Land Use Map from Remote Sensing image
Study Area :
Coastal Blocks of 24 Pg (S) Dist,
WB
Image used
LANDSATTM4
Technique
supervised classification
M KNanda
BCKV
M K Debnath,
M K Nanda and
D Majumder
(Ph.D. Thesis work)
Crop production estimation – The simple rule
• Select relevant crop stage and parameter that is correlated to crop yield
(Define the empirical relation)
• Find relationship between vegetation index (from images) and the specific crop
yield attributing parameter (Define the empirical relation)
• Derive the agroclimatic yield index using soil and meteorological data
• Accuracy assessment of yield estimation
M KNanda
BCKV
Crop yield estimation using Biophysical Simulation Model
- Model Framework
Crop file Weather file
Soil file
Yield prediction
Crop Model
(WOFOST, InfoCrop etc.)
Potential Yield for the
specific location
Inseason RS
Forcing
M KNanda
BCKV
Relationship between rice growth
parameters and yield based on
field observations
M KNanda
BCKV
Crop production estimation - Example
Rice greenness Minolta SPAD-502
leaf chlorophyll meter
Relationship between plant height at 63 d and yield
Relationship between plant height x leaf greenness
at 63 d and crop yieldof
Relationship between rice leaf greenness at63 d and
yield
Rice yield as a
function of NDVI at
63 days
M KNanda
Crop production estimation - Example
Statistical Test for
accuracy of yield
prediction
BCK
V
Nuarsa et al., 2012, Journal of Agricultural Science Vol. 4, No. 3; 2012
Crop acerage &productivity estimation –Case study
Haryana State Remote Sensing Application Centre (HARSAC)
M KNanda
BCKV
Hooda, et al. (2008), ISPRS Archives XXXVI8/W48 Workshop proceedings:
Remote sensing support to crop yield forecast and area estimates
Wheat acreage and productionestimation Haryana State
Haryana State Remote Sensing Application Centre (HARSAC)
Districtwise estimate of 2004
Estimate over the years
M KNanda
BCKV
3.51 4.75 t/ha
Grid wise simulated wheat yield for Haryana
for 199697
Data :
maps
WiFS RS data + weather & other
Model: WTGROWS inGIS
Sehegal et al, 2001
Proc. IRS NationalSymposium
Crop yield estimation using Biophysical Simulation Model
- Case Study
M KNanda
BCKV
Remote sensors
onboard system
Changes in spectral
response
Crop damage
Insect/pest/
disease
infestation
Moisture
stress
Nutritional stress/Salt
stress/ physiological
disorder
Change incanopy
geometry/ leaf
area
Change in
pigment
composition
Change in leaf
moisture content
Change in
canopy temp.
Stress
Effect
Sensing
Principles of RSapplication in stress monitoring
M KNanda
BCKV
In both visible range (500 to 700
nm) and NIR range PLB infected
plants have low reflectance
Project Area : Field survey in potato growing areas of WB
Detection of aphid andabiotic stress
348
425
501
575
646
715
781
844
902
957
1088
1276
1460
1639
1811
1960
2094
2222
2345
2461
M KNanda
BCKV
140
120
100
80
60
40
20
0
D Dutta, M K Nanda and R P Kundu
(Unpublished work)
PRI– Photochemical
Reflectance Index
R531R570
= R531+R570
DI– Disease Index
(Field measured) of wheat
yellow rust
Huang et al. (2011) Remote Sensing –
Applications
Yellow rustof wheat- Case study
M KNanda
BCKV
Visualanalysis of FCC –By evaluating ‘redness’ tone of FCCs between drought year
and immediate previous normal year aerial extent of drought can be evaluated
Using Spectralvegetationindex–NDVI(Normalized difference vegetation index), EVI
(Enhanced vegetation index), VCI (Vegetation condition index) etc.
Greenindexnumbering(GNI)approach–GNIis an estimate of percentage of pixels
having GNI value high enough to indicate good vegetation vigour. If GNI is much
below the normal/predetermined value drought is indicated.
Using RSthermalindex–Canopy temperature indicates water stress. TIR data,
canopy temp based indices difference (RS derived) like SDD (Stress degree day),
CWSI (Crop water stress index vegetation index) can be used
NOAA, MODIS (low spatial resolution) – depict broad scale status
IRS- LISS II, LISS III, Landsat- TM (high spatial resol.) – detail information of area
Crop condition Assessment &Drought monitoring
M KNanda
BCKV
Rainfall
Aridity Index
Crop Calendar
Current V.I.
Historical V. I.
Land use
Geographic Information
System
Decision SupportSystem
DroughtAssessment Map
Ground System
Agricultural Drought Mitigation- Modelframework
Satellite System
M KNanda
BCKV
SDD = ∑ (Tc– Ta)i
TCI =
100* (BTmax BT)
(BTmax BTmin)
Max = Maximum (From historical record)
Tc = Canopy temperature
Ta = Airtemperature
i = Day
C1, C2 = Coefficients (Aerosol resistanceterm)
BT = Brightnesstemperature
NIR Red
NDVI =
NIR + Red
NIR Red
EVI = 2.5 x
NIR – C1*Red – C2*Blue +L
(NDVIj – NDVImin) *100
VCI =
NDVImax NDVImin
j = Week/Month under comparison
Min = Minimum (From historical record)
Drought monitoring –Indicesused
VHI = 0.5(VCI) + 0.5(TCI)
M KNanda
BCKV
June 07 July 07 August 07
AVHRRcomposite NDVIforstudying vegetation vigour
M KNanda
BCKV
Drought monitoring of West Bengal–Case study
Purulia Bankura Birbhum Midnapore Jalpaiguri Coochbehar
2008 -0.02 14.07 4.66 -12.08 14.66 0.61
2009 4.03 10.77 -4.82 -14.16 -15.79 -35.33
2010 -37.96 -39.52 -33.92 -1.57 23.27 2.94
2011 16.62 16.60 7.09 0.87 -3.46 -3.39
2012 12.33 4.33 -23.04 6.29 6.69 -2.43
Seasonal Departure (%) of rainfall from normal
Vegetation Condition Index from MODIS data analysis
M. K. Nanda (unpublishedwork) M KNanda
BCKV
M K Nanda
BCKV
Thank You
for patient listening……..
 Selection and preparation of the image data.
 Definition of the clusters (class) in the feature
space.
 Selection of classification algorithm
 Running the actual classification
 Validation of the result (groundtruth).
Steps of Image Classification
M KNanda
BCKV
RS Data
Training
Data
Training
selection
algorithm
Running
Classification
Running
Classification
Ground
Truth
Final Classified
Image
Supervised /
Unsupervised
Supervised and unsupervised classification

RS_GIS_Crop_monitoring-converted.pptx

  • 1.
    Application of RemoteSensing in Crop Monitoring Prof. M. K. Nanda Deptt. of Agril. Meteorology & Physics BCKV, Mohanpur, Nadia, WB Email: mknandabckv@rediffmail.com
  • 2.
    Whatis Geoinformatics? Geoinformatics isthe science and technology dealing with the structure and character of spatial information, its capture, its analysis and, its storage, processing, portrayal and dissemination, including the infrastructure necessary to secure optimal use of this information. Geoinformatics combines geospatial analysis and modeling, development of geospatial databases, information systems design, humancomputer interaction and both wired and wireless networking technologies. M KNanda BCKV
  • 3.
    Componentsof Geoinformatics Geoinformation combinesdifferent types of dataset, from GIS, remote sensing and non-remote sensing, and socio-economic to generated results in form of maps or other forms of reports for interpretation, management and decision making in different fields. Three major components: Geographic Information Systems (GIS), Global Positioning Systems (GPS), and Remote Sensing (RS). M KNanda BCKV
  • 4.
    Whatis RemoteSensing (RS)? WhatisGeographicalInformation system(GIS) ? and Whatis GlobalPositioningSystem (GPS)? M KNanda BCKV
  • 5.
    Remote Sensing –AnObservationTool Incidence Reflection Emission Ground station User Cloudatmospheric particles Scattering, Absorption, Reflection M KNanda BCKV
  • 6.
    "If you can'texplain it to a six year old, you don't understand it yourself." Albert Einstein
  • 7.
    Howdoes Remote sensingwork? Incident radiation Reflected radiation ObjectPlatform & Processor Colour Composite for Visual Interpretation Source Signal Sensor M KNanda BCKV
  • 8.
    Basic concept ofRadiation : Spectral Distribution Wavelength (m) Wavelength (nm)  Any object at a temp above 0 K emits electromagnetic radiation.  Wavelength of radiation is determined by the temperature of thesurface object  Amount of radiation depends surfacetemperature and emissivity  Lot of information may be obtained beyond the visible domain  …..but wehaveto workwithin atmospheric window M KNanda BCKV
  • 9.
    Sensors : Passive&Active Passive sensor uses natural radiation (reflected or emitted) Active sensor uses artificial source of radiation M KNanda BCKV
  • 10.
    Static platforms : Multispectralsensor mounted to a pole / Handheld Spectrometer,IR thermometer Occasionally used in experiments Moving platforms : Airborne : Aircraft, Ultra Light Vehicles (ULVs), balloons, Airship or kites are used asplatform. Range from 100 m up to 30–40 km height. Generally carries Aerial camera, Laser Spaceborne: Satellite – Low height (Shuttleorbit), Sun synchronous (Polar), Geostationary (equatorial). Range from 150–36,000 km height. Mounted with multispectral scanner Platforms M KNanda BCKV
  • 11.
    First Arial Photograph(1859) M KNanda BCKV
  • 12.
  • 13.
    WhyRemote Sensing isrequired in Cropmonitoring? • Pressure for high production • Declining natural resources – water, soil productivity….. • Climate change issue • Market demand • Geographically diverse situation demands differential approach (Spatial decision making) M KNanda BCKV
  • 14.
    Cost effectiveness Though establishmentcost is high, the maintenance cost very low as compared to other means Timeliness Real time Information collection and processing - faster than any other system Unbiasedinformationgeneration As the informations are collected and processed mechanically the human bias is avoided Monitoring inaccessibleareas Difficult/Inaccessible areas like deep forest, ocean, mountain peaks are being monitored Sensing typicalfeatures Human vision (or other sensing organs) is sensitive in visible radiation. But lot of informations can be generated from the infrared, microwave, radio wave signals Advantages of Remote sensing M KNanda BCKV
  • 15.
    Canthe complexplantandsoilprocesses beexplainedbyRemoteSensing? And…..how far? How? Remote Sensing is based on radiative exchange • Resolution varies from 1 m(more than a crop canopy) to >1 km (more than a fieldunit) Spatial • Hyper spectral to Panchromatic Spectral • Varies widely Radiometric • 1 hour (Geostationary) to 20 days • Usual y hightemporal data have poor spatialresolution Temporal M KNanda BCKV
  • 16.
    How does RemoteSensing differentiate features? Concept of Spectral Signature and VegetationIndex M KNanda BCKV
  • 17.
    visible and infra-redrange Figure . Spectral reflectance signature of different targets including (1) cloud, (2) snow, (3) vegetation, (4) soil and (5) water along with location of IRSP3 MOSA, B & C sensor channels (Courtesy; DLR,Germany). Spectral signature M KNanda BCKV
  • 18.
  • 19.
    Concept of VegetationIndex  Some algebric combination of remotely sensed spectral bands can tell something important about vegetation (Jordan, 1969; Pearson and Miller, 1972) Ratio VegetationIndex ρNIR RVI = ρred Range = 0 toinfinite Normalized Difference Vegetation Index (Kriegler, 1969; Rouse et al.,1973) ρNIR ρred NDVI = Range = 1 to +1 ρNIR+ ρred Difference Vegetation Index (Richardson and Everitt(1992) DVI = ρNIR ρred Soil Adjusted Vegetation Index (Huete, 1988) M KNanda BCKV ρNIR ρred SAVI = x (1 + L) ρNIR+ ρred +L Range = 1 to+1
  • 20.
    WorkingwithRemote Sensing Acquiring image (Reflectance/ Radiance) Storing/ Transmssion (DNin diff bands) Visualization/Colour composite (Digital no. in diff bands) Single band (Monochromatic) Multi spectral Geometric correction Atmospheric correction Radiometric correction Satellite System (Image acquiring) Software system Image Processing True Colour composite False Colour composite Interpretation Visual Digital Beforestart, Let’sknowtheDataStructureof Remote Sensing
  • 21.
    M KNanda The basicunderstanding : Data Structure,Colour Composit & Visualization RedGreenBlue True (Natural) colour composite BCK V False colour composite (FCC)
  • 22.
    M KNanda GIS–ASpatial Analysis&Decision Making Tool Model Application by GIS Grid Cells Model Initialization Model Driver s GIS – A computerised storage, processing and retrieval systems that have hardware and software specially designed to cope with geographically referenced spatial data and corresponding information attribute. Thematic Maps of • Crop Yields • Water stress •Nutrient Stress Charts & Graphs Model Output Operational Information Weather Crop Soil Information layers BCK V Functionalit y Satellite Image
  • 23.
    What is GIS • • GISystems– A computerized tool that helps solve geographic problems. • GIScience – A scientific approach to the fundamental issues arising from geographic information. GIStudies – the systematic study of society’s use of geographic information, including institutional, organizational and procedural issues. • GIServices – The business of providing GIS data and analysis tools to GIS users. (derived from Longley, e al, 2001) GISytems, GIScience, GIStudies, and GIServices
  • 24.
    Defining GIS Burrough (1986): GISis ‘a set of tools for collecting, storing, retrieving at will, transforming, and displaying spatial data from the real world for a particular set of purposes’, The components of a GIS include: • the computer system (hardware and operating system), • the software, • the spatial data, • data management and analysis proceduresand • the people to operate the GIS.
  • 25.
    Desirable capabilities of‘well-designed GIS’ a) Quick and easy access to large volumes of data. b) The ability to: • select detail by area or theme; • link or merge one data set with another; • analyze spatial characteristics of data; • search for particular characteristics or features in an area; • update data quickly and cheaply; and • model data and assess alternatives. c) Output capabilities (maps, graphs, address lists and summary statistics) tailored to meet particular needs.
  • 26.
    Some important areasof application of GIS • Different Streams of Planning: Urban planning, housing, transportation planning architectural conservation, urban design, landscape planning etc. • Street Network Based Application: It is an addressed matched application, vehicle routing and scheduling: location, development andsite selection and disaster planning. • Natural Resource Based Application: Management and environmental impact analysis of wild and scenic recreational resources, flood plain, wetlands, acquifers, forests, and wildlife. • View Shed Analysis: Hazardous or toxic factories siting and ground water modelling. Wildlife habitat study and migrational route planning. • Land Parcel Based: Zoning, sub-division plans review, land acquisition, environment impact analysis, nature quality management and maintenance etc. • Facilities Management: Can locate underground pipes and cables for maintenance, planning, tracking energy use.
  • 27.
    Data Structure in GIS Datavs information • Data : representations that can be operated upon by a computer • Information: data that has been interpreted by a human being. Spatial data • Spatial data : data that contains positional values. • Geospatial data : spatial data that referenced to geographic position Spatial data that is not georeferenced can have positional data unrelated to the Earth’s surface. Examples - position of atoms in molecules in molecular chemistry, condition of internal organs in medical science
  • 28.
    Data Structure Based onsource data can be • Primary data : collected through first-hand observation. • Secondary data : collected by another individual or organization, for example consumer surveys of customers buying ski equipment. Data have three modes or dimensions • Temporal – Date & time of occurrence; • Thematic – Intensity, wind speed, amount of loss occurred etc. and • Spatial – Where it was originated, where exactly it hit the landmass (w.r.t. latitude & longitude)
  • 29.
    Data Models in GIS VectorData Model • Vector data model represents objects by defining the location of their boundaries of real-world objects using 2D geometric types: point, line, or polygon and a real-world coordinate system. Raster data model • Array of cells, or pixels to define grids and encodes the grid cells based on objects in the cell. Data (cells containing values that measure the presence/ absence/strength of some field or phenomena) are stored as an array of grid values, with metadata held in a fileheader. Attribute model • Associating/manipulating the properties (features) of objects or cells For a polygon map of water bodies the features like area of water body, depth of water, salt content of water etc are stored in attribute model associated with the vector map
  • 30.
    Vector Data Model: Topological features Topology deals with spatial properties that do not change under certain transformations. A simple example will illustrate what we mean. Advantages of arc-node structure over simplefeatures Assume you have some features drawn on a sheet of rubber. Stretch the sheet to different forms, do not tear it. The features will change in shape and size. Some properties, however, do not change: • area E is still inside areaD, • the neighbourhood relationships between A, B, C, D, and E stay intact, and their boundaries have the same start and end nodes, and • the areas are still bounded by the same boundaries, only the shapes and lengths of their perimetry have changed.
  • 31.
    Map concept: Featuresand Properties A map represents geographic features or other spatial phenomena by graphically conveying information about locations andattributes. Locational information : position of particular geographic features on the Earth’s surface, as well as the spatial relationship between features Attribute information : characteristics of the geographic features represented, eg. feature type, name or number and quantitative information area or length etc. Thus the basic objective of mapping is to provide • Descriptions of geographic phenomenon • Spatial and non spatialinformation • Map features like Point, Line, & Polygon Soil Map of Bhabanipur village
  • 32.
    Map concept: Characteristicsof a map Map Features: point features - wells and schools, traffic posts lines for features - streams, roads and contour lines areas for features(polygons) lakes, cultivated lands Scale in Digital Maps: Digital maps do not remain fixed in size. They can be displayed or plotted at any possible magnification. In digital mapping, theterm scale is used to indicate the scale of the materials from which the map was made. Map Resolution: how accurately the location and shape of map features can be depicted for a given map scale. Scale affects resolution. Larger-scale map are of high resolution. As map scale decrease, the map resolution diminishes because features must be smoothed and simplified, or not shown at all. Map Accuracy: how accurately features can be depicted. It includes the quality of source data, the map scale and draftsman skills Map Extent: the area on the Earth’s surface represented on the map. The smaller the scale the larger the area covered. Database Extent: database is the limit of the area of interest for the GIS project. Data Automation: Logical organizing of map features and sequencing. Map data are collected, automated and updated as series of adjacent map sheets. Attributes are associated with features. Layer are edge matched and joined into a single coverage for our study area as per requirement.
  • 33.
    Map Projections &Coordinate System Spatial Reference = Datum + Projection + Coordinate system Geodesy - the shape of the earth and definition of earth datums Map Projection - the transformation of a curved earth to a flat map Coordinate systems - (x,y,z) coordinate systems for map data Types of Coordinate Systems • (1) Global Cartesian coordinates (x,y,z) for the whole earth • (2) Geographic coordinates (φ, λ,z) • (3) Projected coordinates (x, y, z) on a local area of the earth’s surface
  • 34.
    Shape of the earth •When specifying location we need to use a model to describe the shape of the Earth. • At small scales, the Earth may be assumed to be round (i.e. a sphere). • At larger scales, we need to model the Earth as an ellipsoid (an oblate spheroid) . • Ellipticity f (or ‘flattening’) is defined as (a-b)/a, where a is the semi-major axis • Ealnlidptbiciistythfe ( o s r e ‘ fl m a i t - t m e n i n i n o g r’a)xisisd.efined as (a- b)/a, where a is the semi-major axis and b is the semi-minor axis. • The ellipticity of the Earth is estimated by the World Geodetic System 1984 (WGS84) as 0.003353 – i.e. it is almost a sphere. Other ellipsoids with slightly different estimates are used by different mapping agencies. • The ellipsoid used should be defined as part of the datum.
  • 35.
    Standard ellipsoid For theearth: • Major axis, a = 6378 km, Minor axis, b = 6357 km, • Flattening ratio, f = (a-b)/a = 1/300(approx) Standard Ellipsoids Horizontal EarthDatums An earth datum is defined by an ellipse and an axis of rotation NAD27 (NorthAmerican Datum of 1927) uses the Clarke (1866) ellipsoid on a non geocentric axis of rotation NAD83 (NAD,1983) uses the GRS80 ellipsoid on a geocentric axis of rotation WGS84(World Geodetic System of 1984) uses GRS80, almost the same as NAD83 Ellipsoid Major axis, a (m) Minor axis, b (m) Flattening ratio, f Clarke(1866) 6,378,206 6,356,584 1/294.98 GRS80 6,378,137 6,356,752 1/298.57
  • 36.
    The Geoid • An ellipsoidmay not be sufficiently accurate for detailed measurements at large scale. • The Earth is actually slightly ‘pear-shaped’. • It also has ‘bumps’ and‘hollows’ (ignoring terrain). • For geodetic measurements, thegeoid is used. • This is defined as the ‘equipotential surface that most closelycorresponds to mean sea level’. • Mean sea level varies from place to place, so different mappingagencies use slightly differentgeoids.
  • 37.
    Geographic Coordinate System • Treatingthe Earth as a sphere, the traditional approach is to use spherical coordinates or geographical coordinates. • These express location in termsof latitude and longitude. • Latitude is the angle at the centre of the earth between the point of interest and theequator. • Longitude  is the angle at the centre of the Earth between the point of interest and the prime meridian (i.e. the line running from pole to pole through Greenwich). • By convention the latitude of a place in the northern hemisphere is positive, andin the southern hemisphere it is negative. • Places east of Greenwich have a positive longitude, places west have a negative longitude.
  • 38.
    Global Cartesian Coordinate System •Used by satellite systems. • Here a point is defined in the x-y-z space • Treating the centre of the spheroid as the origin, the Z-axis is aligned with the minor axis of the ellipsoid (i.e. through the north pole), and the X and Y axes lie on the equatorial plane. The X- axis intersects the equator at the prime meridian, and the Y axes is at right angles to it. • Any point in 3-D space can be expressed relative to the 3 axes.
  • 39.
    Planar (Projected) Coordinate System •Two dimensional Cartesian coordinates are normally used for projected maps. • The X corodinate measures distance in an east-west direction, and the Y coordinate measures it in a north-south direction. • The true origin is at the centre of the map, but because negative values are unwieldy, a false origin is usually defined to produce positivevalues. • The location of the false origin (i.e. offset) and type of projection should be specified in the datum.
  • 40.
    • • Global PositioningSystem (GPS) provides accurate, continuous, worldwide, threedimensional position and velocity information to users with the appropriate receiving equipment. GPS disseminates a form of Coordinated Universal Time (UTC). The satellite constellation nominally consists of 24 satellites arranged in 6 orbital planes with 4 satellites per plane. GPS can provide service to an unlimited number of users since the user receivers operate passively (i.e., receive only). The system utilizes the concept of oneway time of arrival (TOA) ranging and determines the coordinates through triangulation. GPS- ANavigationTool M KNanda BCKV
  • 41.
    We understand ourresources are limited, but enough to start with........ Working with RS and GIS M KNanda BCKV
  • 42.
    Crop cultivation and harvesting •Land preparation • Sowing • Input management • Water management • Fertilization • Pest management Post harvest • Marketing • Transportation • Packaging • Storage • Food processing Precultivation • Crop selection • Land selection • Calendar definition • Access to credit Information for the selection of thebest crop according to their land, access to input and credit, market (Cost-Benefit), etc. Information for the sound management of thewhole cropping activities, including the resilience to natural (e.g. weather) and anthropogenic shocks Information related to post-harvest and tools, marketing & transportation infrastructures, etc. Information need at different phases of agriculture M KNanda BCKV
  • 43.
    WorkingwithRemote Sensing :Basic Requirements Hardware Standard Desktop computer / Laptop. Internet facility to access imageries Software Commercial/Edu. version : ArcGIS, ERDAS Imagine, ENVI, IGIS, Gieomatica etc. Open Source : ILWIS, GRASS, SPRING etc. (Freely downloadable from internet) All the softwares are having user friendly tutorial Data Free data: INSATimage (1 km resolution with hourly periodicity) from MOSDAC server of ISRO MODIS image (1 km and 250 m resolution at daily or composite) from Reverb Echo site Landsat image (30 m resolution) from USGS site SPOT vegetation Paid data: LISS III (23 m) or LISSIV etc. to IKONOS, Cartosat etc. M KNanda BCKV
  • 44.
    WorkingwithGIS: Howto start • • • ScanToposheet/ map output as jpg or –tiff format Import jpg or tiff file to your software Make georeferencing Assigning latitude/longitude values (for >4 points) to raster layer & Get your base mapready Dig r e it s i a za m t p io lin n g • • Digitize the features Polygons, Lines or Points on the georeferenced raster layer Different features are saved as several layers Adding attributes • Tag the attribute layers to the respective vector layers with reference column like Field Id for individual polygon in a polygon layer • You can add one or more fields or parameters to the existing attribute M KNanda BCKV Field Id Owner’s name Area Cropping system Irrigation regime N- status P- status K- status 1 Xxx R-M 2 Yyy J-V-R 3 Zzz
  • 45.
    WorkingwithGIS: Gettingoutput Field IdOwner’s name Area Crop Prekharif Crop kharif Crop rabi Irrig. regime N- statu s P- statu s K- statu s 1 Xxx * Jute vegetabl e Potato 2 H L H 2 Yyy * No Rice Mustard 1 M L H 3 Zzz * No Rice No 0 L L L M KNanda BCKV *Area, distance etc will be computed automatically during digitization Put your query (like given examples) • ExAreas under Jute based cropping system, • Fertility status map (Interpolating if required, done by Digital Elevation Model in GIS) • List of farmers having 300% cropping system.....................etc, Get your output • In form of map, table etc in printable format as per the query
  • 46.
    WorkingwithRemote Sensing :Howtostart Import Image to your software Original image is in geotiff format (a generic format read by all softwares) The S/W imports the file to its own workable format (like img for ERDAS, hdr for ENVI etc.) Image correction/preprocessing Geometric correction for high resolution images (30 m or less) Accurate matching of image point with surface point Radiometric correction compensating for atmospheric effect or data error due to sensor failure Image Enhancement Contrast enhancement (Stretching) Stretching the range of DN values over the whole range of visualization Spatial enhancement (Filtering) Modification of an image pixel value, based on the pixel values in its immediate vicinity (local enhancement). You can start with RS data products like NDVI, LST, LAI etc. These require minimum processing M KNanda BCKV
  • 47.
    WorkingwithRemote Sensing :Howtostart Digital analysis Semiautomatic processing by the computer. Examples include automatic generation of DTMs, image classification and calculation of surface parameters. Visual Interpretation Information extraction based on visual analysis or interpretation of the data. The prerequisite of visual image interpretation is to develop colour composite. The colour composite may be – True colour composite – Natural colour composite where blue, green and red bands are used as it is. It looks like real life photograph. Example – Google earth image False colour composite (FCC) – Here the basic colours (blue, green and red ) are assigned to different bands. The conventional FCC is developed by assigning the red colour to NIR band, green to red band and blue to green band. This makes the land surface features more distinguishable. In FCC vegetation looks red, deep water body looks blue, wetland looks dark, shallow waterbody looks black. barren land looks grey to white. Buildup area looks cyan Visual interpretation is used for mapping land use or soil. urban areas,, geomorphology, forest and, natural vegetation etc. M KNanda BCKV
  • 48.
    Agro-ecological Zonation –Flowchat TopographyMet data Satellite images Agroclimatic/ Agroecological zone Digital Classification/ Visual interpretation Watershed delineation (contour, slope etc.) Ground observation Training sites • Soil Type • Irrigation regime • Cropping system • Historical crop productivity • Land use map • Water regime map • Soil map for the whole study region Interpolation in GIS • Weather maps • Isolines Digital Elevation Model (DEM) in GIS • Temperature • Rainfall (amount, distribution) • Survey of India Toposheet • IRS1B •LISSI, LISSII (or other source) Inpu t After Saha & Pande (1996) Asian Pacific remote Sensing Journal , 5(2):21 28. M KNanda BCKV Processing Produc t
  • 49.
    Agro-ecological Zones ofDoon Valley Saha & Pande (1996) Asian Pacific remote Sensing Journal , 5(2):21 28. M KNanda BCKV
  • 50.
    Agro-ecological Zones ofDoon Valley Saha & Pande (1996) Asian Pacific remote Sensing Journal , 5(2):21 28. M KNanda BCKV
  • 51.
    How Remote Sensingis applied in Crop monitoring? Let’s see some examples M KNanda BCKV
  • 52.
    • Studyingagro-climaticpotential Soil resourceinventory, climatic study, ecological zonation, Land evaluation and land use planning etc. • Crop inventory Crop acerage estimation, production forecasting, Carbon exchange, evapotranspiration, Stress monitoring and forewarning- moisture stress, nutrient stress Disease pest, etc. • Disaster management (contingent planning) Flood, drought, Crop loss estimates etc. Basic areas of application M KNanda BCKV
  • 53.
    • Crop acreageand production estimation • Crop condition assessment (waterstress, nutrient stress, disease pest monitoring etc) • Evapotranspirationandwaterbudgeting • Agricultural drought monitoring Crop Inventory M KNanda BCKV
  • 54.
    CAPE–Programme sponsored byministry of Agriculture for estimation of large area crop acreage and yieldwheat, rice, cotton, groundnut, mustard FASAL Forecasting Agricultural output using Space, Agro meteorological and Land based observations Crop discrimination&acreage– • Satellite data + sample survey • Using multi dated satellite data • Multispatial resolution satellitedata Crop yieldprediction – • Spectral yield model • Integrated yield (Agroclimatic, soil edhapic, management practice +RS derived vegetation index) model • Temporal crop growthapproach • Biophysical simulationmodel Crop acreage &production estimation (CAPE) M KNanda BCKV
  • 55.
    Crop acreage estimationBasic Principles Historical data InseasonR.S. Imageries (Multidated) Ground Truthdata Image Classification Class Proportion Enumeration Acreage Training Signature Generation M KNanda BCKV
  • 56.
    Fig . Changein wheat growingarea in Western M. P. as seen usingAWiFSdata Navalgund et al., 2007 : Current Science, 93(12) Crop acreagefrom multi-dated imagery - Case study M KNanda BCKV
  • 57.
    • FCC (Kharif,2006) Land use classification • FCC (Kharif, 2007) Land use classification Fig Kharif crop area changes in parts of Jalore dist, Rajasthan (200607 to200708) Jha and M.S.R Murthy, National Remote Sensing Centre ISRO - Contribution to INCCA Crop acreagefrom multi-dated imagery - Case study M KNanda BCKV
  • 58.
    Crop acreagefrom multi-datedimagery - Case study Fig M KNanda BCKV Multitemporal observations over agricultural region showingdifferent growing pattern of wheat and mustard crops Navalgund et al., 2007 : Current Science, 93(12)
  • 59.
    Land Use Mapfrom Remote Sensing image Study Area : Coastal Blocks of 24 Pg (S) Dist, WB Image used LANDSATTM4 Technique supervised classification M KNanda BCKV M K Debnath, M K Nanda and D Majumder (Ph.D. Thesis work)
  • 60.
    Crop production estimation– The simple rule • Select relevant crop stage and parameter that is correlated to crop yield (Define the empirical relation) • Find relationship between vegetation index (from images) and the specific crop yield attributing parameter (Define the empirical relation) • Derive the agroclimatic yield index using soil and meteorological data • Accuracy assessment of yield estimation M KNanda BCKV
  • 61.
    Crop yield estimationusing Biophysical Simulation Model - Model Framework Crop file Weather file Soil file Yield prediction Crop Model (WOFOST, InfoCrop etc.) Potential Yield for the specific location Inseason RS Forcing M KNanda BCKV
  • 62.
    Relationship between ricegrowth parameters and yield based on field observations M KNanda BCKV Crop production estimation - Example Rice greenness Minolta SPAD-502 leaf chlorophyll meter Relationship between plant height at 63 d and yield Relationship between plant height x leaf greenness at 63 d and crop yieldof Relationship between rice leaf greenness at63 d and yield
  • 63.
    Rice yield asa function of NDVI at 63 days M KNanda Crop production estimation - Example Statistical Test for accuracy of yield prediction BCK V Nuarsa et al., 2012, Journal of Agricultural Science Vol. 4, No. 3; 2012
  • 64.
    Crop acerage &productivityestimation –Case study Haryana State Remote Sensing Application Centre (HARSAC) M KNanda BCKV Hooda, et al. (2008), ISPRS Archives XXXVI8/W48 Workshop proceedings: Remote sensing support to crop yield forecast and area estimates
  • 65.
    Wheat acreage andproductionestimation Haryana State Haryana State Remote Sensing Application Centre (HARSAC) Districtwise estimate of 2004 Estimate over the years M KNanda BCKV
  • 66.
    3.51 4.75 t/ha Gridwise simulated wheat yield for Haryana for 199697 Data : maps WiFS RS data + weather & other Model: WTGROWS inGIS Sehegal et al, 2001 Proc. IRS NationalSymposium Crop yield estimation using Biophysical Simulation Model - Case Study M KNanda BCKV
  • 67.
    Remote sensors onboard system Changesin spectral response Crop damage Insect/pest/ disease infestation Moisture stress Nutritional stress/Salt stress/ physiological disorder Change incanopy geometry/ leaf area Change in pigment composition Change in leaf moisture content Change in canopy temp. Stress Effect Sensing Principles of RSapplication in stress monitoring M KNanda BCKV
  • 68.
    In both visiblerange (500 to 700 nm) and NIR range PLB infected plants have low reflectance Project Area : Field survey in potato growing areas of WB Detection of aphid andabiotic stress 348 425 501 575 646 715 781 844 902 957 1088 1276 1460 1639 1811 1960 2094 2222 2345 2461 M KNanda BCKV 140 120 100 80 60 40 20 0 D Dutta, M K Nanda and R P Kundu (Unpublished work)
  • 69.
    PRI– Photochemical Reflectance Index R531R570 =R531+R570 DI– Disease Index (Field measured) of wheat yellow rust Huang et al. (2011) Remote Sensing – Applications Yellow rustof wheat- Case study M KNanda BCKV
  • 70.
    Visualanalysis of FCC–By evaluating ‘redness’ tone of FCCs between drought year and immediate previous normal year aerial extent of drought can be evaluated Using Spectralvegetationindex–NDVI(Normalized difference vegetation index), EVI (Enhanced vegetation index), VCI (Vegetation condition index) etc. Greenindexnumbering(GNI)approach–GNIis an estimate of percentage of pixels having GNI value high enough to indicate good vegetation vigour. If GNI is much below the normal/predetermined value drought is indicated. Using RSthermalindex–Canopy temperature indicates water stress. TIR data, canopy temp based indices difference (RS derived) like SDD (Stress degree day), CWSI (Crop water stress index vegetation index) can be used NOAA, MODIS (low spatial resolution) – depict broad scale status IRS- LISS II, LISS III, Landsat- TM (high spatial resol.) – detail information of area Crop condition Assessment &Drought monitoring M KNanda BCKV
  • 71.
    Rainfall Aridity Index Crop Calendar CurrentV.I. Historical V. I. Land use Geographic Information System Decision SupportSystem DroughtAssessment Map Ground System Agricultural Drought Mitigation- Modelframework Satellite System M KNanda BCKV
  • 72.
    SDD = ∑(Tc– Ta)i TCI = 100* (BTmax BT) (BTmax BTmin) Max = Maximum (From historical record) Tc = Canopy temperature Ta = Airtemperature i = Day C1, C2 = Coefficients (Aerosol resistanceterm) BT = Brightnesstemperature NIR Red NDVI = NIR + Red NIR Red EVI = 2.5 x NIR – C1*Red – C2*Blue +L (NDVIj – NDVImin) *100 VCI = NDVImax NDVImin j = Week/Month under comparison Min = Minimum (From historical record) Drought monitoring –Indicesused VHI = 0.5(VCI) + 0.5(TCI) M KNanda BCKV
  • 73.
    June 07 July07 August 07 AVHRRcomposite NDVIforstudying vegetation vigour M KNanda BCKV
  • 74.
    Drought monitoring ofWest Bengal–Case study Purulia Bankura Birbhum Midnapore Jalpaiguri Coochbehar 2008 -0.02 14.07 4.66 -12.08 14.66 0.61 2009 4.03 10.77 -4.82 -14.16 -15.79 -35.33 2010 -37.96 -39.52 -33.92 -1.57 23.27 2.94 2011 16.62 16.60 7.09 0.87 -3.46 -3.39 2012 12.33 4.33 -23.04 6.29 6.69 -2.43 Seasonal Departure (%) of rainfall from normal Vegetation Condition Index from MODIS data analysis M. K. Nanda (unpublishedwork) M KNanda BCKV
  • 75.
    M K Nanda BCKV ThankYou for patient listening……..
  • 76.
     Selection andpreparation of the image data.  Definition of the clusters (class) in the feature space.  Selection of classification algorithm  Running the actual classification  Validation of the result (groundtruth). Steps of Image Classification M KNanda BCKV RS Data Training Data Training selection algorithm Running Classification Running Classification Ground Truth Final Classified Image Supervised / Unsupervised Supervised and unsupervised classification