Daily Forex Technical Analysis Report - July 15, 2020
Technical Analysis Research Report English
1. 1
Date : 23rd
December 2015
Instruments : 1. EUR/USD
2. WTI Crude
3. Hong Kong Index (HSI)
Written by : Alan Yeo
--------------------------------------------------------------------------------------------------------------------------------------
EUR/USD
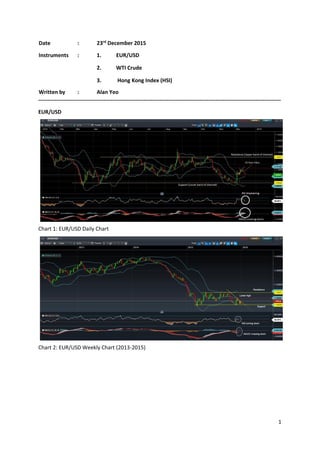
Chart 1: EUR/USD Daily Chart
Chart 2: EUR/USD Weekly Chart (2013-2015)
2. 2
Chart 3: EUR/USD Weekly Chart
Further Weakness!
On the daily chart, we can see that the pair has been trading within a band of 1.05649-1.14417. In the
beginning of the week, in anticipation of a rate hike decision by the FED midweek, price started to fall
and the selling momentum strengthened upon the confirmation of the hike. The US FED increased
interest rates by 25 basis points, its first increase since 2006. This is mostly in-line with market
expectations. The rate hike signals faith that the US economy has recovered from the Global Financial
Crisis in 2008. However, Miss Yellen thinks that future rate hikes are unlikely to be evenly spaced,
because she thinks the US economy will not progress "sufficiently evenly" to make that possible. This
comment signals that the next rate hike may not come as fast as it used to be, as such, the strength of
the USD may not rise steadily as anticipated, pending more data on the US economic front. On top of
that, the global economy has not been all rosy with growth in the Asian region slowing down
significantly and oil prices near their 10 years low. However, market participants are anticipating the
next hike to be in April 2016.
On the weekly chart, it shows a consolidation phase at this moment of time. It seems that the pair has
hit a resistant at the 20 days EMA line (1.10482) on the weekly chart. Going forward, the technical
indicators are showing signs of weakness with RSI at 44.27% and MACD turning down. As such, traders
may look at taking a long position only at around the level of 1.055-1.06, which happens to be the
support and the lower band of the Bollinger bands.
On the daily chart, selling momentum is gaining steam and trending towards the 20 days EMA; most
likely heading towards the lower band of the Bollinger bands. Both MACD and RSI have turned down
3. 3
and this present us with a trading opportunity. Traders with a shorter term view may want to initiate
a short position; selling into the decline and look to buy back at around the level of 1.055-1.06. Stop
loss can be place at the 20-days EMA of 1.105.
ACTION:
Sell 1.08424 and cover at 1.055 => 2.7%
Stop at 1.105 => -1.9%
4. 4
WTI Crude
Chart 4: WTI Crude Daily Chart
Chart 5: WTI Crude Weekly Chart
FALLING KNIFE!
At the recent OPEC meeting, the oil cartel has reaffirmed that there will be no cut in supply so as to
defend their market share. Extra Iranian production could add to the surplus and causes the stockpile
to rise further. A rebound to start this week fizzled after just two sessions after The U.S. Energy
Information Energy reported Wednesday that domestic oil inventories rose by 4.8 million barrels last
week, adding to the oil glut and taking the market by surprise as analysts had been expecting a
decrease. With the global economy facing a slowdown, demand for the commodity is not expected to
improve anytime soon.
5. 5
On the technical front, both the daily and weekly chart showed further weakness in the price of oil.
Previous support (low) at 37.705 was broken and as a result, has become the near term resistant.
MACD on the daily chart is poised to go down further after a failed cross and RSI remained in the
oversold territory. The weekly chart confirms the bearish view on the daily chart after breaking the
support of a descending triangle signalling more downside in the sessions ahead.
In view of the above, traders may want to initiate short positions at the current level and a stop-loss
placed at 35.95 and to take profit at 33.
ACTION:
Sell 34.717 and cover at 33 => 5%
Stop at 35.95 => -3.6%
6. 6
Hong Kong 43 Index
Chart 6: Hong Kong 43 Index Daily Chart
Chart 7: Hong Kong 43 Index Weekly Chart
No year-end rally; possibly going down before going up!
The HK 43 Index looks poised to go down further on both the daily and weekly charts. Since the end of
May, the index has started trading down a channel consistently. In the last few sessions, the index
staged a technical rebound and tested the 20-days EMA but failed to cross it convincingly and started
to pull back down the channel again. RSI and MACD are showing signs of turning down on the daily
chart. RSI is at 43.86% which is still way above the oversold territory. The bearish signals on the daily
7. 7
chart is substantiated by similar bearish signals on the weekly chart. The index seems to be heading
towards the support of 20,100 in the near term.
ACTION:
Sell 21,800 and cover at 20,100 => 7.8%
Stop at 22,245 => -2%
Disclaimer: The material in this presentation has been prepared by Alan Yeo and is general background
information about Alan Yeo’s activities current as at the date of this presentation. This information is
given in summary form and does not purport to be complete. Information in this presentation,
including forecast financial information, should not be considered as advice or a recommendation to
investors or potential investors in relation to holding, purchasing or selling securities or other financial
products or instruments and does not take into account your particular investment objectives, financial
situation or needs. Before acting on any information you should consider the appropriateness of the
information having regard to these matters, any relevant offer document and in particular, you should
seek independent financial advice. All securities and financial product or instrument transactions
involve risks, which include (among others) the risk of adverse or unanticipated market, financial or
political developments and, in international transactions, currency risk. This presentation may contain
forward looking statements including statements regarding my intent, belief or current expectations
with respect to market conditions, results of operation and financial condition, capital adequacy,
specific provisions and risk management practices. Readers are cautioned not to place undue reliance
on these forward looking statements. Alan Yeo does not undertake any obligation to publicly release
the result of any revisions to these forward looking statements to reflect events or circumstances after
the date hereof to reflect the occurrence of unanticipated events. While due care has been used in the
preparation of forecast information, actual results may vary in a materially positive or negative manner.
Forecasts and hypothetical examples are subject to uncertainty and contingencies outside Alan Yeo’s
control. Past performance is not a reliable indication of future performance.