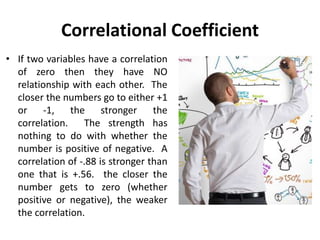
Correlational Research
Research Methodology
Prepared By
Kindly restrict the use of slides for personal purpose.
Please seek permission to reproduce the same in public forms and presentations.
Manu Melwin Joy
Assistant Professor
Ilahia School of Management Studies
Kerala, India.
Phone – 9744551114
Mail – manu_melwinjoy@yahoo.com
Correlational Research
• A correlation is simply
defined as a relationship
between two variables.
The whole purpose of
using correlations in
research is to figure out
which variables are
connected.
Correlational Research
• This simple definition is
the basis of several
statistical tests that result
in a correlation
coefficient, defined as a
numerical representation
of the strength and
direction of a relationship.
Correlational Research
• Correlation research is
looking for variables that
seem to interact with each
other, so that when you can
see one changing, you have
an idea of how the other will
change. This often entails the
researcher using variables
that they can't control.
Direction of a Correlation
• Positive Correlation: when
two variables go in the SAME
direction. For example,
domestic violence and
bowling. When bowling goes
up, so does domestic
violence. When domestic
violence decreases, so does
bowling.
Direction of a Correlation
• Negative Correlation: here the two
variables go in DIFFERENT
directions. For example,
consumption of garlic and dating
(now I am making this one up). The
less garlic you eat, the more you
date. The more garlic you eat, the
less the date. One variable going in
one direction can be used to predict
the other variable going in the
opposite direction.
Correlational Coefficient
• Scientists measure the
strength of a correlation by
using a number called a
correlational coefficient. Now
you do not have to know how
they get the number, but you
should know what it means
when you see it. The number
range from -1 to +1.
Correlational Coefficient
• If two variables (like studying and
grades) have a correlation above
zero (like +.76) then you have a
positive correlation and the more
you study, the better grades you
have. The the number is below
zero (like -.42) then you have a
negative correlation and when
one variable goes up the other
goes down (like garlic and dating).
Correlational Coefficient
• If two variables have a correlation
of zero then they have NO
relationship with each other. The
closer the numbers go to either +1
or -1, the stronger the
correlation. The strength has
nothing to do with whether the
number is positive of negative. A
correlation of -.88 is stronger than
one that is +.56. the closer the
number gets to zero (whether
positive or negative), the weaker
the correlation.
Limitations
• It is very important to
remember that correlation
doesn't imply causation
and there is no way to
determine or prove
causation from a
correlational study. This is a
common mistake made by
people in almost all
spheres of life.
Limitations
Limitations
• For example, a US politician speaking
out against free lunches to poor kids
at school argues -“You show me the
school that has the highest free and
reduced lunch, and I'll show you the
worst test scores, folks”
(nymag.com). This is a correlation he
is speaking about - one cannot imply
causation. The obvious explanation
for this is a common cause of
poverty: people who are too poor to
feed their children will not have the
best test scores.
Correlational research - Research Methodology - Manu Melwin Joy

Correlational research - Research Methodology - Manu Melwin Joy

  • 1.
  • 2.
    Prepared By Kindly restrictthe use of slides for personal purpose. Please seek permission to reproduce the same in public forms and presentations. Manu Melwin Joy Assistant Professor Ilahia School of Management Studies Kerala, India. Phone – 9744551114 Mail – manu_melwinjoy@yahoo.com
  • 3.
    Correlational Research • Acorrelation is simply defined as a relationship between two variables. The whole purpose of using correlations in research is to figure out which variables are connected.
  • 4.
    Correlational Research • Thissimple definition is the basis of several statistical tests that result in a correlation coefficient, defined as a numerical representation of the strength and direction of a relationship.
  • 5.
    Correlational Research • Correlationresearch is looking for variables that seem to interact with each other, so that when you can see one changing, you have an idea of how the other will change. This often entails the researcher using variables that they can't control.
  • 6.
    Direction of aCorrelation • Positive Correlation: when two variables go in the SAME direction. For example, domestic violence and bowling. When bowling goes up, so does domestic violence. When domestic violence decreases, so does bowling.
  • 7.
    Direction of aCorrelation • Negative Correlation: here the two variables go in DIFFERENT directions. For example, consumption of garlic and dating (now I am making this one up). The less garlic you eat, the more you date. The more garlic you eat, the less the date. One variable going in one direction can be used to predict the other variable going in the opposite direction.
  • 8.
    Correlational Coefficient • Scientistsmeasure the strength of a correlation by using a number called a correlational coefficient. Now you do not have to know how they get the number, but you should know what it means when you see it. The number range from -1 to +1.
  • 9.
    Correlational Coefficient • Iftwo variables (like studying and grades) have a correlation above zero (like +.76) then you have a positive correlation and the more you study, the better grades you have. The the number is below zero (like -.42) then you have a negative correlation and when one variable goes up the other goes down (like garlic and dating).
  • 10.
    Correlational Coefficient • Iftwo variables have a correlation of zero then they have NO relationship with each other. The closer the numbers go to either +1 or -1, the stronger the correlation. The strength has nothing to do with whether the number is positive of negative. A correlation of -.88 is stronger than one that is +.56. the closer the number gets to zero (whether positive or negative), the weaker the correlation.
  • 11.
    Limitations • It isvery important to remember that correlation doesn't imply causation and there is no way to determine or prove causation from a correlational study. This is a common mistake made by people in almost all spheres of life.
  • 12.
  • 13.
    Limitations • For example,a US politician speaking out against free lunches to poor kids at school argues -“You show me the school that has the highest free and reduced lunch, and I'll show you the worst test scores, folks” (nymag.com). This is a correlation he is speaking about - one cannot imply causation. The obvious explanation for this is a common cause of poverty: people who are too poor to feed their children will not have the best test scores.