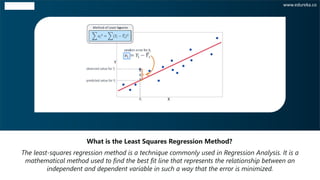
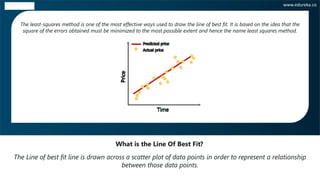
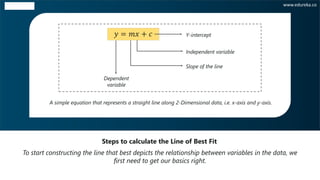
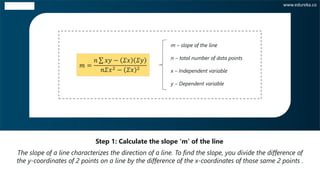
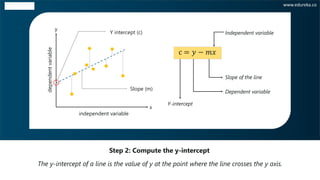
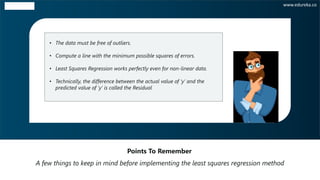
WHAT IS THE LEAST SQUARES METHOD?
STEPS TO COMPUTE THE LINE OF BEST FIT
REGRESSION ANALYSIS USING PYTHON
LINE OF BEST FIT
www.edureka.co
THE LEAST-SQUARES REGRESSION METHOD WITH AN EXAMPLE
WHAT IS THE LEAST SQUARES REGRESSION
METHOD?
www.edureka.co
The least-squares regression method is a technique commonly used in Regression Analysis. It is a
mathematical method used to find the best fit line that represents the relationship between an
independent and dependent variable in such a way that the error is minimized.
What is the Least Squares Regression Method?
www.edureka.co
LINE OF BEST FIT
www.edureka.co
The Line of best fit line is drawn across a scatter plot of data points in order to represent a relationship
between those data points.
What is the Line Of Best Fit?
www.edureka.co
The least-squares method is one of the most effective ways used to draw the line of best fit. It is based on the idea that the
square of the errors obtained must be minimized to the most possible extent and hence the name least squares method.
STEPS TO COMPUTE THE LINE OF BEST FIT
www.edureka.co
To start constructing the line that best depicts the relationship between variables in the data, we
first need to get our basics right.
Steps to calculate the Line of Best Fit
www.edureka.co
𝑦 = 𝑚𝑥 + 𝑐
Dependent
variable
Y-intercept
Independent variable
Slope of the line
A simple equation that represents a straight line along 2-Dimensional data, i.e. x-axis and y-axis.
The slope of a line characterizes the direction of a line. To find the slope, you divide the difference of
the y-coordinates of 2 points on a line by the difference of the x-coordinates of those same 2 points .
Step 1: Calculate the slope ‘m’ of the line
www.edureka.co
𝑚 =
𝑛 σ 𝑥𝑦 − 𝛴𝑥 𝛴𝑦
𝑛𝛴𝑥2 − 𝛴𝑥 2
m – slope of the line
n – total number of data points
x – Independent variable
y – Dependent variable
The y-intercept of a line is the value of y at the point where the line crosses the y axis.
Step 2: Compute the y-intercept
www.edureka.co
x
y
independent variable
dependentvariable
Y intercept (c)
Slope (m)
c = 𝑦 − 𝑚𝑥
Dependent variable
Y-intercept
Independent variable
Slope of the line
A simple equation that represents a straight line along 2-Dimensional data, i.e. x-axis and y-axis.
Step 3: Substitute the values in the final equation
www.edureka.co
𝑦 = 𝑚𝑥 + 𝑐
Dependent
variable
Y-intercept
Independent variable
Slope of the line
THE LEAST-SQUARES REGRESSION
METHOD WITH AN EXAMPLE
www.edureka.co
Copyright © 2017, edureka and/or its affiliates. All rights reserved.
www.edureka.co
www.edureka.co
Price of T-shirts
in dollars (x)
# of T-shirts sold
(y)
2 4
3 5
5 7
7 10
9 15
Step 1: Calculate the slope ‘m’
Step 2: Compute the y-intercept value
Step 3: Substitute the values in the final equation
𝑚 =
𝑛 σ 𝑥𝑦− 𝛴𝑥 𝛴𝑦
𝑛𝛴𝑥2− 𝛴𝑥 2 = 1.518 approx
c = 𝑦 − 𝑚𝑥 = 0.305
y = 1.518 x + 0.305
Tom who is the owner of a retail shop, found the price of different T-shirts vs the number of T-shirts sold at
his shop over a period of one week.
www.edureka.co
Tom who is the owner of a retail shop, found the price of different T-shirts vs the number of T-shirts sold at
his shop over a period of one week.
Step 1: Calculate the slope ‘m’
Step 2: Compute the y-intercept value
Step 3: Substitute the values in the final equation
𝑚 =
𝑛 σ 𝑥𝑦− 𝛴𝑥 𝛴𝑦
𝑛𝛴𝑥2− 𝛴𝑥 2 = 1.518 approx
c = 𝑦 − 𝑚𝑥 = 0.305
Consider x = $8,
y = 1.518 x 8 + 0.305 = 12.45 = 13 T-shirts
Price of
T-shirts
in dollars
(x)
# of T-
shirts
sold (y)
Y=mx+c error
2 4 3.3 -0.67
3 5 4.9 -0.14
5 7 7.9 0.89
7 10 10.9 0.93
9 15 13.9 -1.03
A few things to keep in mind before implementing the least squares regression method
Points To Remember
www.edureka.co
• The data must be free of outliers.
• Compute a line with the minimum possible squares of errors.
• Least Squares Regression works perfectly even for non-linear data.
• Technically, the difference between the actual value of ‘y’ and the
predicted value of ‘y’ is called the Residual
REGRESSION ANALYSIS USING PYTHON
www.edureka.co
Problem Statement: To apply Linear Regression using Least Squares Regression method and build a model that studies
the relationship between the head size and the brain weight of an individual..
Linear Regression Using Least Squares Regression Method In Python
www.edureka.co
Data Set Description: The data set contains the following variables:
• Gender: Male or female represented as binary variables
• Age: Age of an individual
• Head size in cm^3: An individuals head size in cm^3
• Brain weight in grams: The weight of an individual’s brain
measured in grams
www.edureka.co

Least Squares Regression Method | Edureka

  • 2.
    WHAT IS THELEAST SQUARES METHOD? STEPS TO COMPUTE THE LINE OF BEST FIT REGRESSION ANALYSIS USING PYTHON LINE OF BEST FIT www.edureka.co THE LEAST-SQUARES REGRESSION METHOD WITH AN EXAMPLE
  • 3.
    WHAT IS THELEAST SQUARES REGRESSION METHOD? www.edureka.co
  • 4.
    The least-squares regressionmethod is a technique commonly used in Regression Analysis. It is a mathematical method used to find the best fit line that represents the relationship between an independent and dependent variable in such a way that the error is minimized. What is the Least Squares Regression Method? www.edureka.co
  • 5.
    LINE OF BESTFIT www.edureka.co
  • 6.
    The Line ofbest fit line is drawn across a scatter plot of data points in order to represent a relationship between those data points. What is the Line Of Best Fit? www.edureka.co The least-squares method is one of the most effective ways used to draw the line of best fit. It is based on the idea that the square of the errors obtained must be minimized to the most possible extent and hence the name least squares method.
  • 7.
    STEPS TO COMPUTETHE LINE OF BEST FIT www.edureka.co
  • 8.
    To start constructingthe line that best depicts the relationship between variables in the data, we first need to get our basics right. Steps to calculate the Line of Best Fit www.edureka.co 𝑦 = 𝑚𝑥 + 𝑐 Dependent variable Y-intercept Independent variable Slope of the line A simple equation that represents a straight line along 2-Dimensional data, i.e. x-axis and y-axis.
  • 9.
    The slope ofa line characterizes the direction of a line. To find the slope, you divide the difference of the y-coordinates of 2 points on a line by the difference of the x-coordinates of those same 2 points . Step 1: Calculate the slope ‘m’ of the line www.edureka.co 𝑚 = 𝑛 σ 𝑥𝑦 − 𝛴𝑥 𝛴𝑦 𝑛𝛴𝑥2 − 𝛴𝑥 2 m – slope of the line n – total number of data points x – Independent variable y – Dependent variable
  • 10.
    The y-intercept ofa line is the value of y at the point where the line crosses the y axis. Step 2: Compute the y-intercept www.edureka.co x y independent variable dependentvariable Y intercept (c) Slope (m) c = 𝑦 − 𝑚𝑥 Dependent variable Y-intercept Independent variable Slope of the line
  • 11.
    A simple equationthat represents a straight line along 2-Dimensional data, i.e. x-axis and y-axis. Step 3: Substitute the values in the final equation www.edureka.co 𝑦 = 𝑚𝑥 + 𝑐 Dependent variable Y-intercept Independent variable Slope of the line
  • 12.
    THE LEAST-SQUARES REGRESSION METHODWITH AN EXAMPLE www.edureka.co
  • 13.
    Copyright © 2017,edureka and/or its affiliates. All rights reserved. www.edureka.co
  • 14.
    www.edureka.co Price of T-shirts indollars (x) # of T-shirts sold (y) 2 4 3 5 5 7 7 10 9 15 Step 1: Calculate the slope ‘m’ Step 2: Compute the y-intercept value Step 3: Substitute the values in the final equation 𝑚 = 𝑛 σ 𝑥𝑦− 𝛴𝑥 𝛴𝑦 𝑛𝛴𝑥2− 𝛴𝑥 2 = 1.518 approx c = 𝑦 − 𝑚𝑥 = 0.305 y = 1.518 x + 0.305 Tom who is the owner of a retail shop, found the price of different T-shirts vs the number of T-shirts sold at his shop over a period of one week.
  • 15.
    www.edureka.co Tom who isthe owner of a retail shop, found the price of different T-shirts vs the number of T-shirts sold at his shop over a period of one week. Step 1: Calculate the slope ‘m’ Step 2: Compute the y-intercept value Step 3: Substitute the values in the final equation 𝑚 = 𝑛 σ 𝑥𝑦− 𝛴𝑥 𝛴𝑦 𝑛𝛴𝑥2− 𝛴𝑥 2 = 1.518 approx c = 𝑦 − 𝑚𝑥 = 0.305 Consider x = $8, y = 1.518 x 8 + 0.305 = 12.45 = 13 T-shirts Price of T-shirts in dollars (x) # of T- shirts sold (y) Y=mx+c error 2 4 3.3 -0.67 3 5 4.9 -0.14 5 7 7.9 0.89 7 10 10.9 0.93 9 15 13.9 -1.03
  • 16.
    A few thingsto keep in mind before implementing the least squares regression method Points To Remember www.edureka.co • The data must be free of outliers. • Compute a line with the minimum possible squares of errors. • Least Squares Regression works perfectly even for non-linear data. • Technically, the difference between the actual value of ‘y’ and the predicted value of ‘y’ is called the Residual
  • 17.
    REGRESSION ANALYSIS USINGPYTHON www.edureka.co
  • 18.
    Problem Statement: Toapply Linear Regression using Least Squares Regression method and build a model that studies the relationship between the head size and the brain weight of an individual.. Linear Regression Using Least Squares Regression Method In Python www.edureka.co Data Set Description: The data set contains the following variables: • Gender: Male or female represented as binary variables • Age: Age of an individual • Head size in cm^3: An individuals head size in cm^3 • Brain weight in grams: The weight of an individual’s brain measured in grams
  • 19.