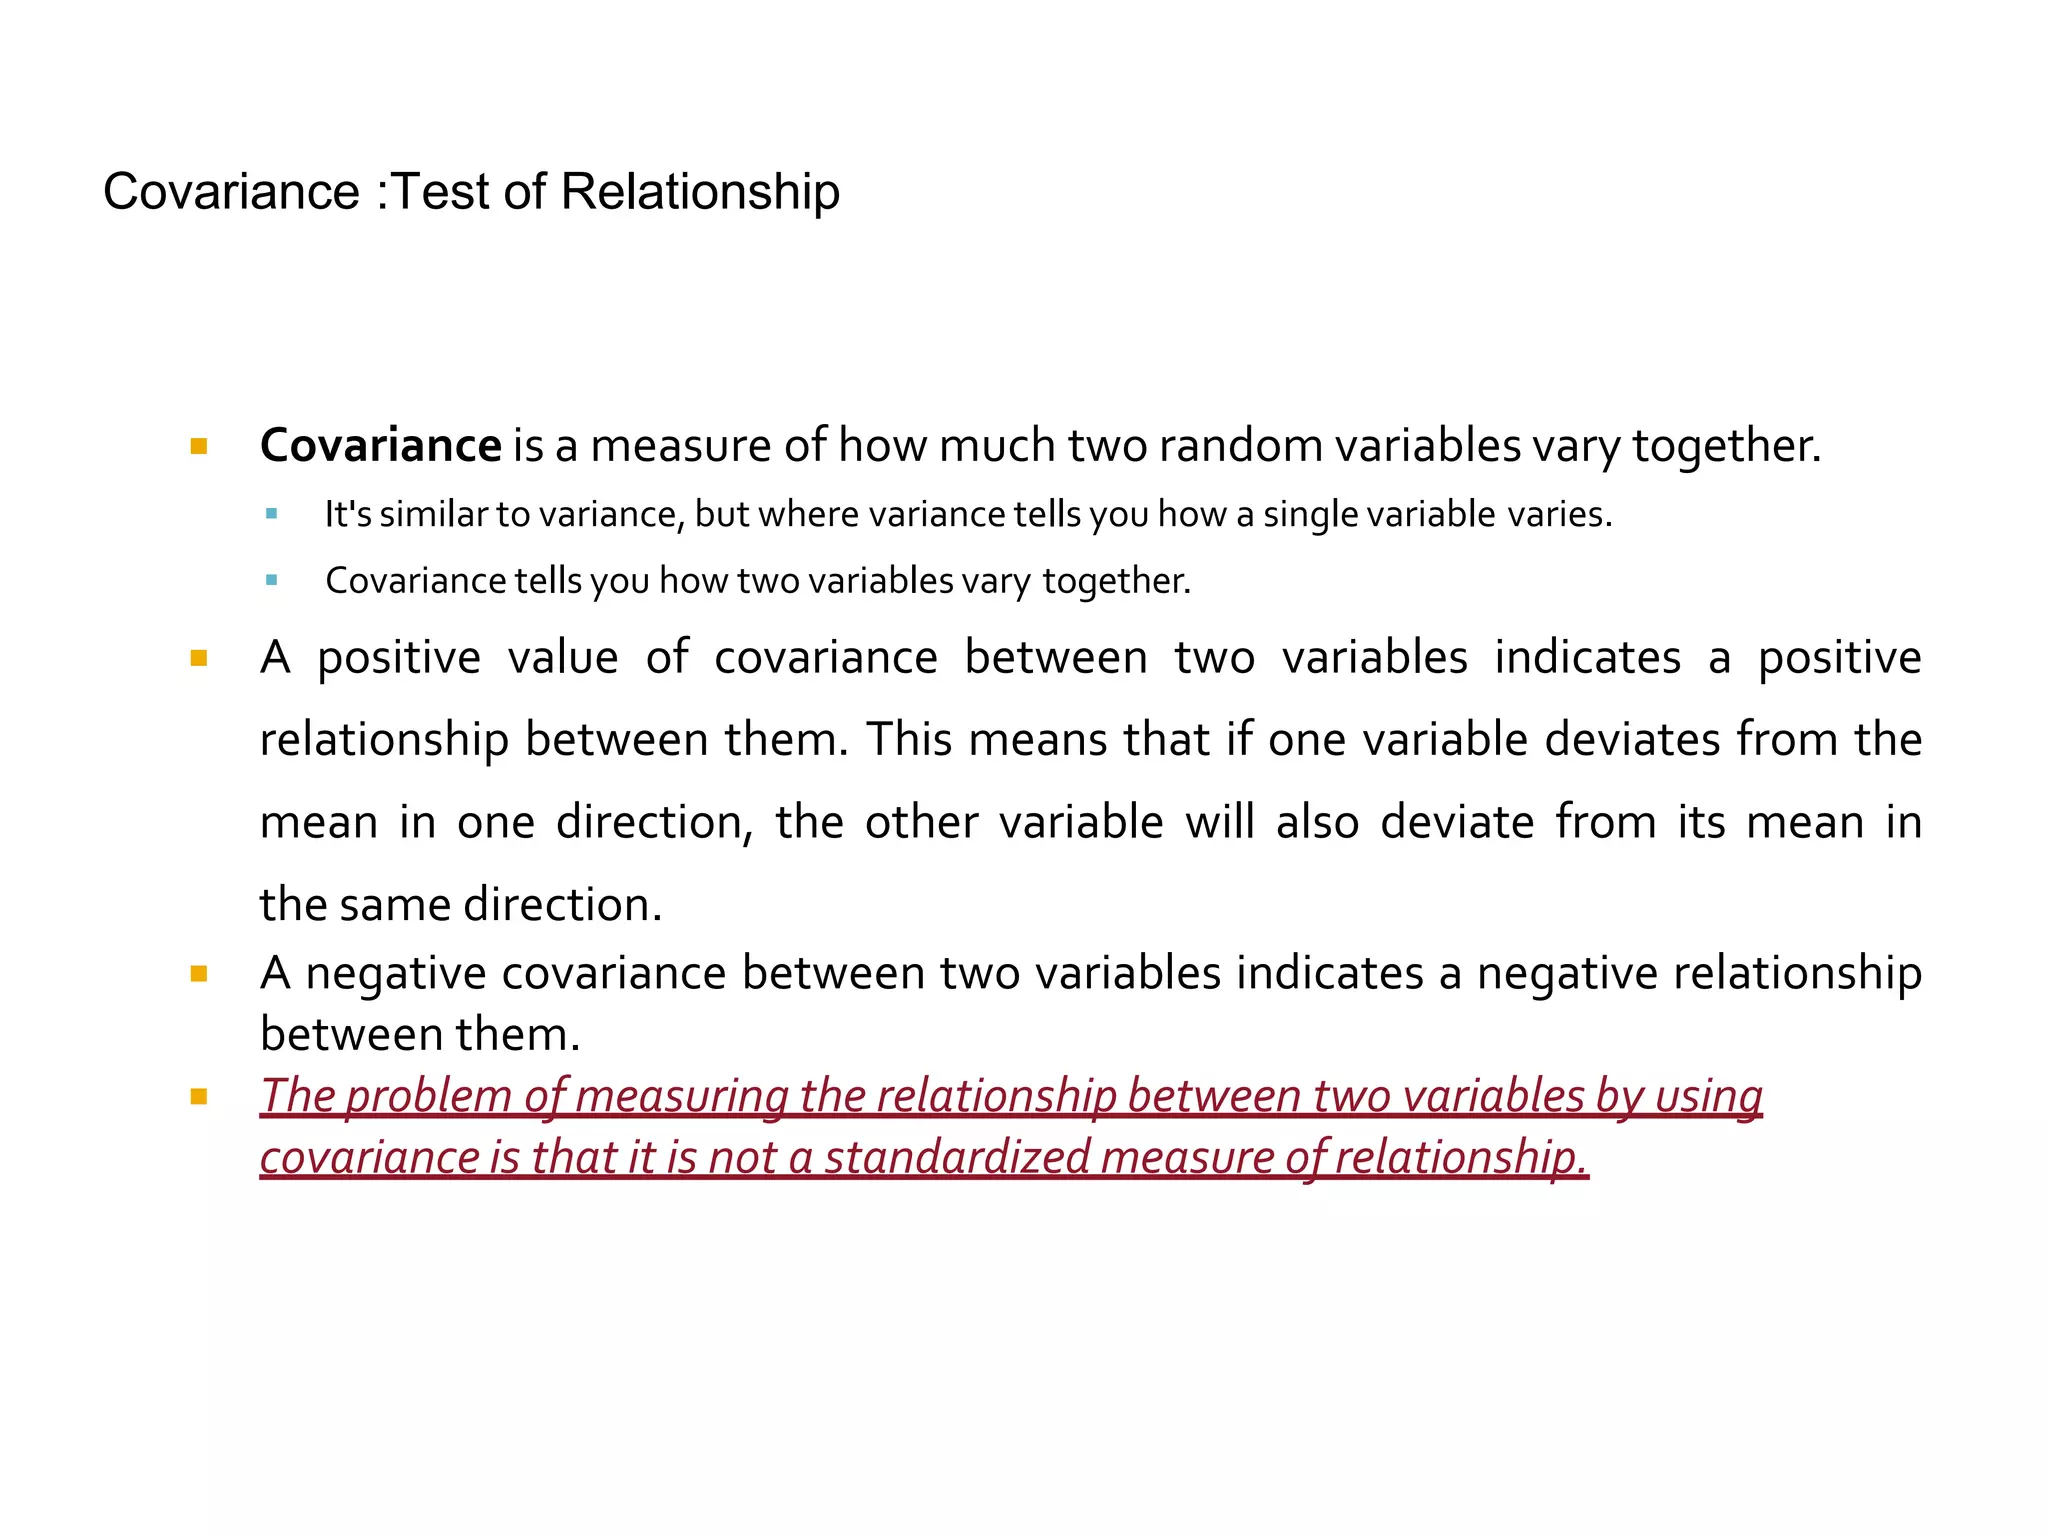
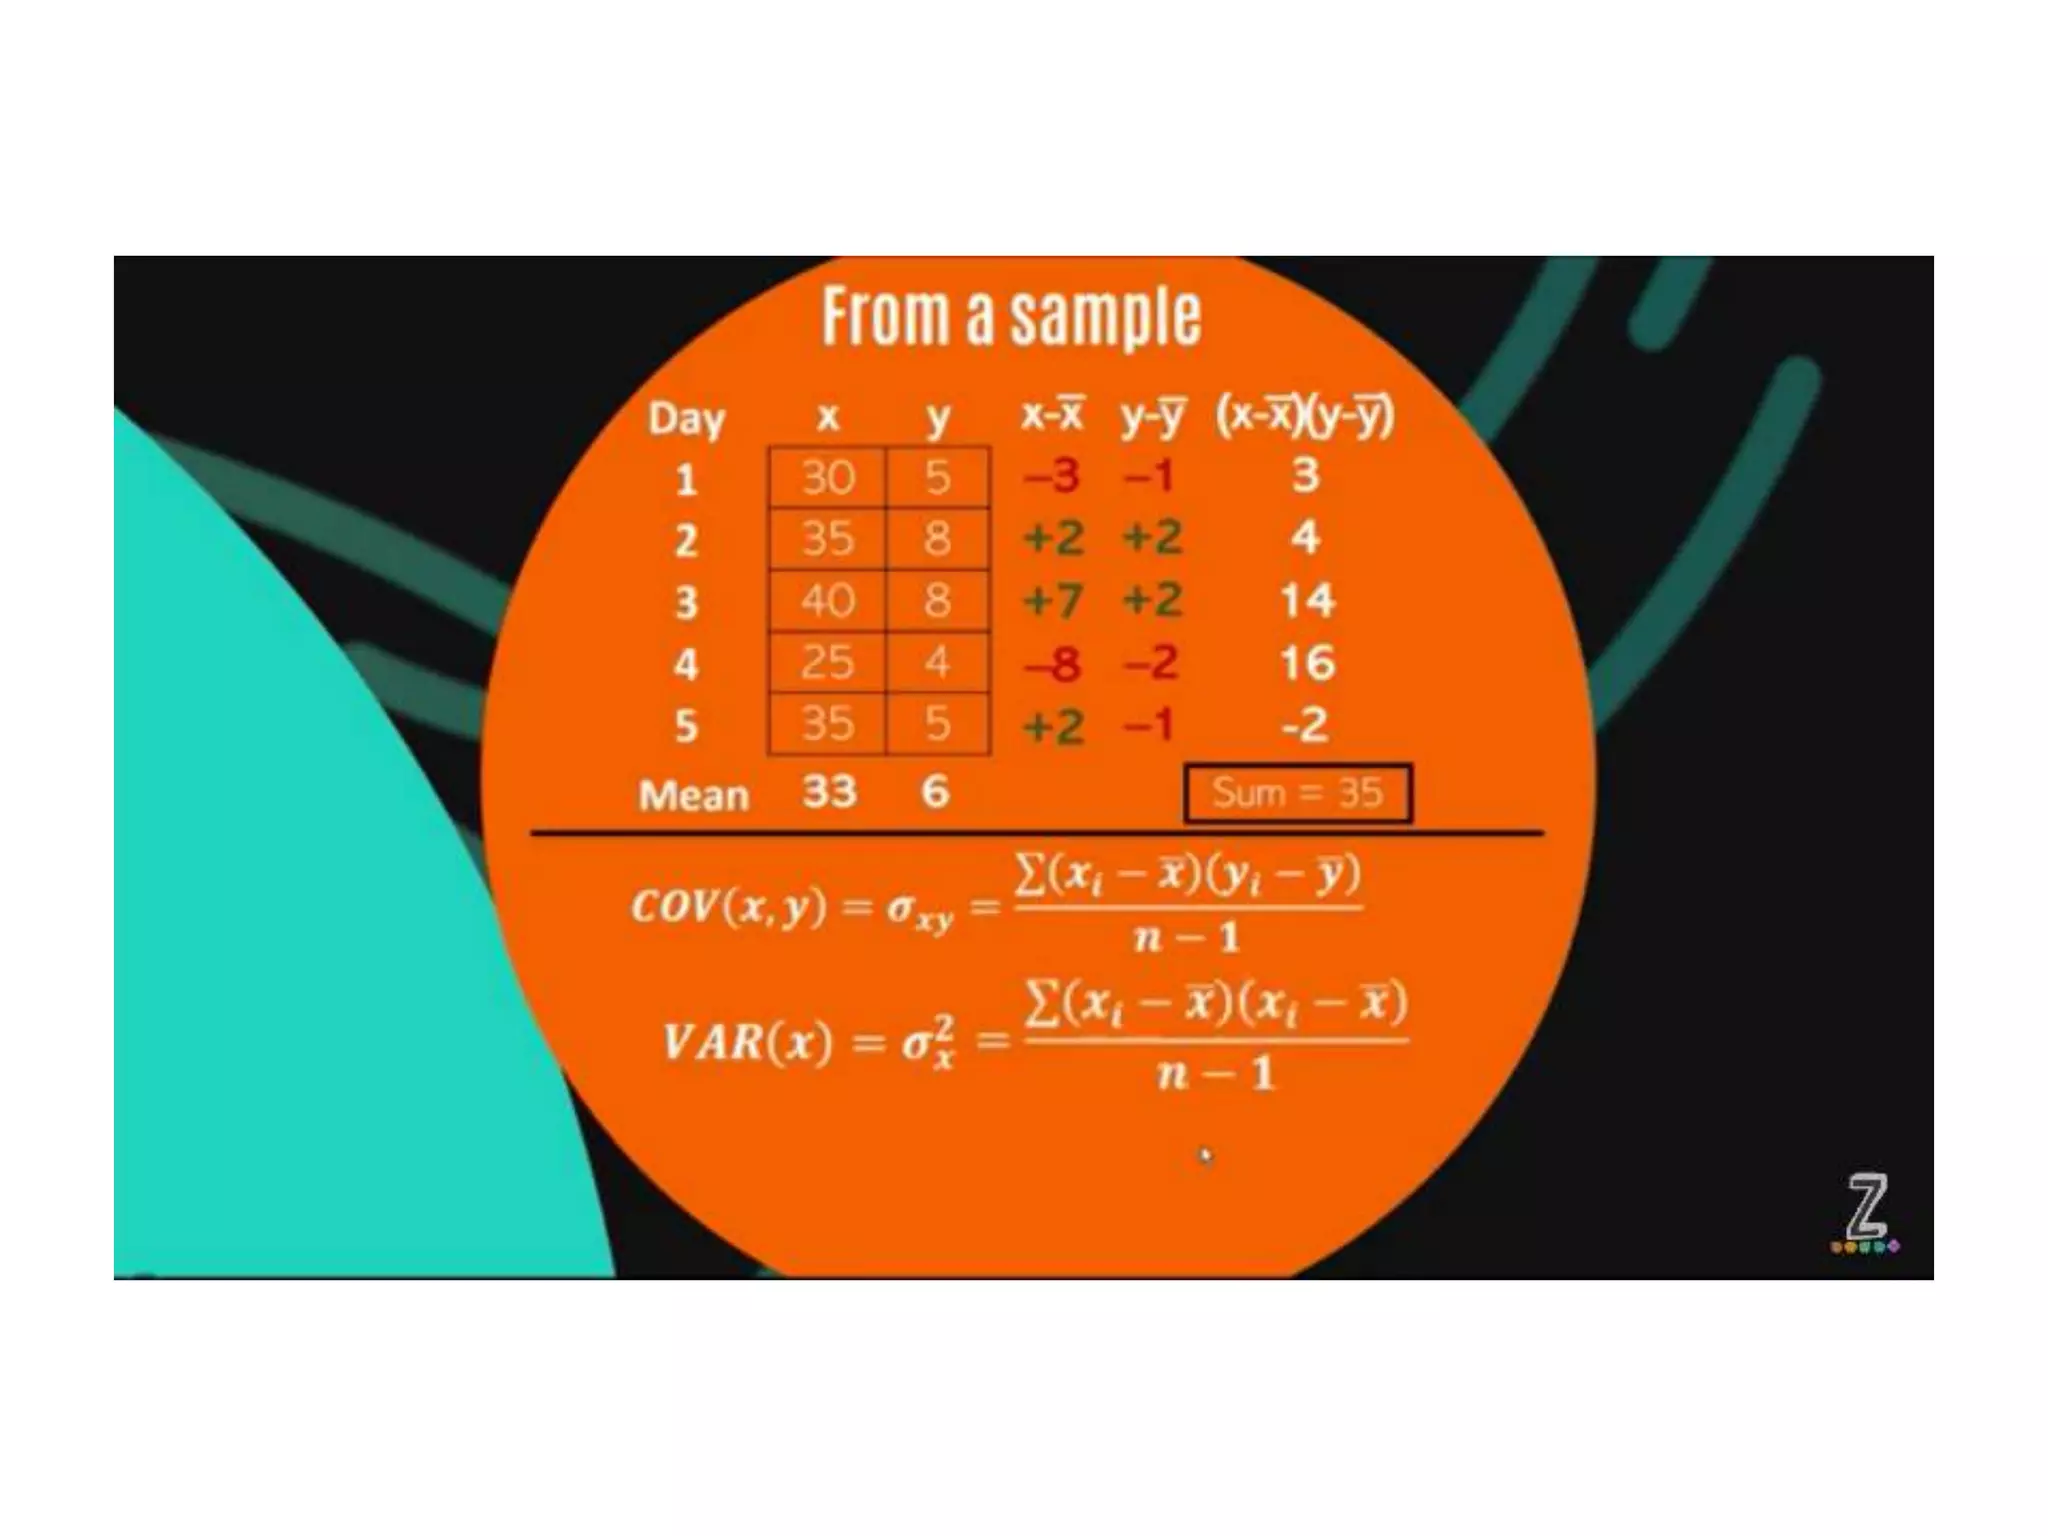
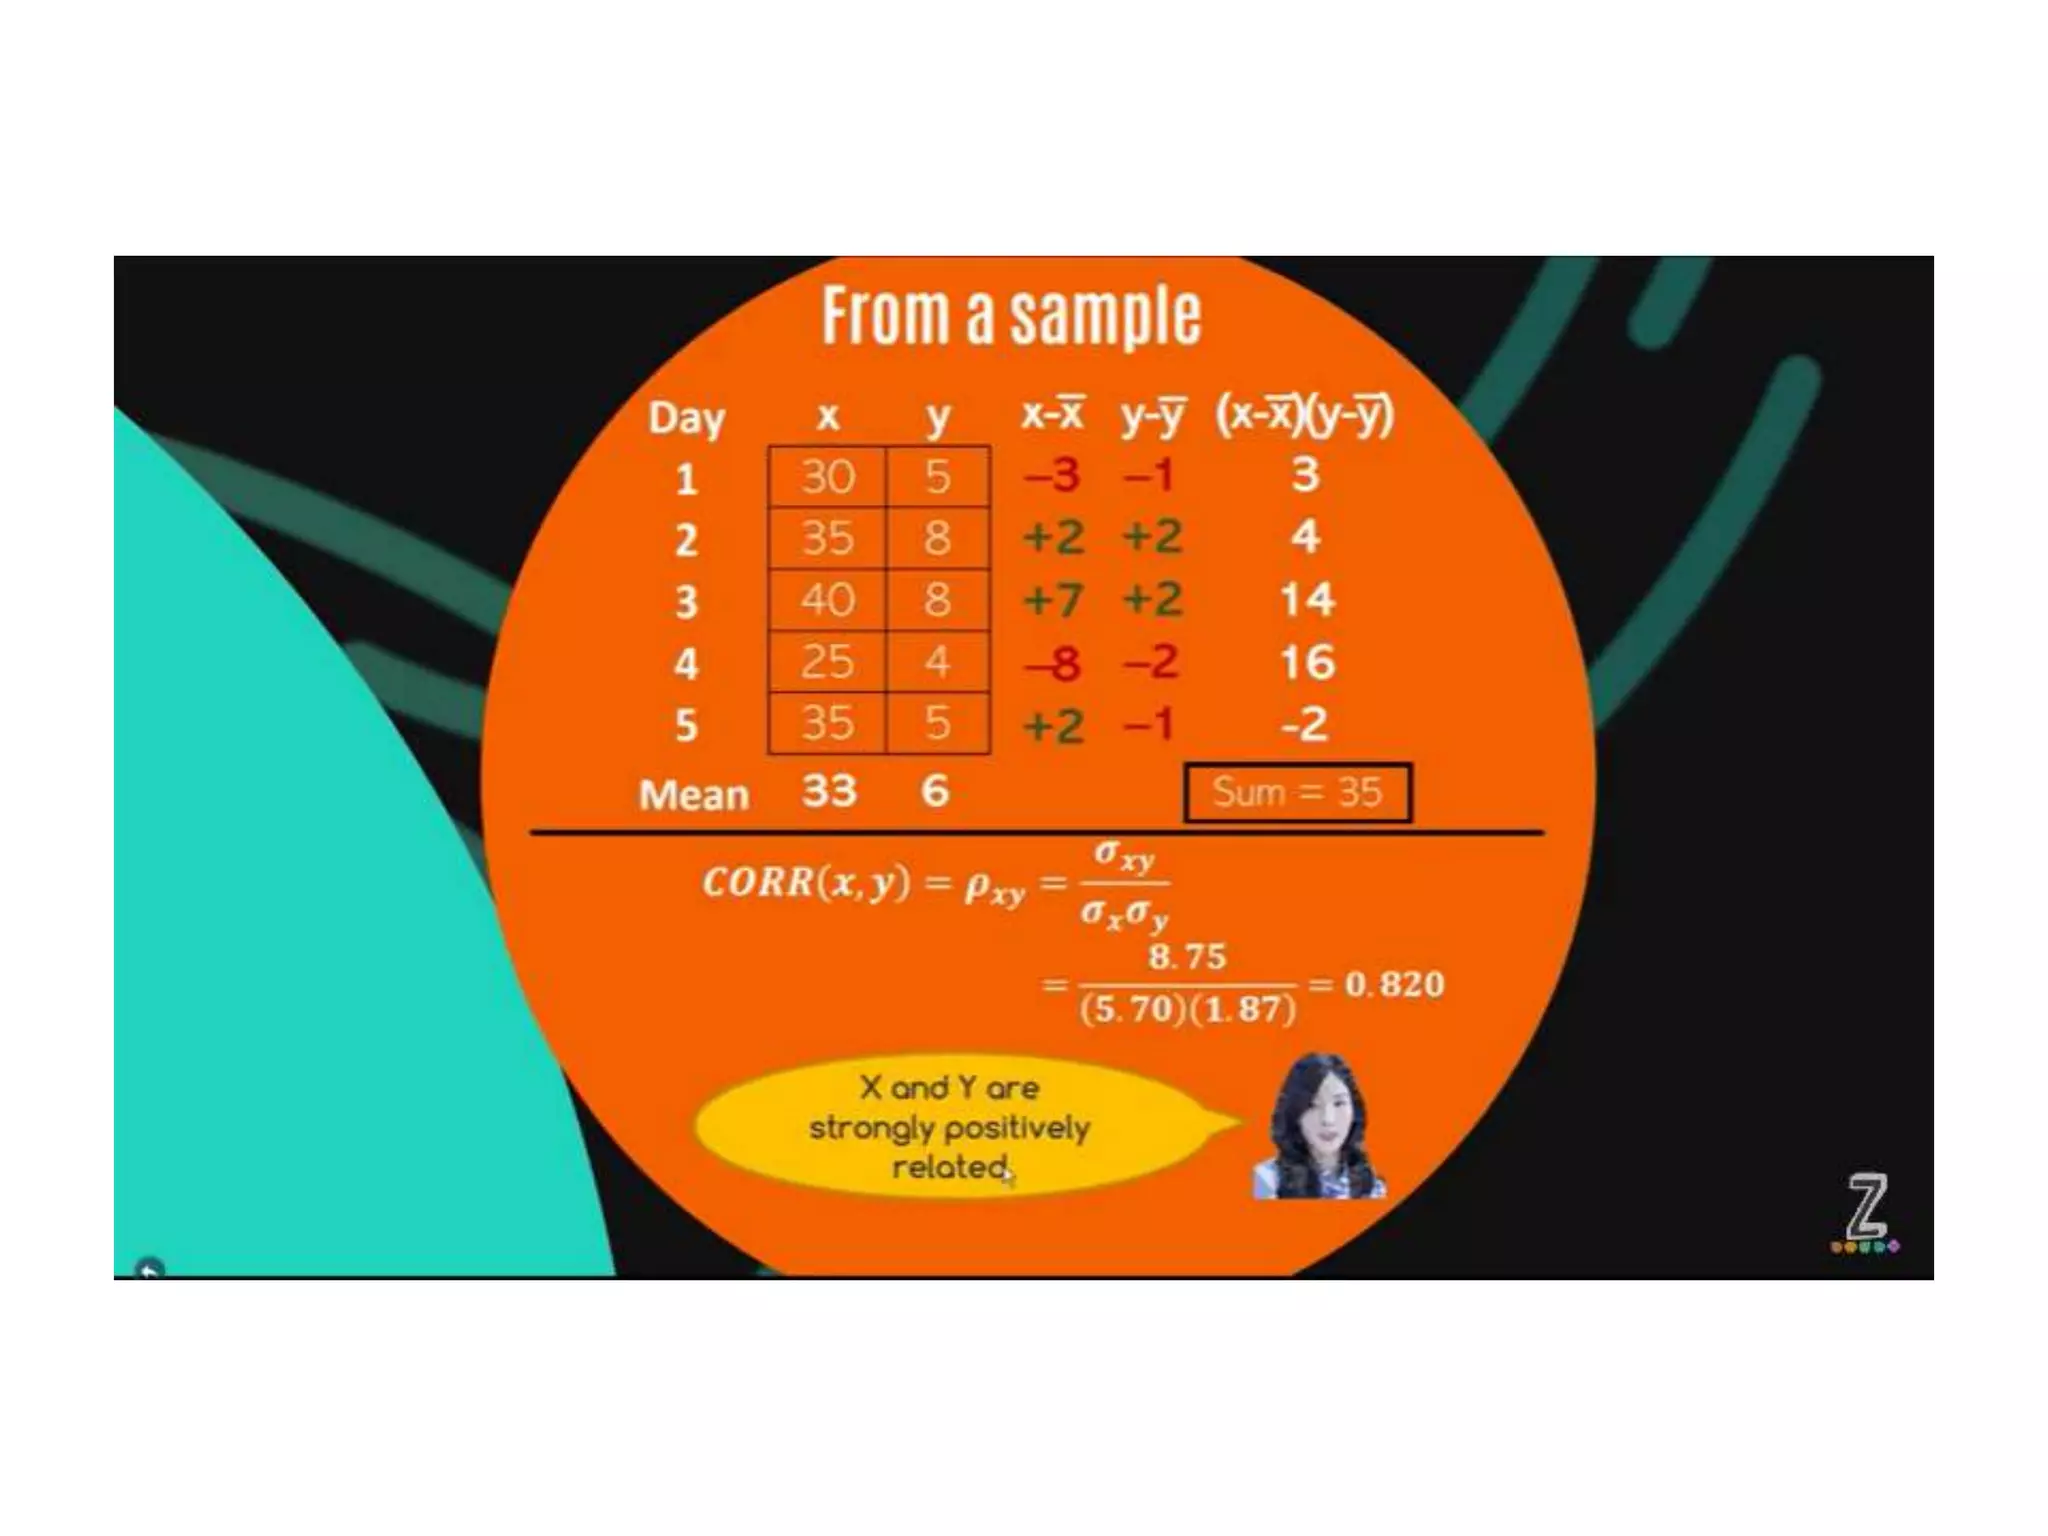
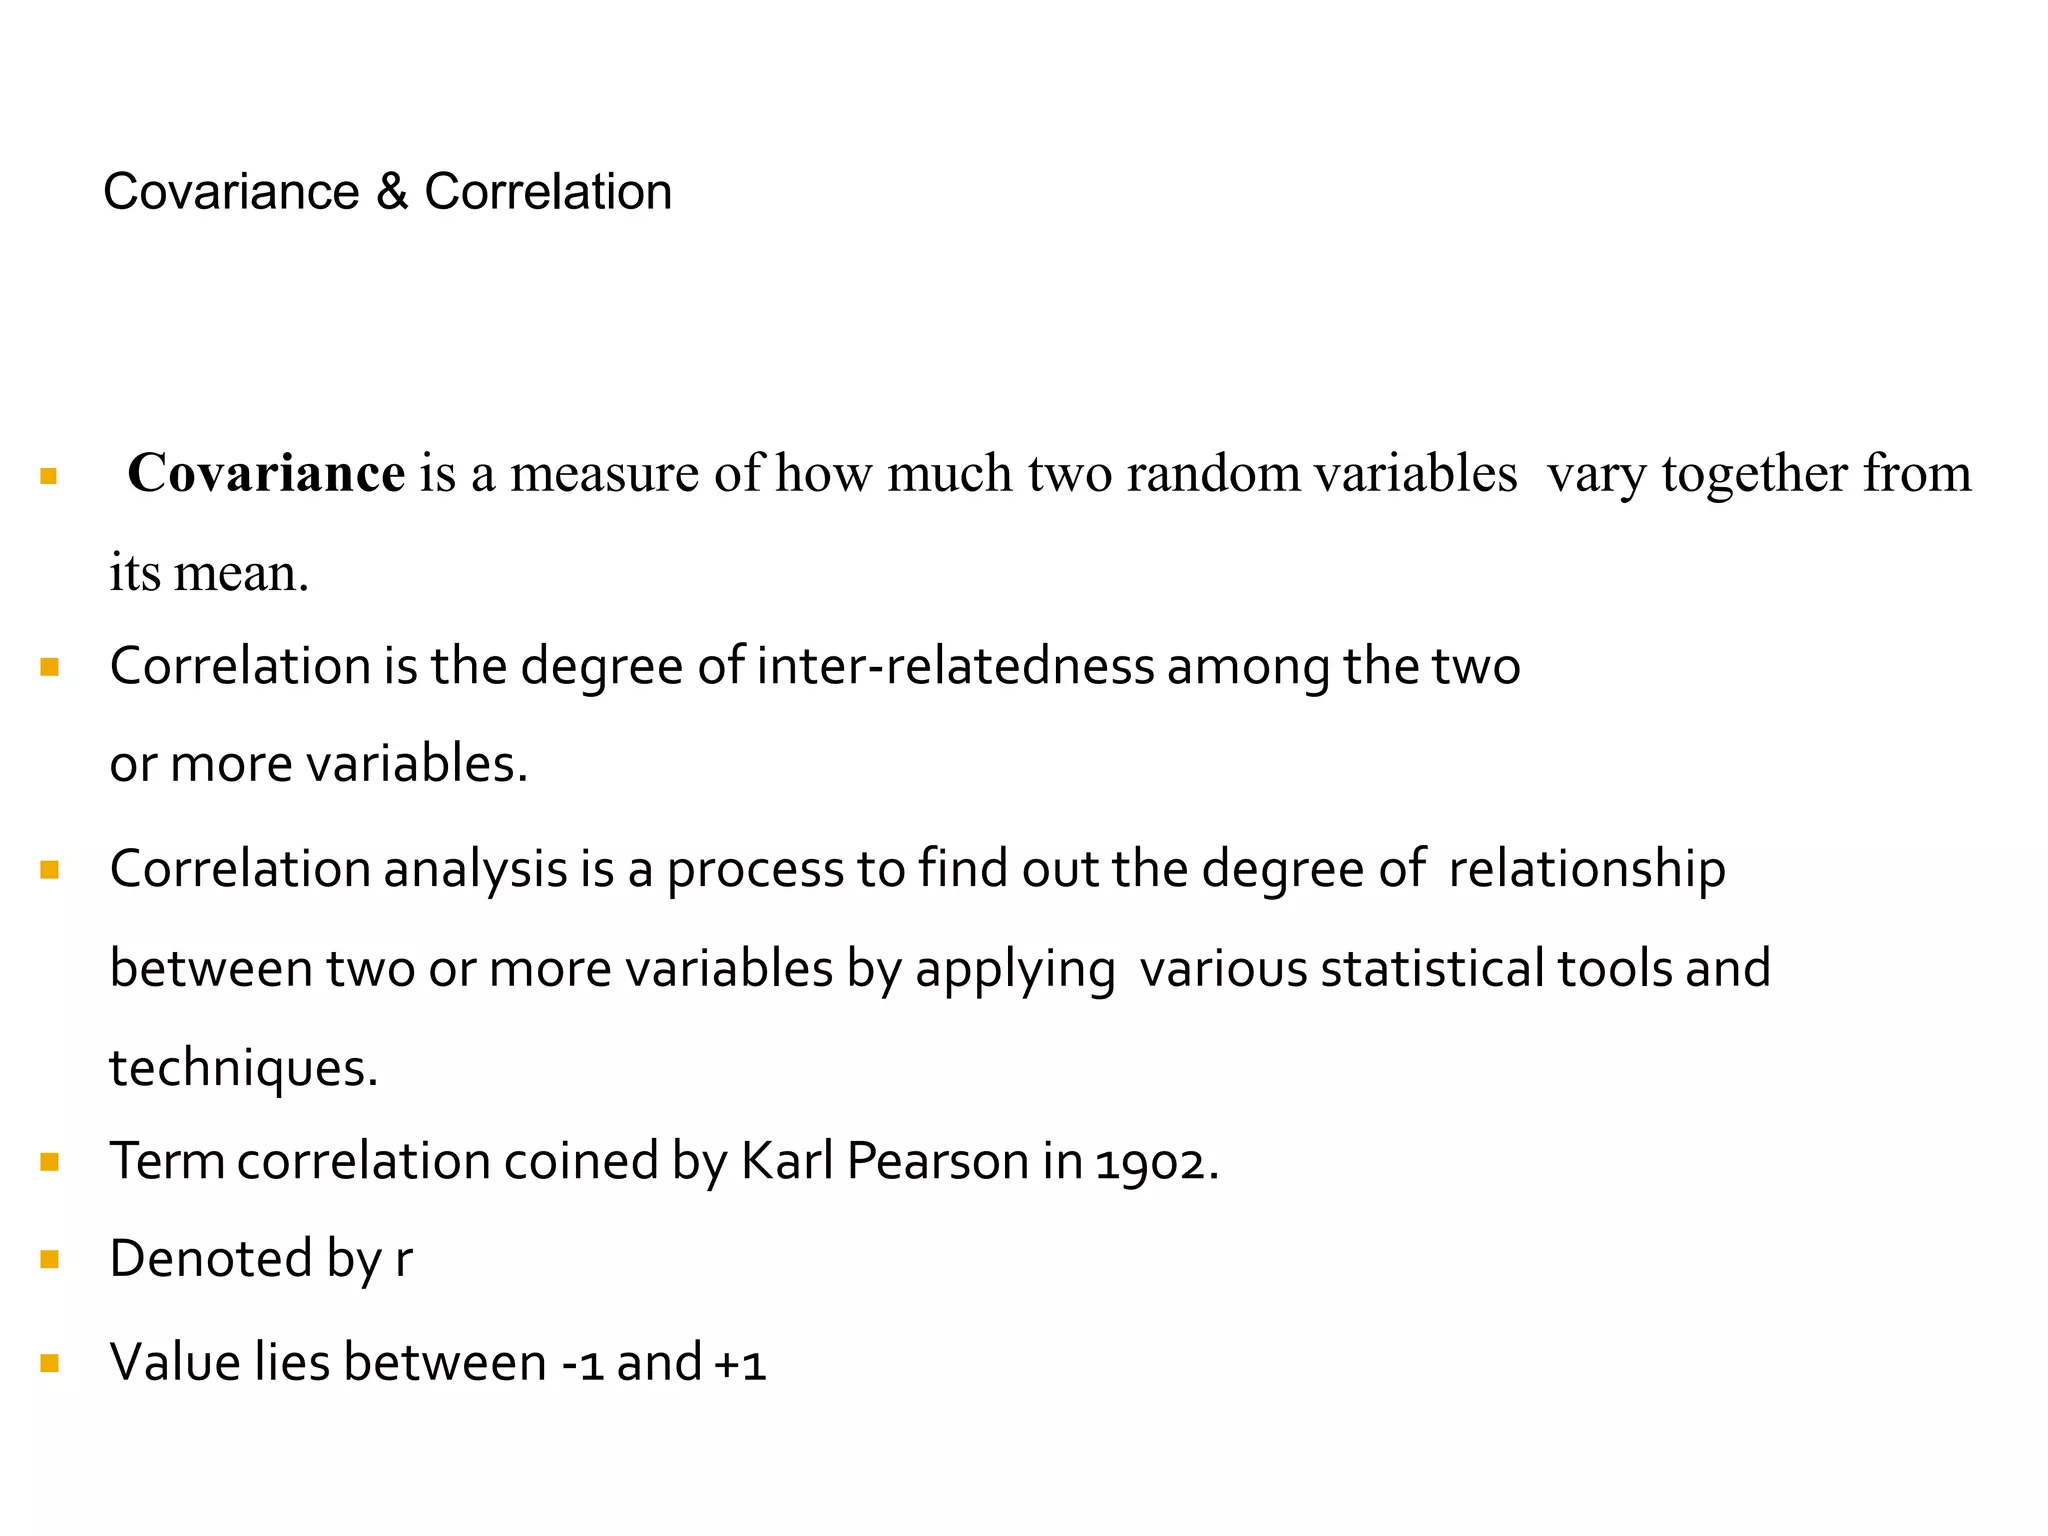
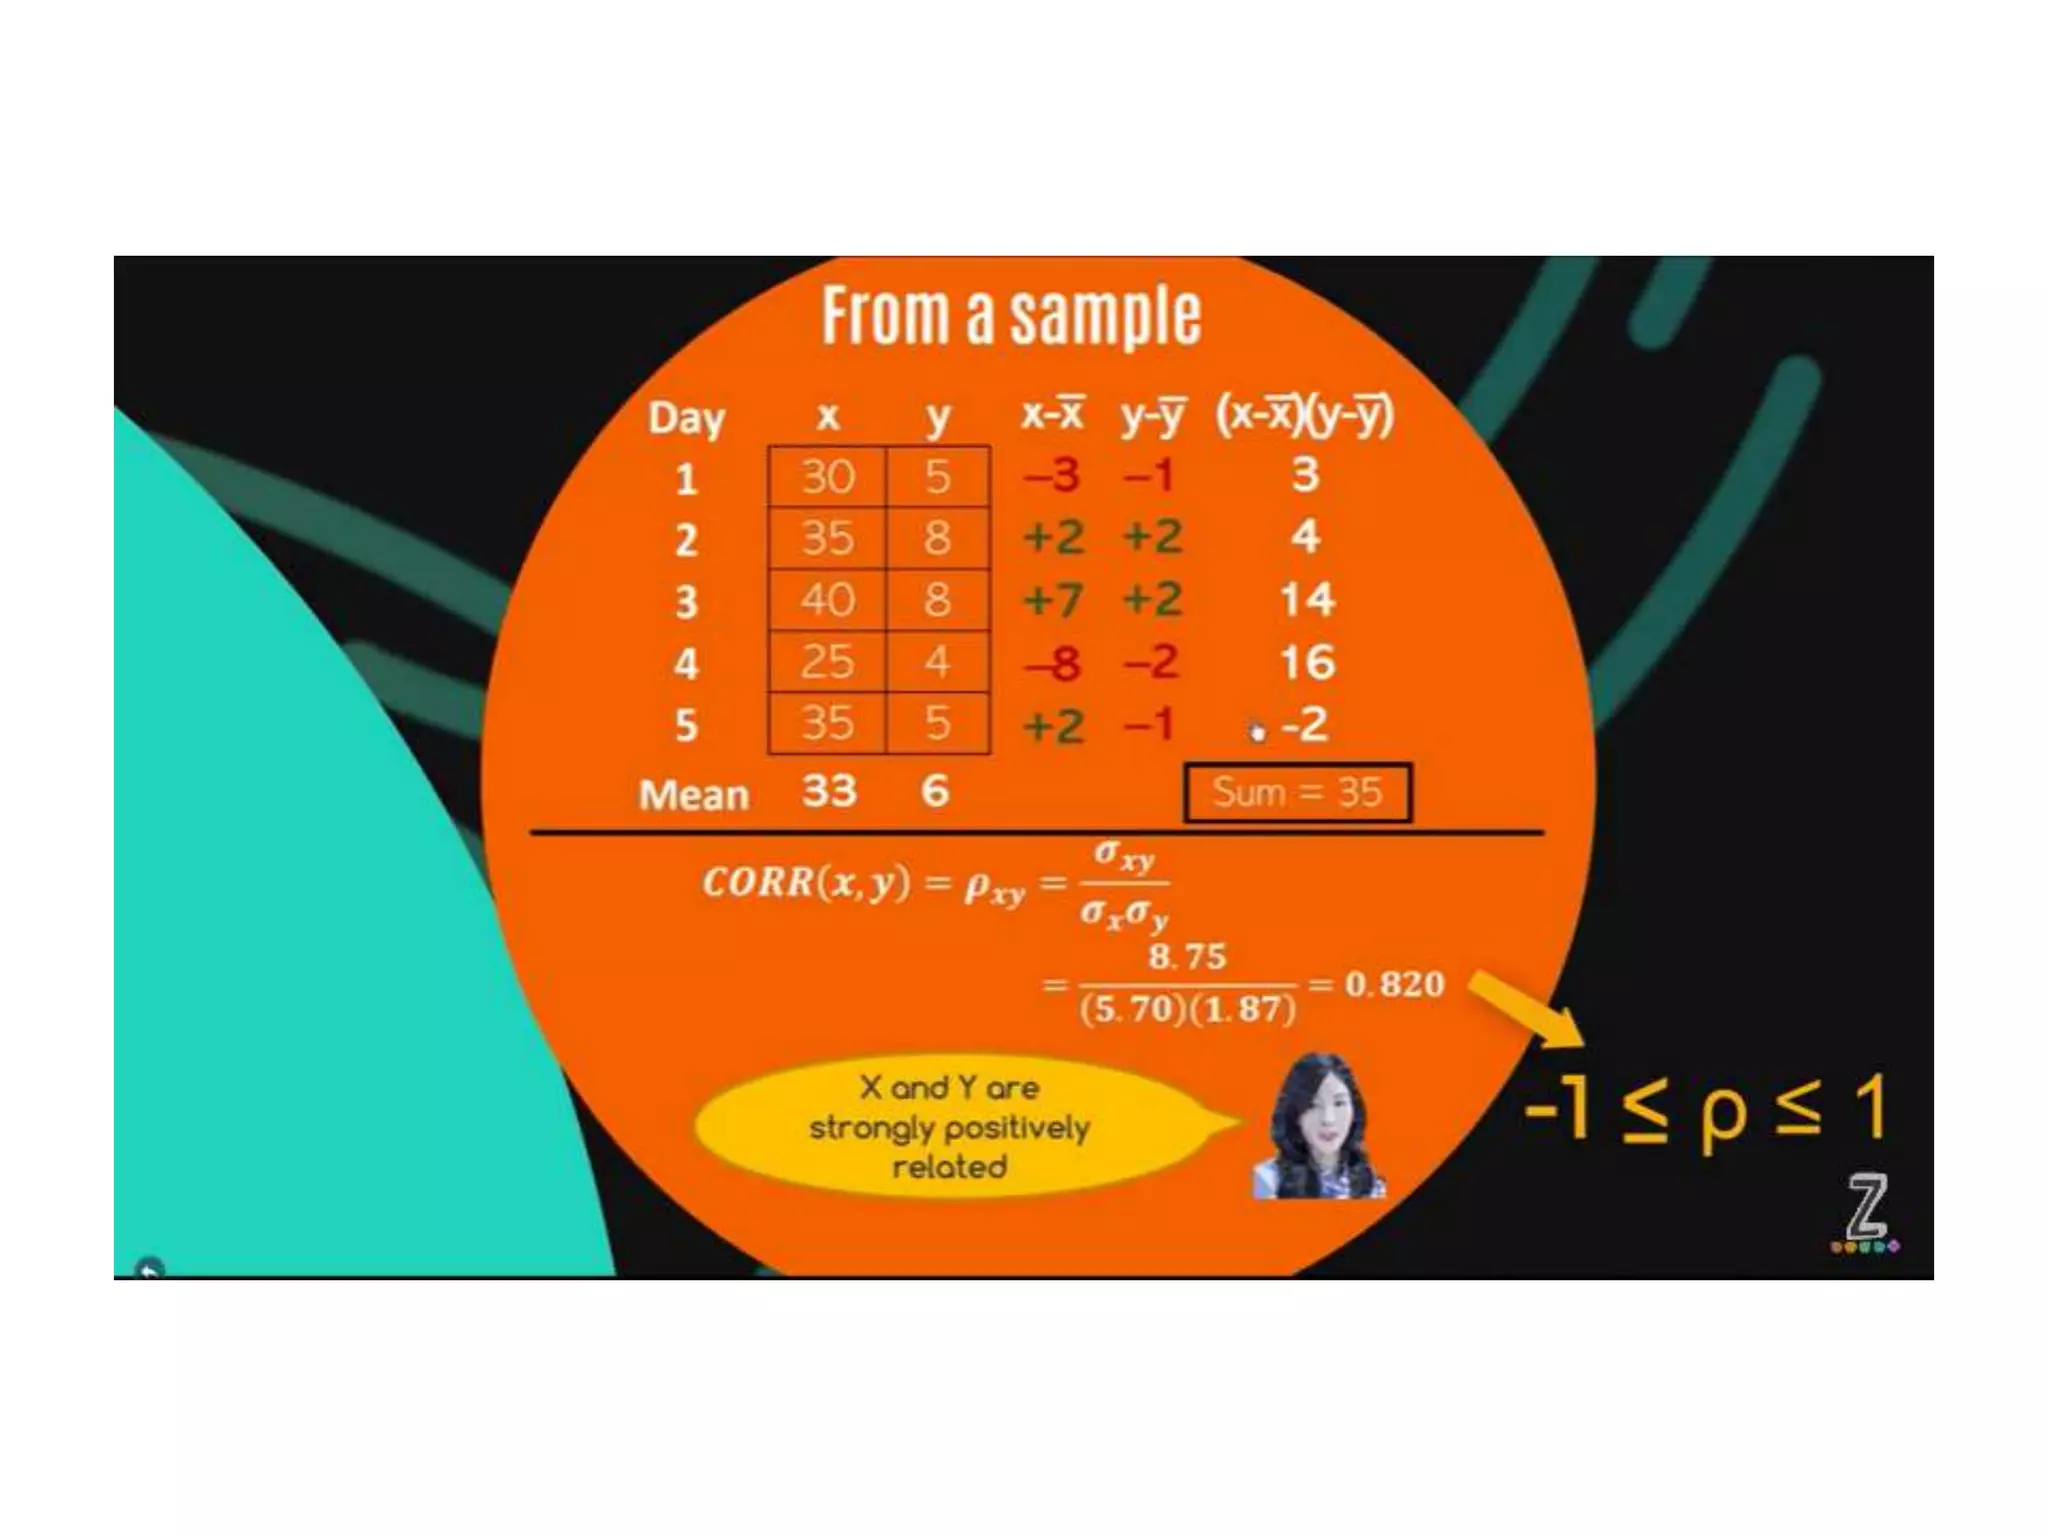
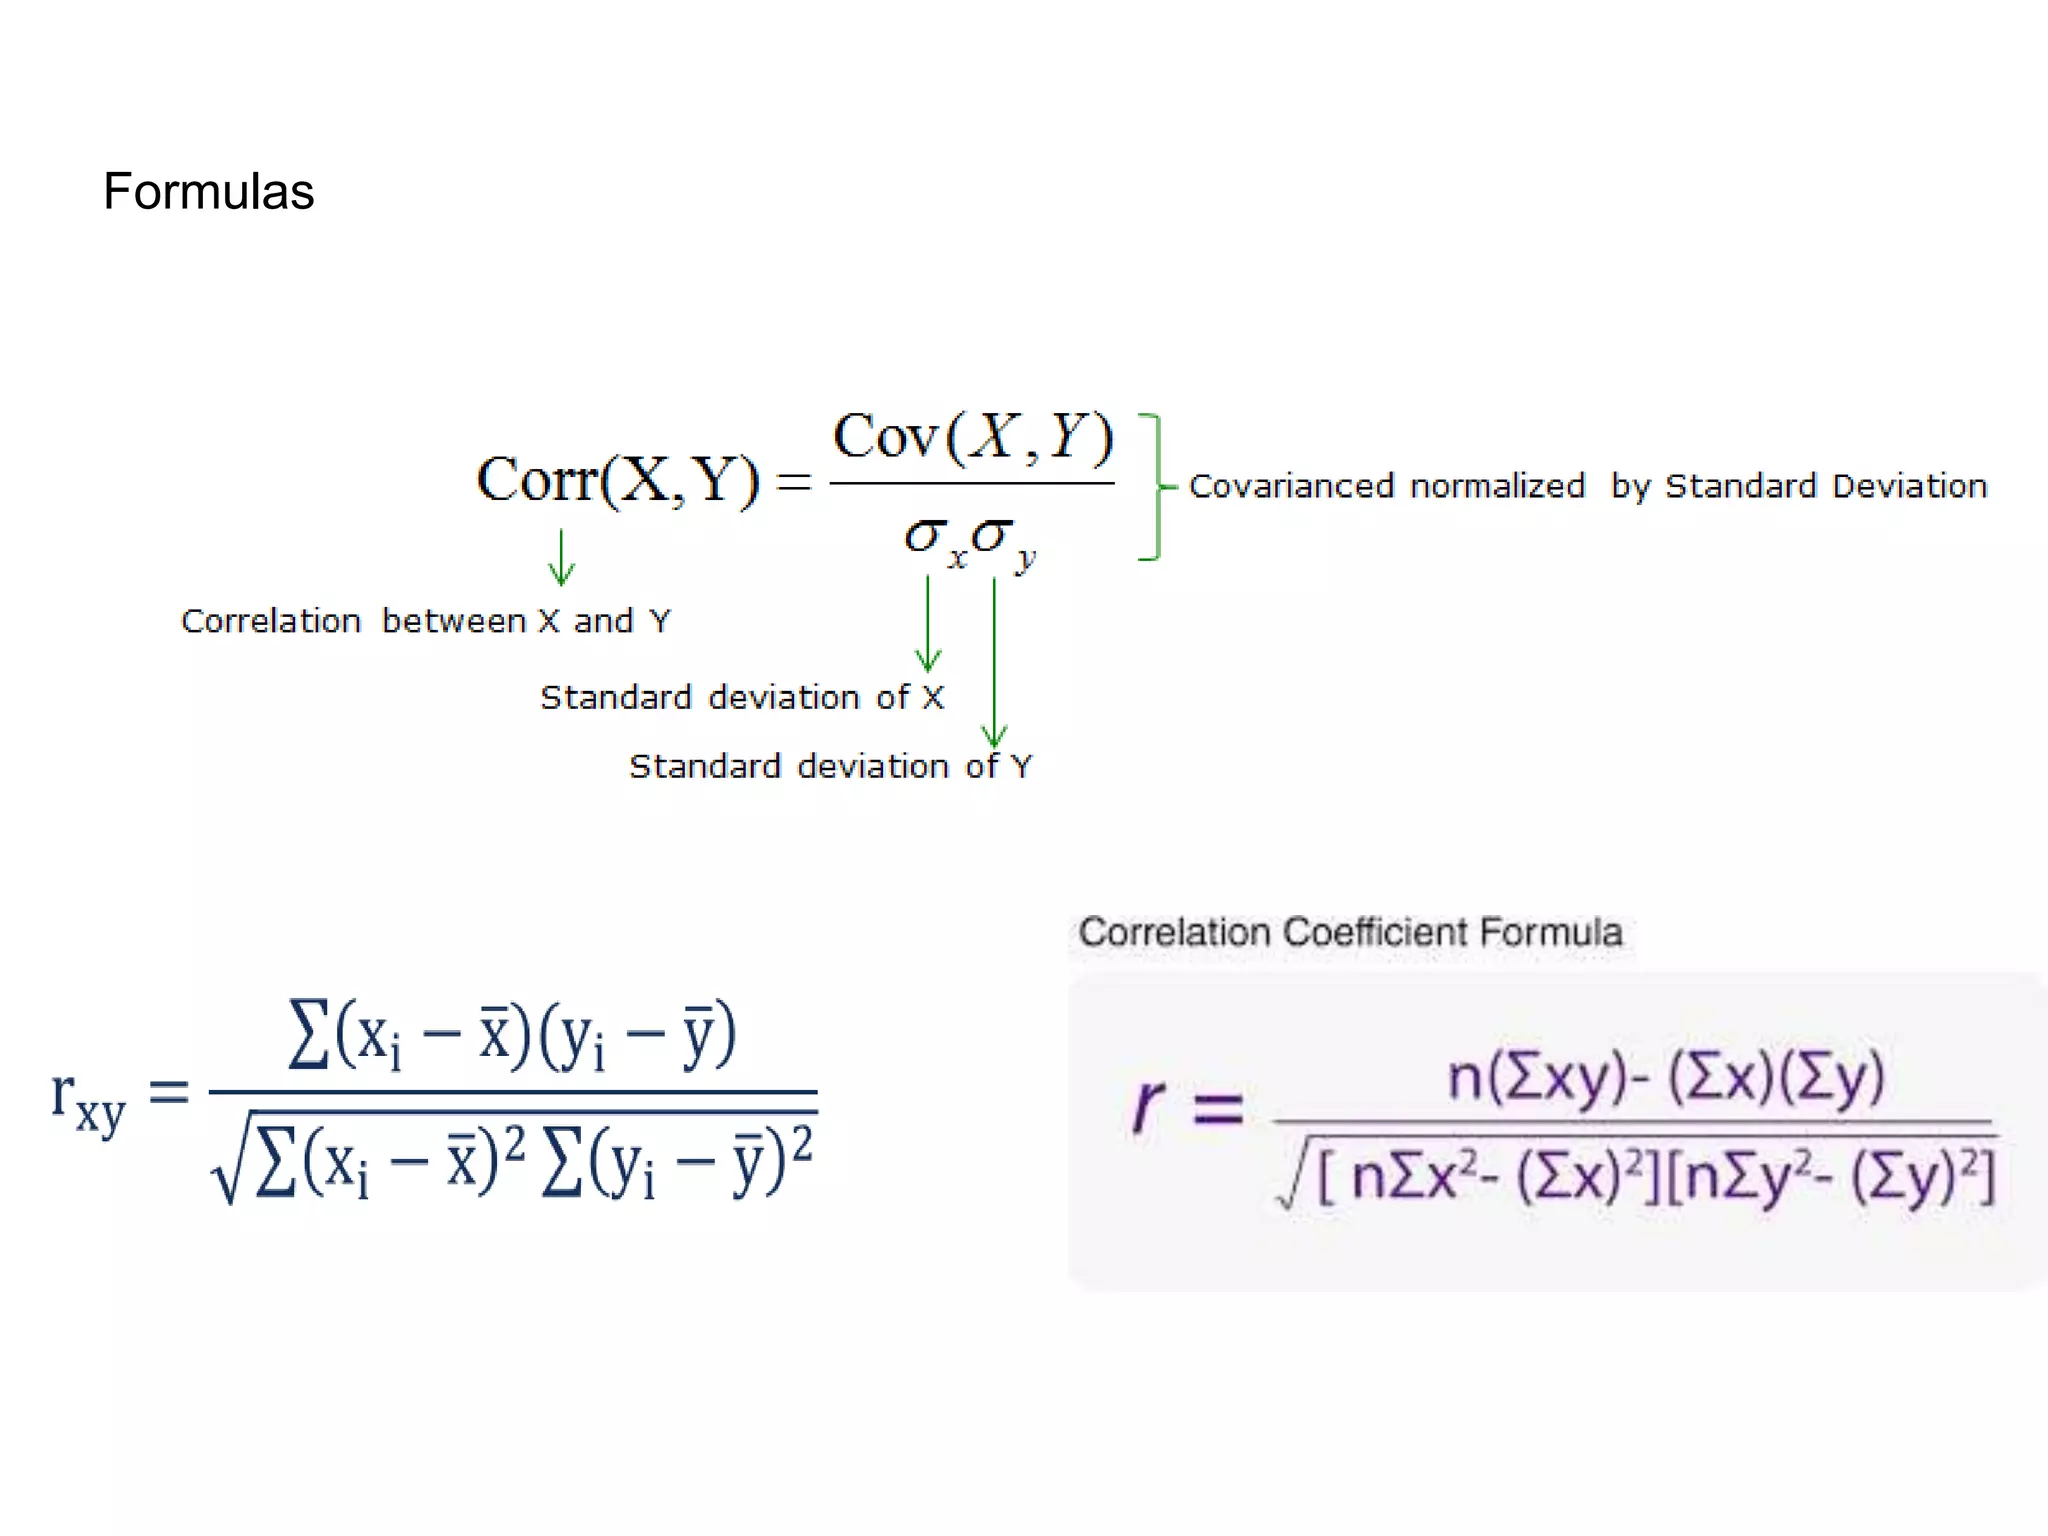
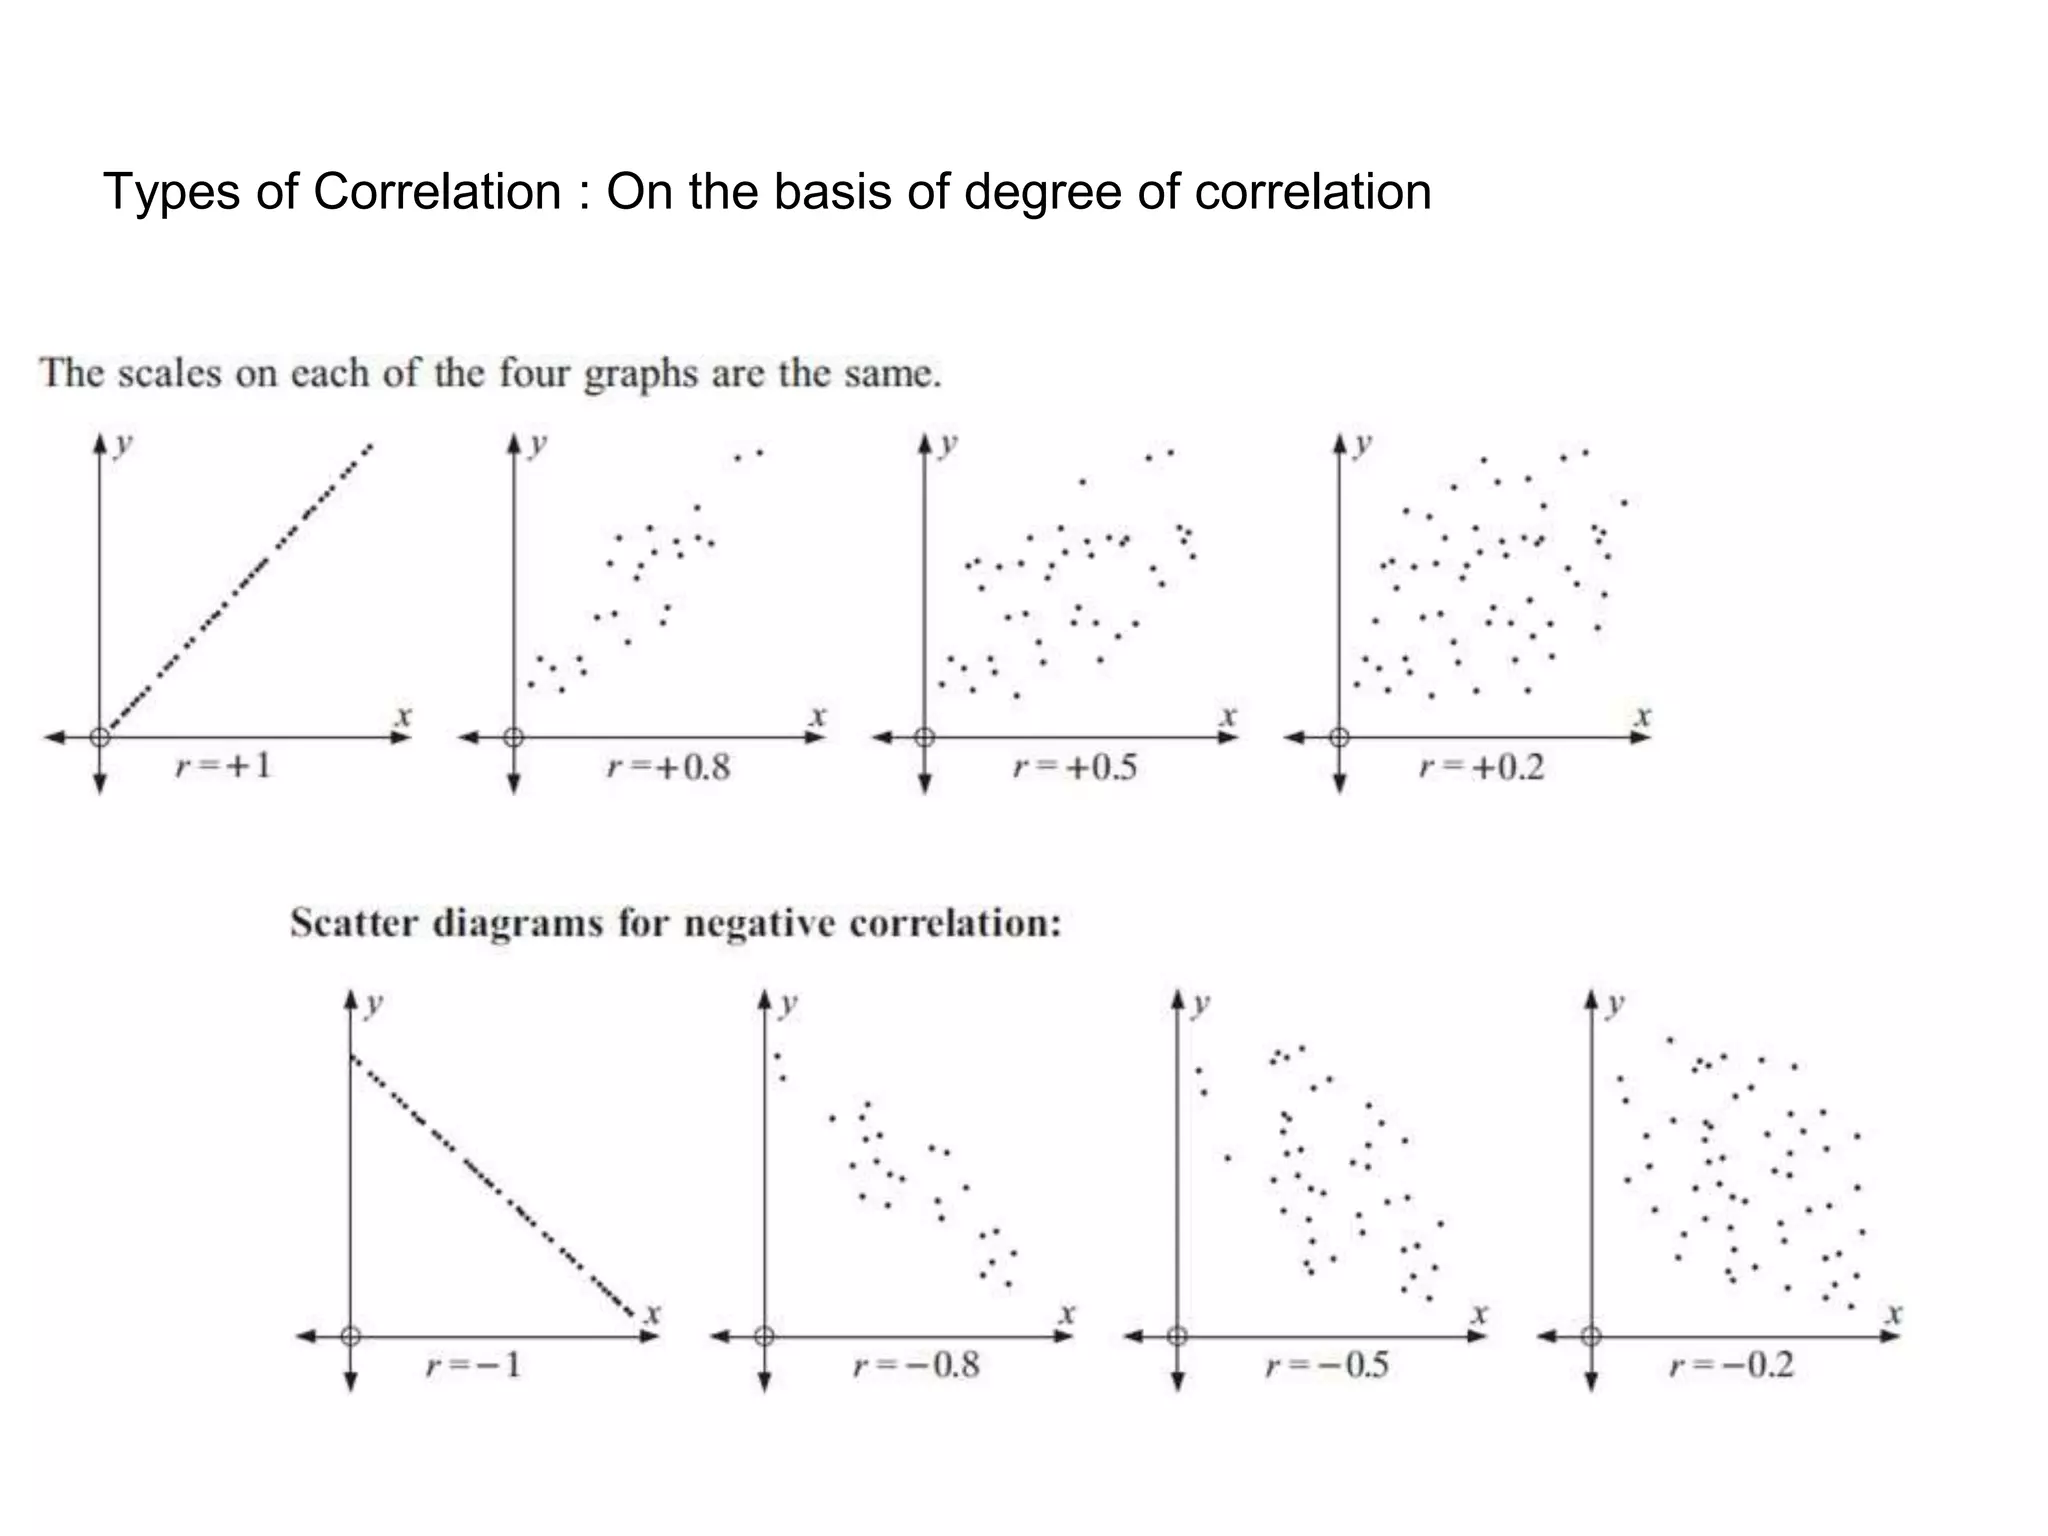
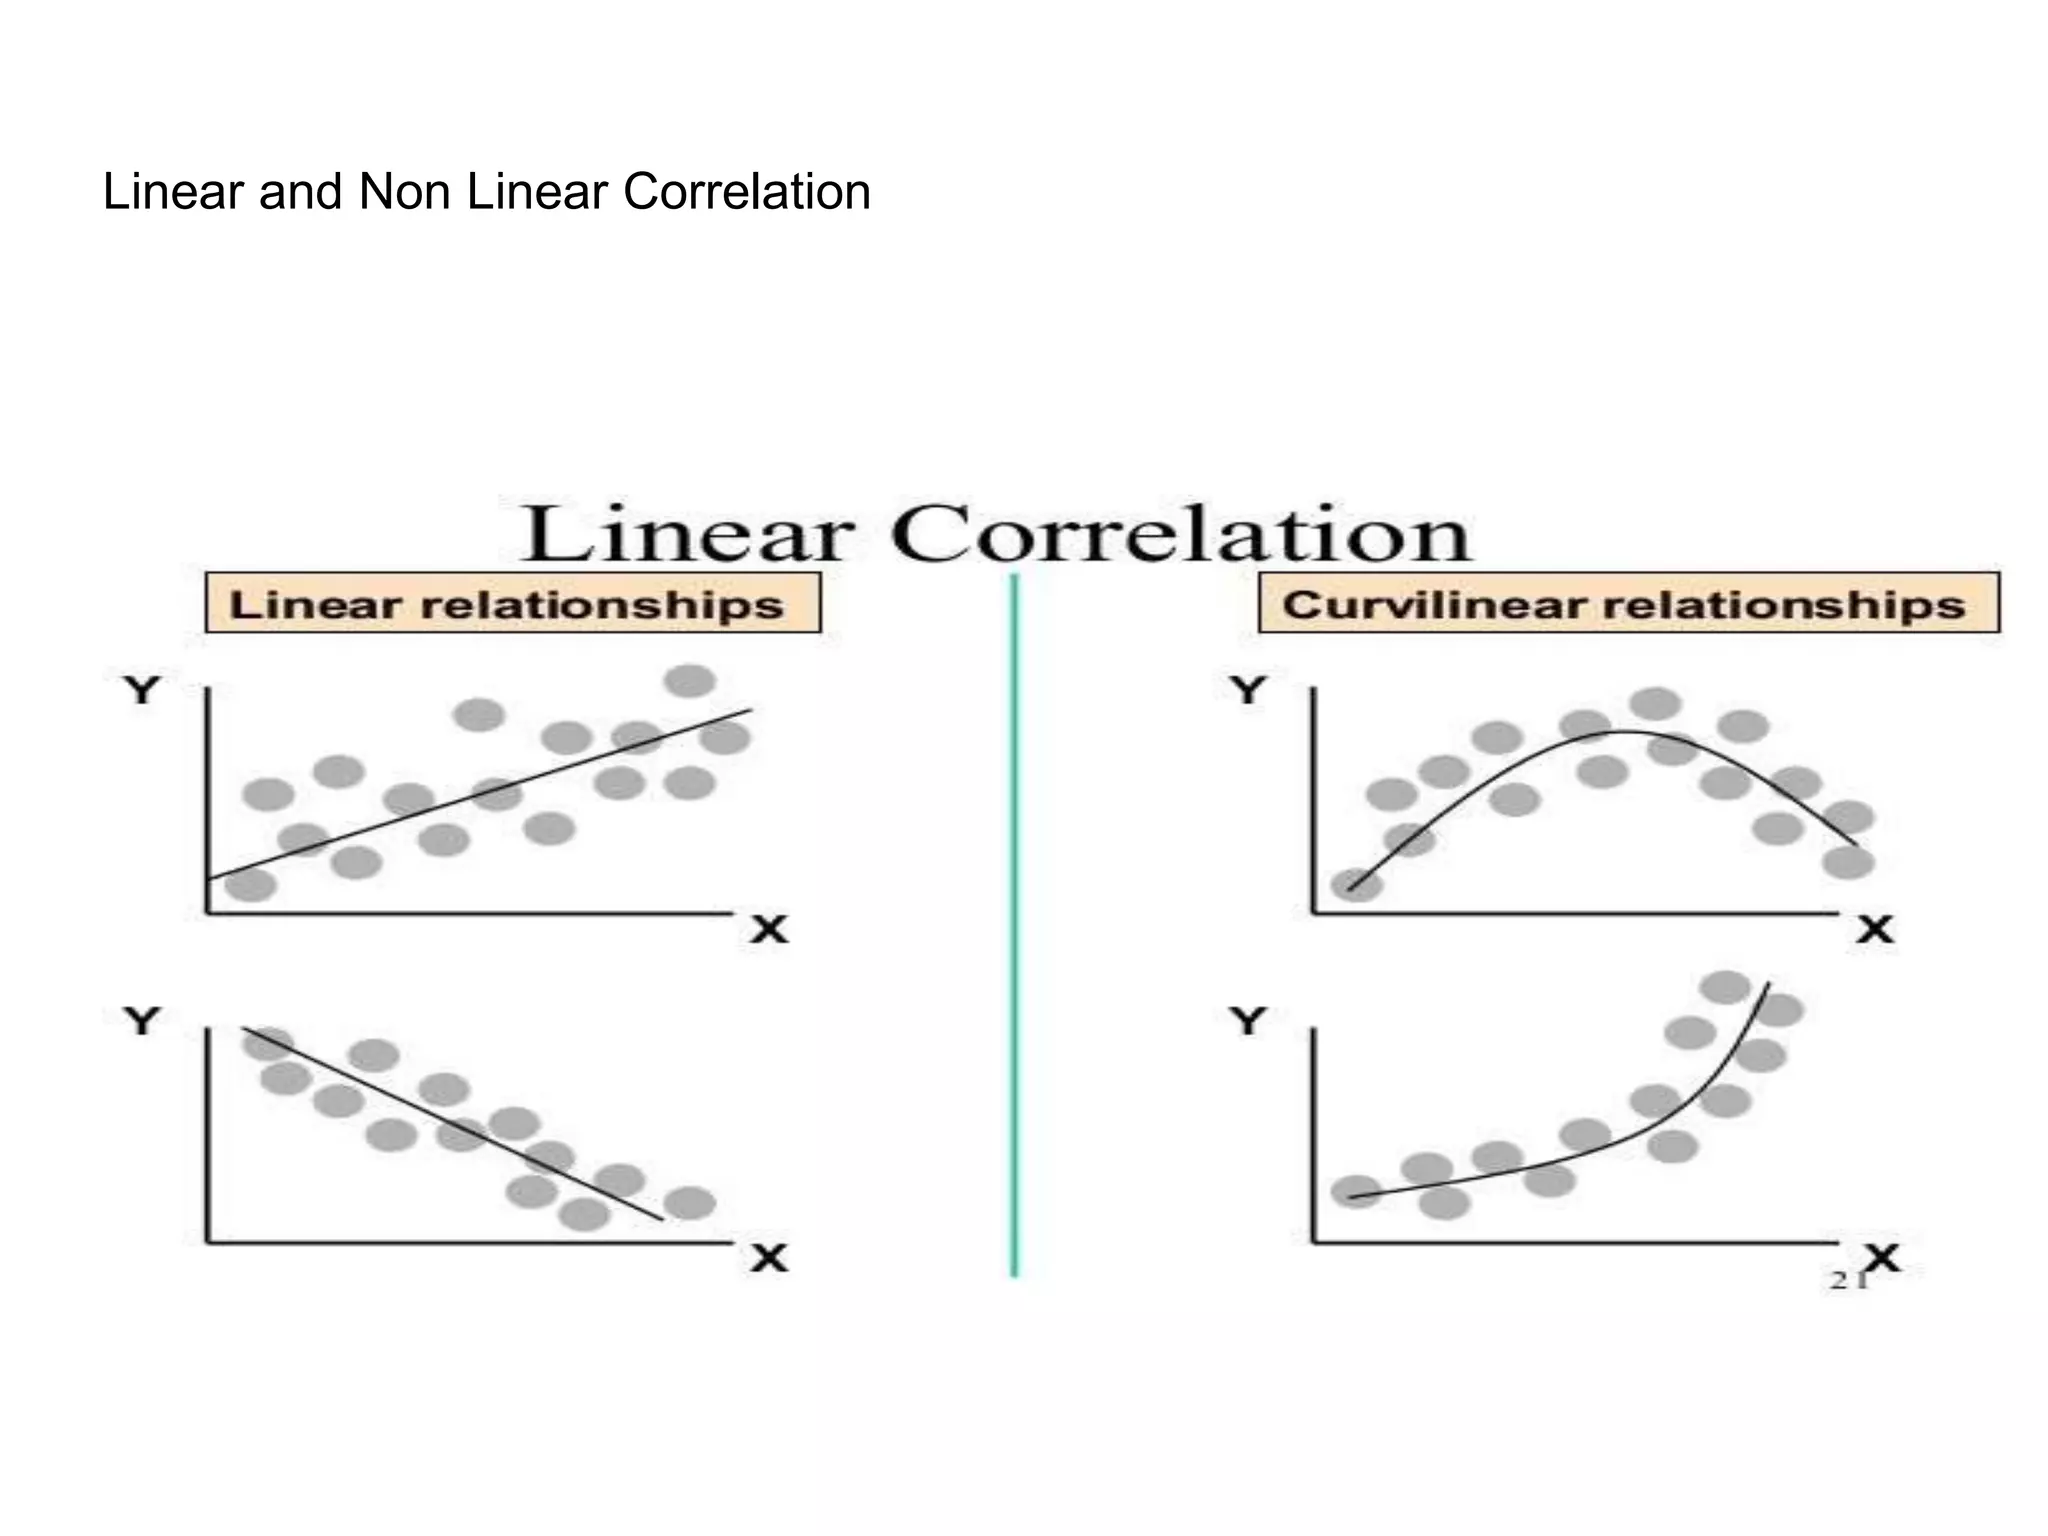
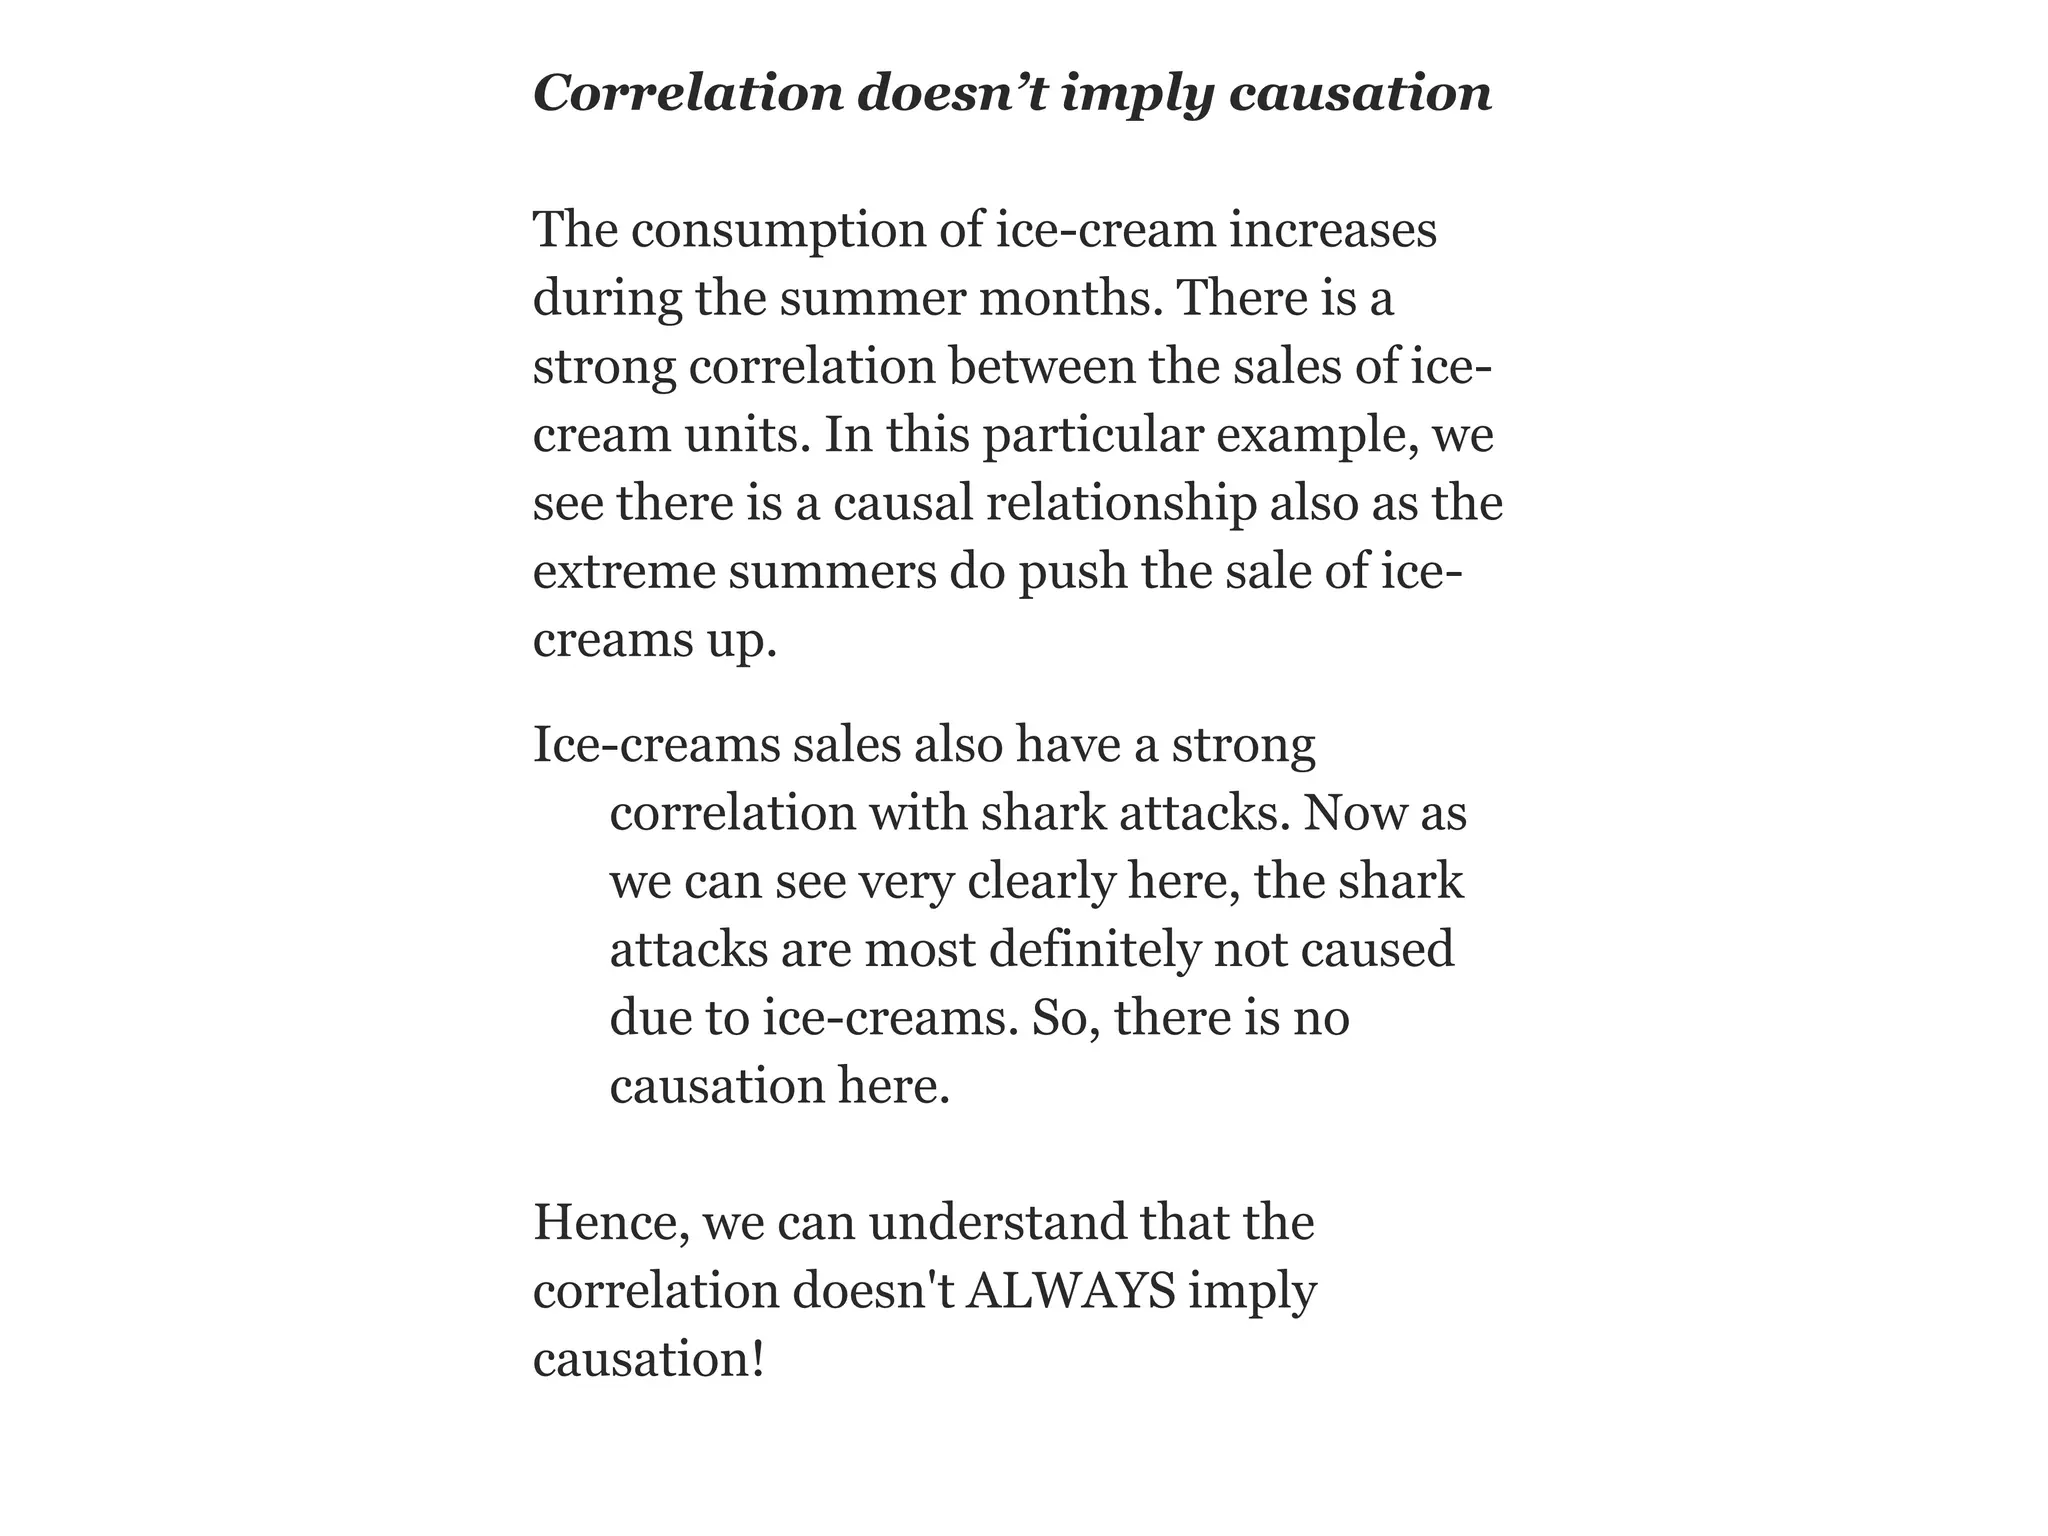
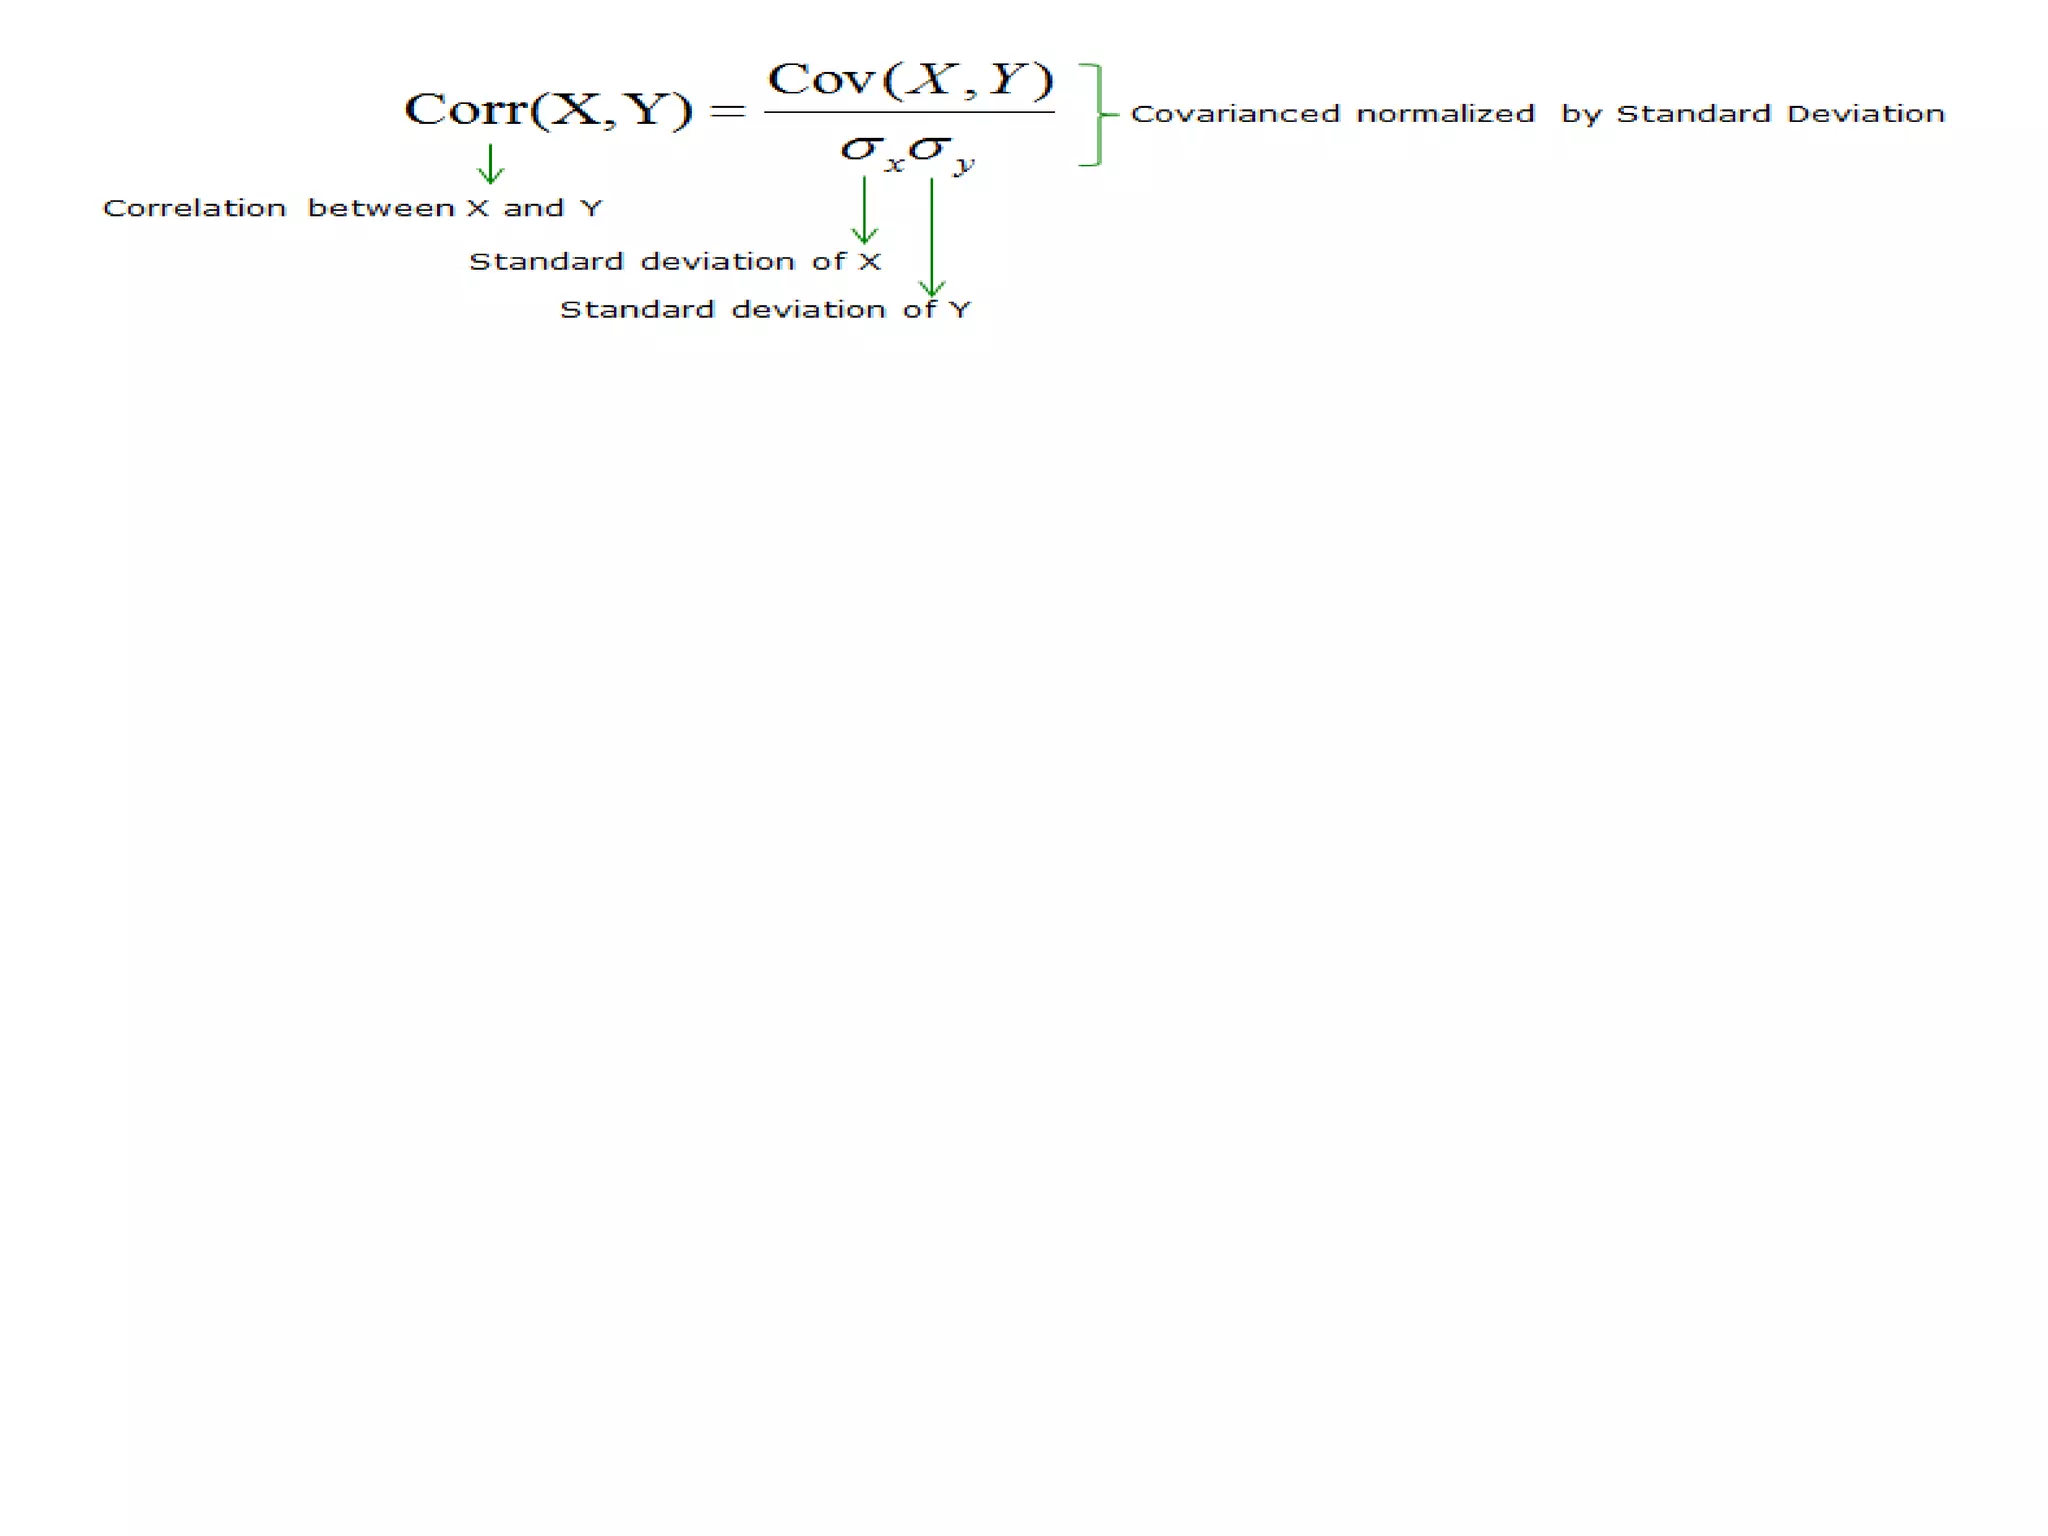
COVARIANCE & CORRELATION
How to understand the relation between two variables?
Scatter Diagram
Suppose we have two variables say:
Age of the rider
Speed of the motor cycle
Age (Years): 16 22 34 45 21 24 27 53 32 24 26 29
Speed(Km/hr): 62 60 45 46 50 55 54 30 36 39 48 50
Age Speed
16 62
22 60
34 45
45 46
21 50
24 55
27 54
53 30
32 36
24 39
26 48
29 50
(16, 62)
(22, 60)
Covariance :Test of Relationship
 Covariance is a measure of how much two random variables vary together.
 It's similar to variance, but where variance tells you how a single variable varies.
 Covariance tells you how two variables vary together.
 A positive value of covariance between two variables indicates a positive
relationship between them. This means that if one variable deviates from the
mean in one direction, the other variable will also deviate from its mean in
the same direction.
 A negative covariance between two variables indicates a negative relationship
between them.
 The problem of measuring the relationship between two variables by using
covariance is that it is not a standardized measure of relationship.
Covariance & Correlation
 Covariance is a measure of how much two random variables vary together from
its mean.
 Correlation is the degree of inter-relatedness among the two
or more variables.
 Correlation analysis is a process to find out the degree of relationship
between two or more variables by applying various statistical tools and
techniques.
 Term correlation coined by Karl Pearson in 1902.
 Denoted by r
 Value lies between -1 and+1
Formulas
Correlation
Correlation only measures the extent of relationship between
variables
Karl Pearson (1867 – 1936), a British Biometrician, developed the
formula for Correlation Coefficient.
The correlation coefficient between two variables X and Y are
denoted by r(X,Y) or rx,y.
Coefficient of Correlation
• The coefficient of correlation gives a mathematical value
for measuring the strength of the linear relationship between two
variables.
• A linear relationship (or linear association) is a statistical term used to
describe a straight-line relationship between a variable and a constant.
• It can take values from –1 to 1.
• r= +0.6 ……………………………………Positive
Correlation
• r= -0.7 …………………………………….Negative
Correlation
• Correlation is the concept of linear relationship between two variables.
Whereas correlation coefficient is a measure that measures linear relationship
between two variables
Assumptions of Pearson Product Moment Correlation
 Quantitative Measure
 Linearity:X andY should be linearly related
 Absence of Outliers:There Should be no outliers
 Normality
 Minimum 30Observations
Application
 Relationship between variables like Job satisfactionand
turnover intention.
 Market risk and ScripPrice
 Satisfaction and purchaseintention
 Yield of rice and rainfall
 ICT use and learning effectiveness
Methods of Studying Correlation
 Scatter Diagram Method
 Karl Pearson Coefficient of Correlation
 Spearman’s Rank Correlation Coefficient- Measure of the non-
parametric correlation between two ordinal variables. (Rank
Correlation)
Types of Correlation
On the basis
of degree of
correlation
Positive
correlation
Negative
correlation
On the basis
of number of
variables
Simple
correlation
Partial
correlation
Multiple
correlation
On the basis
of
linearity
Linear
correlation
Non –linear
correlation
Correlation on basis of number of variables
Simple Correlation – Sales & Expense , Income and Consumption
Partial Correlation – Height , Weight and Age – Effect of third variable “ Age” on height and weight
Multiple Correlation-Rainfall and temperature on the yield of wheat , Sales with Advertisement and No of Sales Persons
Types of Correlation : On the basis of degree of correlation
Linear and Non Linear Correlation
Height Weight
Age
0.
92
Correlation doesn’t imply causation
The consumption of ice-cream increases
during the summer months. There is a
strong correlation between the sales of ice-
cream units. In this particular example, we
see there is a causal relationship also as the
extreme summers do push the sale of ice-
creams up.
Ice-creams sales also have a strong
correlation with shark attacks. Now as
we can see very clearly here, the shark
attacks are most definitely not caused
due to ice-creams. So, there is no
causation here.
Hence, we can understand that the
correlation doesn't ALWAYS imply
causation!
Problem 1) Calculate Karl Pearson coeff of correlation for the following
data
Problem : Variance –Covariance Method
If Variance between X and Y variables is 12.5 and Variance of X and Y are
respectively 16.4 and 13.8 , find the coeficient of correlation between them
Problem 2) If covariance between X and Y variables is 12.5 and the variance
of X and Y are 16.4 and 13.8 , find coeff of correlation between them
Problem: Find coeff of correlation between X
and Y by square of values method /Product
Moment Method
Road Rash
The age of 12 motor cycle riders and their average speed while driving are as follows:
Age (Years): 16 22 34 45 21 24 27 53 32 24 26 29
Speed(Km/hr): 62 60 45 46 50 55 54 30 36 39 48 50
The Correlation Coefficient is -0.7281
Height and Weight Weight
(KG) Height (Cms)
56 149
78 164
66 157
63 155
49 159
48 156
52 169
50 163
72 176
79 177
82 175
48 144
56 164
68 169
59 165
Interpretation: The correlation is
positive and high i.e. Height and Weight
are positively related.
This indicates that as height of an
individual increases the weight shall
also increase and vice versa.
The Correlation Coefficient is 0.6551
Rank Correlation Coefficient
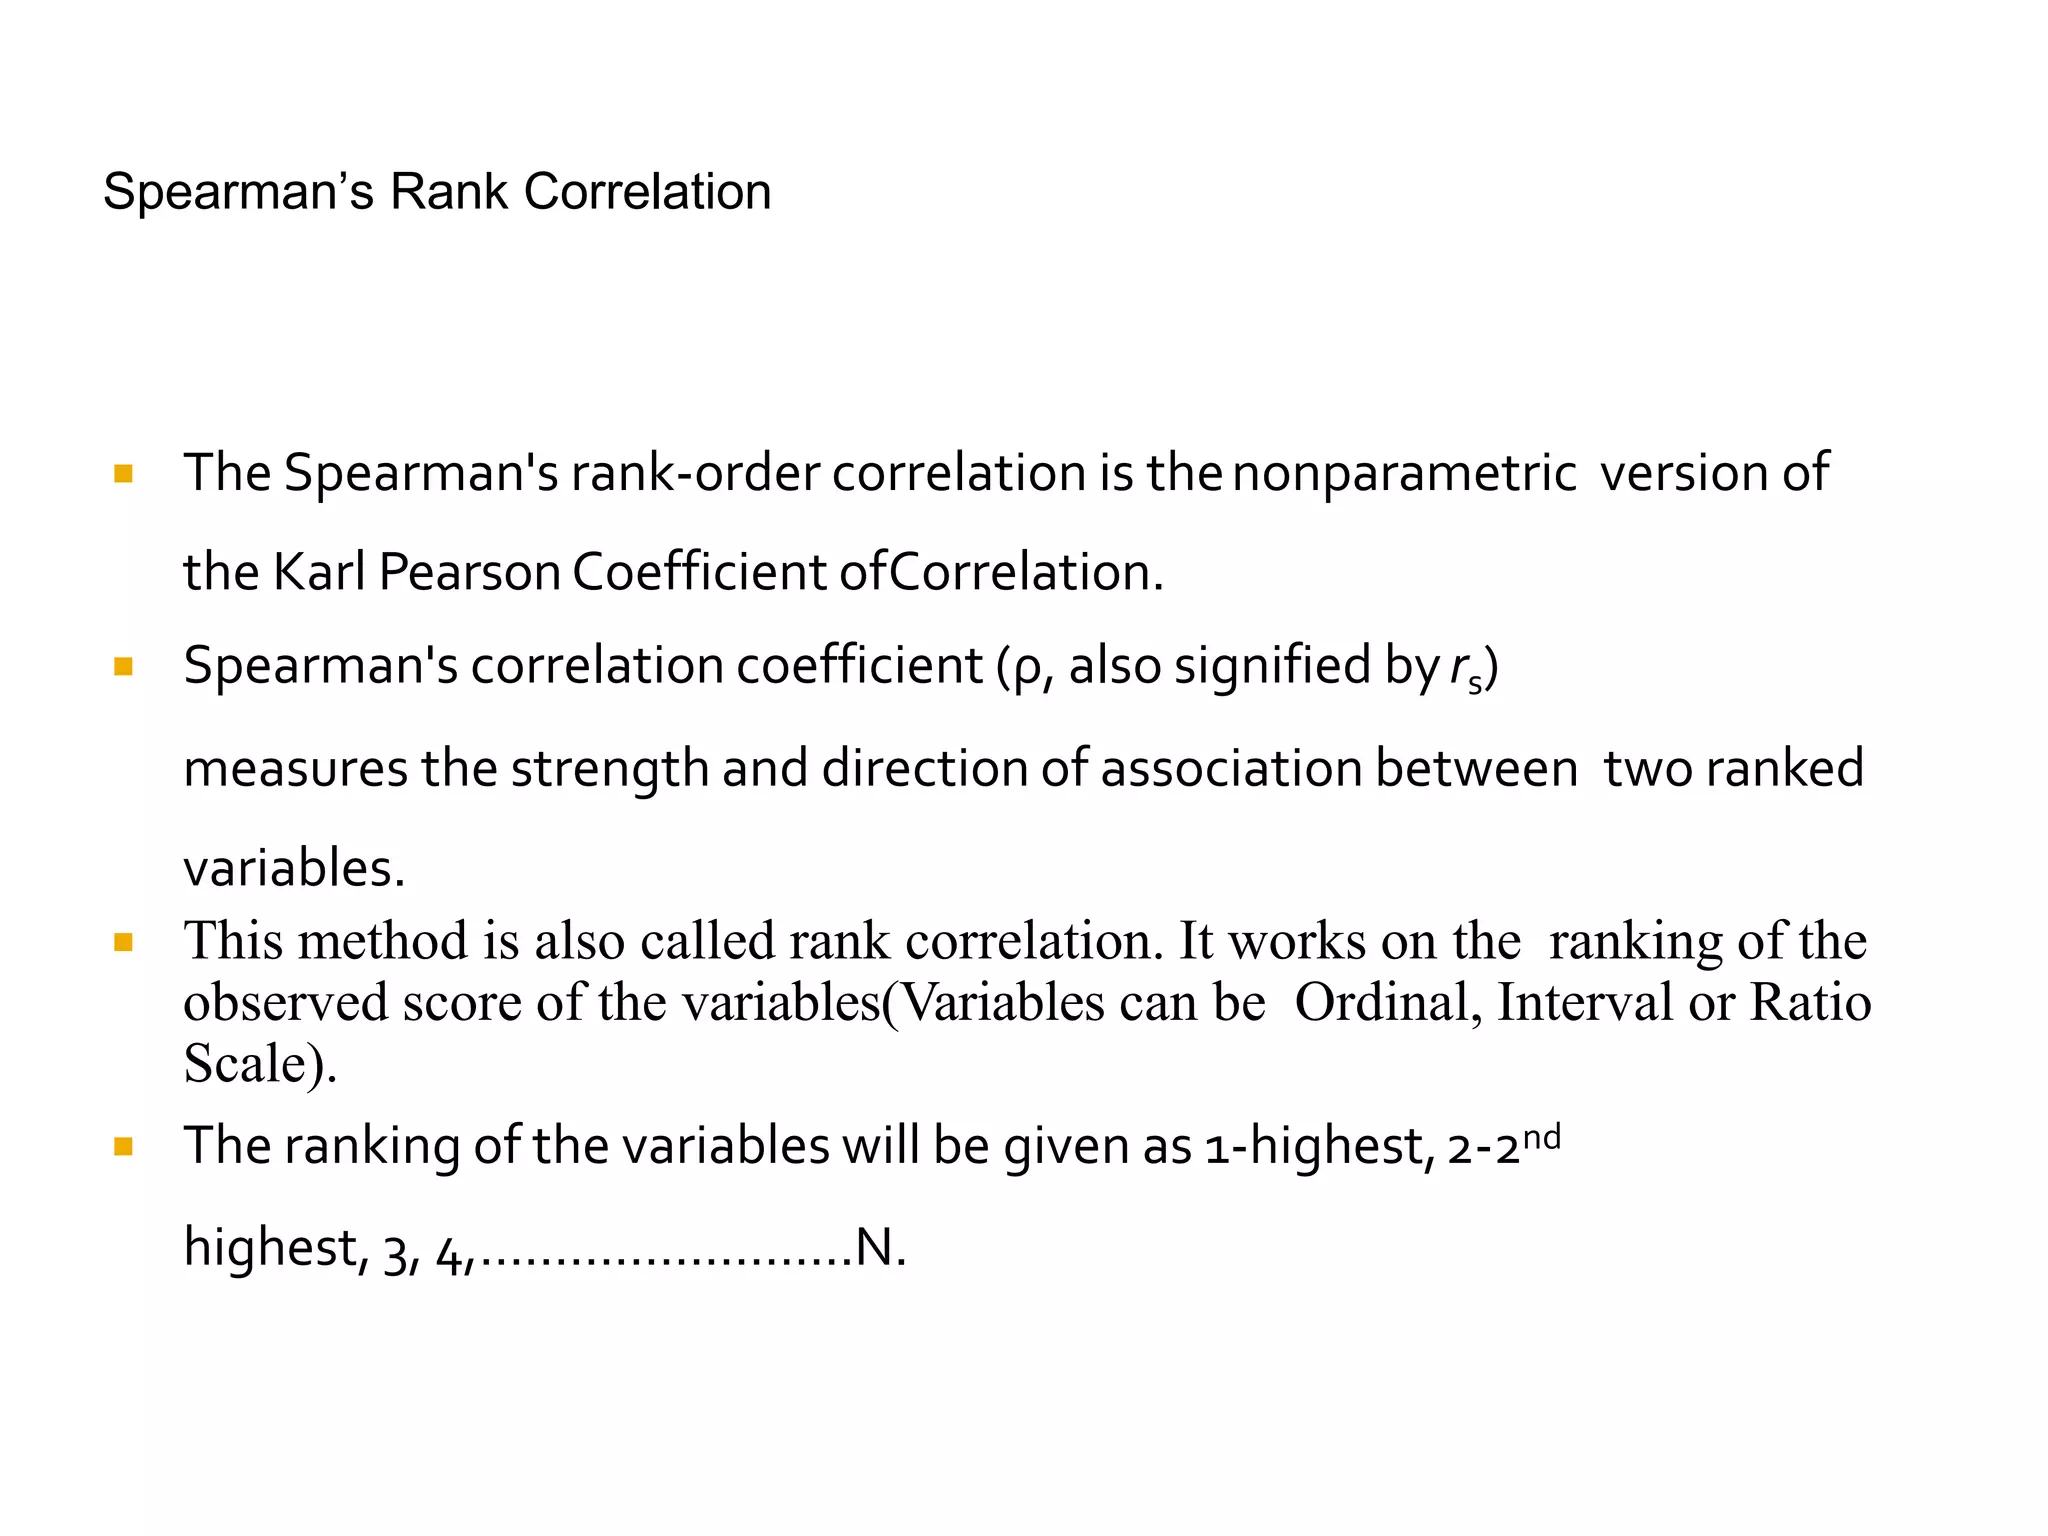
This correlation formula is used when relation between two variable are studied in
terms of the ranking of each case within each variable.
Mostly used when both the variables relate to some attribute.
Appropriate for data sets that are ordinal in nature.
The range is from [ -1, 1]
Spearman’s Rank Correlation
 The Spearman's rank-order correlation is thenonparametric version of
the Karl PearsonCoefficient ofCorrelation.
 Spearman's correlation coefficient (ρ, also signified byrs)
measures the strength and direction of association between two ranked
variables.
 This method is also called rank correlation. It works on the ranking of the
observed score of the variables(Variables can be Ordinal, Interval or Ratio
Scale).
 The ranking of the variables will be given as 1-highest,2-2nd
highest, 3, 4,…………………….N.
Formula
Relation between two attributes Beauty and Intelligence
Subject Score X Score Y
A 7.1 61
B 7.4 53
C 7.9 76
D 6.3 43
E 8.3 73
F 9.6 77
G 7.6 69
H 8.8 81
I 5.9 47
J 6.6 36
X represents beauty
Y represents intelligence
Are X and Y related?
)
1
(
6
1 2
2




n
n
di

Rank X Rank Y
7 6
6 7
4 3
9 8
3 4
1 2
5 5
2 1
10 9
8 10
Subject Rank X
(RX)
Rank Y
(RY )
di = RX – RY di
2
1 7 6 1 1
2 6 7 -1 1
3 4 3 1 1
4 9 8 1 1
5 3 4 -1 1
6 1 2 -1 1
7 5 5 0 0
8 2 1 1 1
9 10 9 1 1
10 8 10 -2 4
di
2 =12
98
.
0
)
1
10
(
10
12
6
1
)
1
(
6
1 2
2
2









n
n
di

Rank Correlation can be interpreted in the same fashion as
the Karl Pearson Correlation Coefficient
Movie Ranking by 3 Critics .Whats the correlation
Year Movie TOI Critic TOI User IMDB
2020Angrezi Medium 3.5 3.5 7.3
2020Baaghi 3 2.5 2.8 2
2020Thappad 4.5 4.1 6.9
2020
Shubh Mangal Zyada
Saavdhan 3.5 3.4 5.9
2020Bhoot - Part 1 2.5 3 5.5
2020Love aaj kal 3 3.1 5
2020Hacked 2 2.5 4.2
2020Shikara 3 3.2 3.3
2020Malang 3.5 3.4 6.5
2020Jawaani Janeman 3.5 3.4 6.7
2020Panga 4 3.9 7
2020Street Dancer 3D 3.5 3.4 3.6
2020Jai Mummy DI 2 2.5 3.5
2020Tanhji - The Unsung Warrior 4 4.3 7.7
2020Chhapaak 3.5 3.4 5

Topic 5 Covariance & Correlation.pptx

  • 1.
  • 2.
    How to understandthe relation between two variables?
  • 3.
    Scatter Diagram Suppose wehave two variables say: Age of the rider Speed of the motor cycle Age (Years): 16 22 34 45 21 24 27 53 32 24 26 29 Speed(Km/hr): 62 60 45 46 50 55 54 30 36 39 48 50
  • 4.
    Age Speed 16 62 2260 34 45 45 46 21 50 24 55 27 54 53 30 32 36 24 39 26 48 29 50 (16, 62) (22, 60)
  • 6.
    Covariance :Test ofRelationship  Covariance is a measure of how much two random variables vary together.  It's similar to variance, but where variance tells you how a single variable varies.  Covariance tells you how two variables vary together.  A positive value of covariance between two variables indicates a positive relationship between them. This means that if one variable deviates from the mean in one direction, the other variable will also deviate from its mean in the same direction.  A negative covariance between two variables indicates a negative relationship between them.  The problem of measuring the relationship between two variables by using covariance is that it is not a standardized measure of relationship.
  • 12.
    Covariance & Correlation Covariance is a measure of how much two random variables vary together from its mean.  Correlation is the degree of inter-relatedness among the two or more variables.  Correlation analysis is a process to find out the degree of relationship between two or more variables by applying various statistical tools and techniques.  Term correlation coined by Karl Pearson in 1902.  Denoted by r  Value lies between -1 and+1
  • 15.
  • 16.
    Correlation Correlation only measuresthe extent of relationship between variables Karl Pearson (1867 – 1936), a British Biometrician, developed the formula for Correlation Coefficient. The correlation coefficient between two variables X and Y are denoted by r(X,Y) or rx,y.
  • 17.
    Coefficient of Correlation •The coefficient of correlation gives a mathematical value for measuring the strength of the linear relationship between two variables. • A linear relationship (or linear association) is a statistical term used to describe a straight-line relationship between a variable and a constant. • It can take values from –1 to 1. • r= +0.6 ……………………………………Positive Correlation • r= -0.7 …………………………………….Negative Correlation • Correlation is the concept of linear relationship between two variables. Whereas correlation coefficient is a measure that measures linear relationship between two variables
  • 18.
    Assumptions of PearsonProduct Moment Correlation  Quantitative Measure  Linearity:X andY should be linearly related  Absence of Outliers:There Should be no outliers  Normality  Minimum 30Observations
  • 19.
    Application  Relationship betweenvariables like Job satisfactionand turnover intention.  Market risk and ScripPrice  Satisfaction and purchaseintention  Yield of rice and rainfall  ICT use and learning effectiveness
  • 20.
    Methods of StudyingCorrelation  Scatter Diagram Method  Karl Pearson Coefficient of Correlation  Spearman’s Rank Correlation Coefficient- Measure of the non- parametric correlation between two ordinal variables. (Rank Correlation)
  • 21.
    Types of Correlation Onthe basis of degree of correlation Positive correlation Negative correlation On the basis of number of variables Simple correlation Partial correlation Multiple correlation On the basis of linearity Linear correlation Non –linear correlation
  • 22.
    Correlation on basisof number of variables Simple Correlation – Sales & Expense , Income and Consumption Partial Correlation – Height , Weight and Age – Effect of third variable “ Age” on height and weight Multiple Correlation-Rainfall and temperature on the yield of wheat , Sales with Advertisement and No of Sales Persons
  • 23.
    Types of Correlation: On the basis of degree of correlation
  • 24.
    Linear and NonLinear Correlation
  • 25.
  • 27.
    Correlation doesn’t implycausation The consumption of ice-cream increases during the summer months. There is a strong correlation between the sales of ice- cream units. In this particular example, we see there is a causal relationship also as the extreme summers do push the sale of ice- creams up. Ice-creams sales also have a strong correlation with shark attacks. Now as we can see very clearly here, the shark attacks are most definitely not caused due to ice-creams. So, there is no causation here. Hence, we can understand that the correlation doesn't ALWAYS imply causation!
  • 28.
    Problem 1) CalculateKarl Pearson coeff of correlation for the following data
  • 30.
    Problem : Variance–Covariance Method If Variance between X and Y variables is 12.5 and Variance of X and Y are respectively 16.4 and 13.8 , find the coeficient of correlation between them
  • 31.
    Problem 2) Ifcovariance between X and Y variables is 12.5 and the variance of X and Y are 16.4 and 13.8 , find coeff of correlation between them
  • 33.
    Problem: Find coeffof correlation between X and Y by square of values method /Product Moment Method
  • 35.
    Road Rash The ageof 12 motor cycle riders and their average speed while driving are as follows: Age (Years): 16 22 34 45 21 24 27 53 32 24 26 29 Speed(Km/hr): 62 60 45 46 50 55 54 30 36 39 48 50 The Correlation Coefficient is -0.7281
  • 36.
    Height and WeightWeight (KG) Height (Cms) 56 149 78 164 66 157 63 155 49 159 48 156 52 169 50 163 72 176 79 177 82 175 48 144 56 164 68 169 59 165 Interpretation: The correlation is positive and high i.e. Height and Weight are positively related. This indicates that as height of an individual increases the weight shall also increase and vice versa. The Correlation Coefficient is 0.6551
  • 37.
    Rank Correlation Coefficient Thiscorrelation formula is used when relation between two variable are studied in terms of the ranking of each case within each variable. Mostly used when both the variables relate to some attribute. Appropriate for data sets that are ordinal in nature. The range is from [ -1, 1]
  • 38.
    Spearman’s Rank Correlation The Spearman's rank-order correlation is thenonparametric version of the Karl PearsonCoefficient ofCorrelation.  Spearman's correlation coefficient (ρ, also signified byrs) measures the strength and direction of association between two ranked variables.  This method is also called rank correlation. It works on the ranking of the observed score of the variables(Variables can be Ordinal, Interval or Ratio Scale).  The ranking of the variables will be given as 1-highest,2-2nd highest, 3, 4,…………………….N.
  • 39.
  • 40.
    Relation between twoattributes Beauty and Intelligence Subject Score X Score Y A 7.1 61 B 7.4 53 C 7.9 76 D 6.3 43 E 8.3 73 F 9.6 77 G 7.6 69 H 8.8 81 I 5.9 47 J 6.6 36 X represents beauty Y represents intelligence Are X and Y related? ) 1 ( 6 1 2 2     n n di  Rank X Rank Y 7 6 6 7 4 3 9 8 3 4 1 2 5 5 2 1 10 9 8 10
  • 41.
    Subject Rank X (RX) RankY (RY ) di = RX – RY di 2 1 7 6 1 1 2 6 7 -1 1 3 4 3 1 1 4 9 8 1 1 5 3 4 -1 1 6 1 2 -1 1 7 5 5 0 0 8 2 1 1 1 9 10 9 1 1 10 8 10 -2 4 di 2 =12 98 . 0 ) 1 10 ( 10 12 6 1 ) 1 ( 6 1 2 2 2          n n di  Rank Correlation can be interpreted in the same fashion as the Karl Pearson Correlation Coefficient
  • 42.
    Movie Ranking by3 Critics .Whats the correlation Year Movie TOI Critic TOI User IMDB 2020Angrezi Medium 3.5 3.5 7.3 2020Baaghi 3 2.5 2.8 2 2020Thappad 4.5 4.1 6.9 2020 Shubh Mangal Zyada Saavdhan 3.5 3.4 5.9 2020Bhoot - Part 1 2.5 3 5.5 2020Love aaj kal 3 3.1 5 2020Hacked 2 2.5 4.2 2020Shikara 3 3.2 3.3 2020Malang 3.5 3.4 6.5 2020Jawaani Janeman 3.5 3.4 6.7 2020Panga 4 3.9 7 2020Street Dancer 3D 3.5 3.4 3.6 2020Jai Mummy DI 2 2.5 3.5 2020Tanhji - The Unsung Warrior 4 4.3 7.7 2020Chhapaak 3.5 3.4 5