Downloaded 364 times


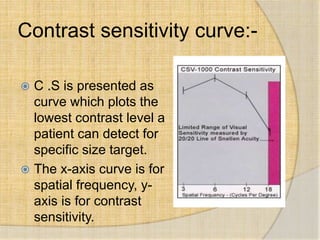

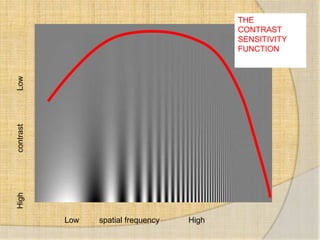


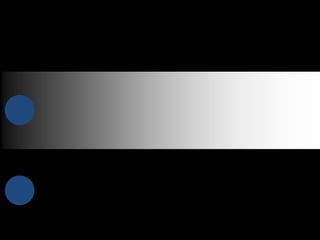


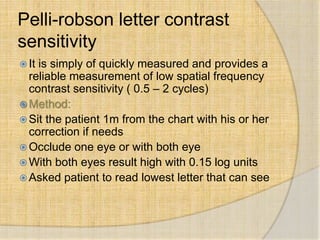
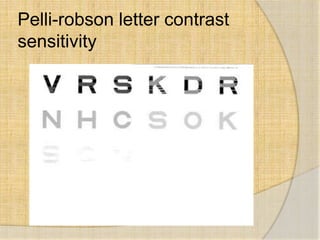


Contrast sensitivity refers to the ability to see objects that have low contrasts or do not stand out clearly from their backgrounds. It is measured using charts with different spatial frequencies and contrast levels to determine the minimum contrast needed to see a target. Contrast sensitivity is affected by many eye diseases and conditions more subtly than visual acuity and can provide early detection of problems. It is tested using various charts like Pelli-Robson, Cambridge Low Contrast Gratings, and Functional Acuity Contrast Testing (FACT) that evaluate contrast sensitivity levels at different spatial frequencies.


![Contrast sensitivity and glare discomfort [Autosaved].pptx](https://cdn.slidesharecdn.com/ss_thumbnails/contrastsensitivityandglarediscomfortautosaved-250419142217-06d6a009-thumbnail.jpg?width=640&height=640&fit=bounds)


