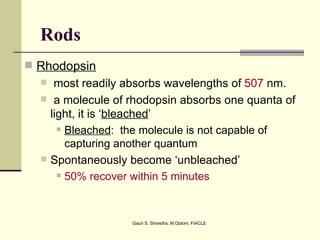
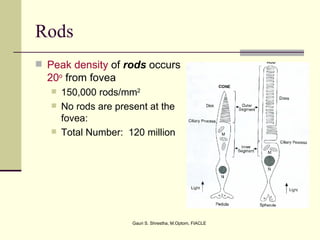
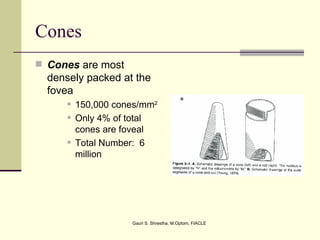
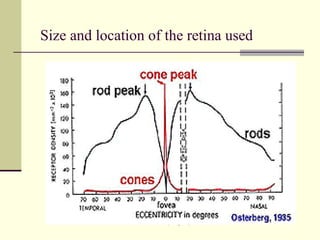
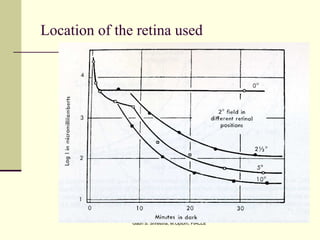
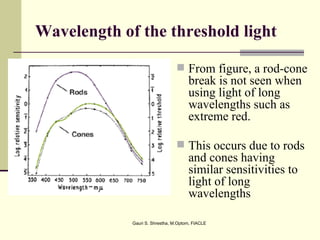
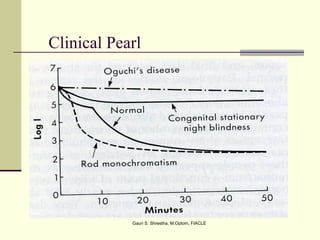
Light and Dark Adaptation


Gauri S. Shrestha, M. Optom, FIACLE
      Lecturer, BPKLCOS, IOM
Rods
 Rhodopsin
      most readily absorbs wavelengths of 507 nm.
      a molecule of rhodopsin absorbs one quanta of
      light, it is ‘bleached’
         Bleached: the molecule is not capable of

          capturing another quantum
     Spontaneously become ‘unbleached’
         50% recover within 5 minutes


                     Gauri S. Shrestha, M.Optom, FIACLE
Rods
 Peak density of rods occurs
  20o from fovea
      150,000 rods/mm2
      No rods are present at the
       fovea:
      Total Number: 120 million


                       Gauri S. Shrestha, M.Optom, FIACLE
Cones
 Cones are most
  densely packed at the
  fovea
         150,000 cones/mm2
         Only 4% of total
          cones are foveal
         Total Number: 6
          million


                     Gauri S. Shrestha, M.Optom, FIACLE
Cones

 3 types of cone photopigments:
    Erythrolabe: maximum absorption at 565 nm
       ‘Long wavelength cones’ (L-cones), red cones

    Chlorolabe: maximum absorption at 535 nm
       ‘Middle wavelength cones’ (M-cones), green cones

    Cyanolabe: maximum absorption at 430 nm
       ‘Short wavelength cones’ (S-cones), blue cones


 Recover from bleaching more rapidly than rhodopsin
      50% of cones will recover within 1.5 minutes


                        Gauri S. Shrestha, M.Optom, FIACLE
Specific Cone Distribution
 Ratio of L-cones to M-cones to S-cones = 16/8/1
 S-cones are less numerous than either L-cones or
  M-cones.
 No S-cones at the fovea
      Peak distribution occurs just outside the fovea
         Small field Tritanopia

            unable to see small blue objects when centrally
             fixated


                        Gauri S. Shrestha, M.Optom, FIACLE
Observations
 Choose particular wave
  length and increase intensity


  Change the wave length
   from high frequency to low
   frequency

                                 Chromatic interval=0
                           Gauri S. Shrestha, M.Optom, FIACLE
Visual Thresholds
 Minimum amount of energy required for a patient to detect a
  stimulus
 low threshold = high sensitivity
    Threshold = 1/Sensitivity
 Scotopic Threshold:
    threshold of a patient measured in dim light conditions
     (night)
 Photopic Threshold:
    threshold of a patient measured in bright light conditions
     (sunny)

                         Gauri S. Shrestha, M.Optom, FIACLE
Purkinje Shift
  Scotopic System:
     Stimuli of 507 nm are perceived brighter than other stimuli


  Photopic System:
     Stimuli of 555 nm are perceived brighter than other stimuli


  The difference in the peak sensitivity of the 2 systems is
   the ‘Purkinje Shift’


                          Gauri S. Shrestha, M.Optom, FIACLE
Visual Adaptation
 Human visual system
     Sensitive to a variety of range of illumination
      Phenomenon of our visual system
     to be capable of functioning in various
      illumination visual adaptation
 Types:
     Light Adaptation
     Dark Adaptation


                    Gauri S. Shrestha, M.Optom, FIACLE
Light adaptation
 visual adaptation to increased levels of
  illumination.
 Promptly occurring over a period of 5
  minutes
 With light adaptation, the eye has to quickly adapt
  to the background illumination to be able to
  distinguish objects in this background.


                   Gauri S. Shrestha, M.Optom, FIACLE
Light adaptation
 Light adaptation can be explored by determining
  increment thresholds
 In an increment threshold experiment, a test stimulus is
  presented on a background of a certain luminance
 The stimulus is increased in luminance until detection
  threshold is reached against the background
 Therefore, the independent variable is the luminance of the
  background and the dependent variable is the threshold
  intensity or luminance of the incremental test required for
  detection.
 Such an approach is used when visual fields are measured
  in clinical practice.
                          Gauri S. Shrestha, M.Optom, FIACLE
Light adaptation
 The experimental conditions shown in figure can
  be repeated by changing the background field
  luminance.
 Depending upon the choice of test, background
  wavelength, the test size and retinal eccentricity
      a monophasic or biphasic threshold versus
       intensity curve is obtained.


                     Gauri S. Shrestha, M.Optom, FIACLE
Fig 10. Light adaptation using an increment threshold experiment


                    Gauri S. Shrestha, M.Optom, FIACLE
Light adaptation
 Fig11 illustrates such a curve for parafoveal
  presentation of a yellow test field on a green
  background.
 This stimulus choice leads to two branches.
      A lower branch belonging to the rod system.
      As the background light level increases, visual
       function shifts from the rod system to the cone
       system.
 A dual-branched curve reflects the duplex nature
  of vision, similar to the bi-phasic response in the
  dark adaptation curve.
                      Gauri S. Shrestha, M.Optom, FIACLE
Fig11. Light adaptation curve plotted as increment threshold versus
background luminance (or a threshold-versus-intensity: tvi curve). The
     above plot shows increment threshold (Nl ) and background
 luminance (Mm ). Light of two different wavelengths are used in this
      case (580 nm for the test and 500 nm for the background).
                             Gauri S. Shrestha, M.Optom, FIACLE
Light Adaptation Experiments


           Gauri S. Shrestha, M.Optom, FIACLE
What does the graph mean?
 Sections 1-4 are the ‘scotopic
  portion’
      Section 1: (Slope = 0)
         Detection is limited by neural


          noise in very low light levels
          (practically black)
      Section 2: (Slope = ½)
         Background is very dim.

         Fluctuations inherent in the

          light source play primary role
          in determining threshold

                           Gauri S. Shrestha, M.Optom, FIACLE
Light Adaptation Curve
    Section 3:
         Slope = 1
         Indicates Weber’s Law:
          threshold contrast
          remains constant as the
          illumination changes
         Scotopic constant: k =
          0.14


                      Gauri S. Shrestha, M.Optom, FIACLE
Weber’s Law
 What do we know from Weber’s Law?
   ∆I = kIb
     As background illumination increases, the
      increment intensity (JND, increment
      threshold) increases
     If threshold increases, what happens to
      absolute sensitivity?
          Absolute sensitivity decreases
     As illumination increases, we are less
      sensitive

                         Gauri S. Shrestha, M.Optom, FIACLE
Light Adaptation Curve
    Section 4:
         Slope = infinity
         With high levels of illumination, rods cannot
          detect any stimulus
         When does rod saturation occur?
             10% of rhodopsin is bleached


                       Gauri S. Shrestha, M.Optom, FIACLE
Light Adaptation Curve

   Section 5:
        Slope = 1
        makes up the photopic portion of the curve
        Photopic system is following Weber’s Law (k =
         0.015)
            Photopic system is much more sensitive to
             contrast than the scotopic system


                      Gauri S. Shrestha, M.Optom, FIACLE
Mechanism of light adaptation
 Photochemical reaction
  Rhodopsin                   Retinal + Opsin
   Rod:
         Saturates once the light is moderately bright.
     Cones:
         Continue to adapt and respond to brighter
          illumination
         Reaches to maximum after 5-10 mins.


                      Gauri S. Shrestha, M.Optom, FIACLE
Mechanism of light adaptation
 Photoregeneration:
    Isomerisation of the immediate products of bleaching-
     back into the photosensitive pigments.

 Threshold rise when,
    Rate of bleaching                             regeneration of
                                                         photopigment


                     Gauri S. Shrestha, M.Optom, FIACLE
Dark Adaptation
 Subject is exposed to a bright adapting light so that
  most of the photo pigments are bleached
 Light is then turned off and detection threshold is
  measured repeatedly over a period of time
 The background is totally dark
 The stimulus is large, centrally fixated
 Wavelength is 420 nm


                     Gauri S. Shrestha, M.Optom, FIACLE
The Goldmann-Weekers
Machine


          Gauri S. Shrestha, M.Optom, FIACLE
The Goldmann-Weekers
Machine


          Gauri S. Shrestha, M.Optom, FIACLE
Cones and Rods…
 First Section
    Rapid threshold reduction (5 min) followed by
     plateau
    This represents the cone thresholds
 Cone-Rod Break
    Break in curve that occurs after 10 min. of
     adaptation
 Second Section
    Reduction in threshold that extends to 35 minutes
    This represents the rod thresholds

                    Gauri S. Shrestha, M.Optom, FIACLE
Dark Adaptation Curve
 Cones recover within 5 min while rods take up to
  35 min to fully recover sensitivity

 The Rod-Cone break is the point where the rods
  become more sensitive than the cones

 The two plateaus represent the thresholds of the
  rods and cones.


                    Gauri S. Shrestha, M.Optom, FIACLE
Gauri S. Shrestha, M.Optom, FIACLE
Factors Affecting Dark Adaptation.
   Intensity and duration of the pre-adapting light

   Size and position of the retina used in
    measuring dark adaptation
   Wavelength distribution of the light used
   Rhodopsin regeneration


                  Gauri S. Shrestha, M.Optom, FIACLE
Intensity of pre-adapting light

 With increasing levels of pre-adapting luminance
   the cone branch becomes longer while the rod branch
     becomes more delayed.


 Absolute threshold takes longer time to reach.


 At low levels of pre-adapting luminance
    rod threshold drops quickly to reach absolute
     threshold.


                      Gauri S. Shrestha, M.Optom, FIACLE
Intensity and duration of pre-adapting light


                   Gauri S. Shrestha, M.Optom, FIACLE
Duration of pre-adapting light

  Shorter the duration of the pre-adapting light, the more
   rapid the decrease in dark adaptation.

  For extremely short pre-adaptation periods
     a single rod curve is obtained.


  Only after long pre-adaptation, a bi-phasic, cone and
   rod branches are obtained.


                    Gauri S. Shrestha, M.Optom, FIACLE
Gauri S. Shrestha, M.Optom, FIACLE
Size and location of the retina used
 The retinal location used to register the test spot
  during dark adaptation will affect the dark adaptation
  curve
      When a small test spot is located at the fovea
       (eccentricity of 0o), only one branch is seen with a
       higher threshold compared to the rod branch.
 When the same size test spot is used in the peripheral
  retina during dark adaptation
    the typical break appears in the curve representing
     the cone branch and the rod branch.

                      Gauri S. Shrestha, M.Optom, FIACLE
Size and location of the retina used


               Gauri S. Shrestha, M.Optom, FIACLE
Location of the retina used


               Gauri S. Shrestha, M.Optom, FIACLE
Size and location of the retina used
 A single branch obtained when a small test spot is
  used
    only cones present at the fovea are stimulated.
 A rod-cone break is seen when a larger test spot is
  used
    the test spot stimulates both cones and rods.
 As the test spot becomes even larger, incorporating
  more rods, the sensitivity of the eye in the dark is
  even greater
    reflecting the larger spatial summation
     characteristics of the rod pathway.
                   Gauri S. Shrestha, M.Optom, FIACLE
Wavelength of the threshold light

                                  From figure, a rod-cone
                                      break is not seen when
                                      using light of long
                                      wavelengths such as
                                      extreme red.

                                  This occurs due to rods
                                      and cones having
                                      similar sensitivities to
                                      light of long
                                      wavelengths

             Gauri S. Shrestha, M.Optom, FIACLE
Wavelength of the threshold light


            Gauri S. Shrestha, M.Optom, FIACLE
Wavelength of threshold light
 depicts the photopic and scotopic spectral
  sensitivity functions
     to illustrate the point that the rod and cone
      sensitivity difference is dependent upon test
      wavelength.


 when light of short wavelength is used,
     the rod-cone break is most prominent??


                     Gauri S. Shrestha, M.Optom, FIACLE
Rhodopsin regeneration
 Dark adaptation also depends upon photopigment
  bleaching
      The time course for dark adaptation and rhodopsin
       regeneration was same
           Using retinal densitometry.
 Bleaching rhodopsin by 1% raises threshold by 10
  (decreases sensitivity by 10)
 Bleaching of cone photopigment has a smaller
  effect on cone thresholds.


                           Gauri S. Shrestha, M.Optom, FIACLE
Rhodopsin regeneration


   Log relative threshold as a function of the
   percentage of photopigment bleached
                     Gauri S. Shrestha, M.Optom, FIACLE
Clinical Pearl


            Gauri S. Shrestha, M.Optom, FIACLE
Clinical Pearl
 Rod monochromatism
      Sensory nystagmus

      Blurred vision

      Photophobia

      Color vision


                   Gauri S. Shrestha, M.Optom, FIACLE
Congenital stationary night blindness
 Psychophysical and
  electrophysiological
  findings in negative
  electroretinography (ERG)
  selective loss of the b-
  wave


                 Gauri S. Shrestha, M.Optom, FIACLE
Retinitis Pigmentosa
 Depression of the curve occurs in conditions affecting
  the outer retina and RPE


                    Gauri S. Shrestha, M.Optom, FIACLE
Prolong Dark adaptation
   Vitamin A deficiency
   Effect of anoxia
   Effect of tobacco inhalation
   Anaesthesia
   Ocular opacities
   Retinal degeneration
   Myopia
   Glaucoma ?


                   Gauri S. Shrestha, M.Optom, FIACLE
 Which type of tint is better to preserve bleaching
  of rods?
 Does photochromic lens help preserve dark
  adaptation?
 Progressive conditions with impaired dark
  adaptations are __________ & ________
 Name the tints that help in optimizing dark
  adaptation.


                     Gauri S. Shrestha, M.Optom, FIACLE

Light and dark adaptation

  • 1.
    Light and DarkAdaptation Gauri S. Shrestha, M. Optom, FIACLE Lecturer, BPKLCOS, IOM
  • 2.
    Rods  Rhodopsin  most readily absorbs wavelengths of 507 nm.  a molecule of rhodopsin absorbs one quanta of light, it is ‘bleached’  Bleached: the molecule is not capable of capturing another quantum  Spontaneously become ‘unbleached’  50% recover within 5 minutes Gauri S. Shrestha, M.Optom, FIACLE
  • 3.
    Rods  Peak densityof rods occurs 20o from fovea  150,000 rods/mm2  No rods are present at the fovea:  Total Number: 120 million Gauri S. Shrestha, M.Optom, FIACLE
  • 4.
    Cones  Cones aremost densely packed at the fovea  150,000 cones/mm2  Only 4% of total cones are foveal  Total Number: 6 million Gauri S. Shrestha, M.Optom, FIACLE
  • 5.
    Cones  3 typesof cone photopigments:  Erythrolabe: maximum absorption at 565 nm  ‘Long wavelength cones’ (L-cones), red cones  Chlorolabe: maximum absorption at 535 nm  ‘Middle wavelength cones’ (M-cones), green cones  Cyanolabe: maximum absorption at 430 nm  ‘Short wavelength cones’ (S-cones), blue cones  Recover from bleaching more rapidly than rhodopsin  50% of cones will recover within 1.5 minutes Gauri S. Shrestha, M.Optom, FIACLE
  • 6.
    Specific Cone Distribution Ratio of L-cones to M-cones to S-cones = 16/8/1  S-cones are less numerous than either L-cones or M-cones.  No S-cones at the fovea  Peak distribution occurs just outside the fovea  Small field Tritanopia  unable to see small blue objects when centrally fixated Gauri S. Shrestha, M.Optom, FIACLE
  • 7.
    Observations  Choose particularwave length and increase intensity  Change the wave length from high frequency to low frequency Chromatic interval=0 Gauri S. Shrestha, M.Optom, FIACLE
  • 8.
    Visual Thresholds  Minimumamount of energy required for a patient to detect a stimulus  low threshold = high sensitivity  Threshold = 1/Sensitivity  Scotopic Threshold:  threshold of a patient measured in dim light conditions (night)  Photopic Threshold:  threshold of a patient measured in bright light conditions (sunny) Gauri S. Shrestha, M.Optom, FIACLE
  • 9.
    Purkinje Shift Scotopic System:  Stimuli of 507 nm are perceived brighter than other stimuli  Photopic System:  Stimuli of 555 nm are perceived brighter than other stimuli  The difference in the peak sensitivity of the 2 systems is the ‘Purkinje Shift’ Gauri S. Shrestha, M.Optom, FIACLE
  • 10.
    Visual Adaptation  Humanvisual system  Sensitive to a variety of range of illumination Phenomenon of our visual system  to be capable of functioning in various illumination visual adaptation  Types:  Light Adaptation  Dark Adaptation Gauri S. Shrestha, M.Optom, FIACLE
  • 11.
    Light adaptation  visualadaptation to increased levels of illumination.  Promptly occurring over a period of 5 minutes  With light adaptation, the eye has to quickly adapt to the background illumination to be able to distinguish objects in this background. Gauri S. Shrestha, M.Optom, FIACLE
  • 12.
    Light adaptation  Lightadaptation can be explored by determining increment thresholds  In an increment threshold experiment, a test stimulus is presented on a background of a certain luminance  The stimulus is increased in luminance until detection threshold is reached against the background  Therefore, the independent variable is the luminance of the background and the dependent variable is the threshold intensity or luminance of the incremental test required for detection.  Such an approach is used when visual fields are measured in clinical practice. Gauri S. Shrestha, M.Optom, FIACLE
  • 13.
    Light adaptation  Theexperimental conditions shown in figure can be repeated by changing the background field luminance.  Depending upon the choice of test, background wavelength, the test size and retinal eccentricity  a monophasic or biphasic threshold versus intensity curve is obtained. Gauri S. Shrestha, M.Optom, FIACLE
  • 14.
    Fig 10. Lightadaptation using an increment threshold experiment Gauri S. Shrestha, M.Optom, FIACLE
  • 15.
    Light adaptation  Fig11illustrates such a curve for parafoveal presentation of a yellow test field on a green background.  This stimulus choice leads to two branches.  A lower branch belonging to the rod system.  As the background light level increases, visual function shifts from the rod system to the cone system.  A dual-branched curve reflects the duplex nature of vision, similar to the bi-phasic response in the dark adaptation curve. Gauri S. Shrestha, M.Optom, FIACLE
  • 16.
    Fig11. Light adaptationcurve plotted as increment threshold versus background luminance (or a threshold-versus-intensity: tvi curve). The above plot shows increment threshold (Nl ) and background luminance (Mm ). Light of two different wavelengths are used in this case (580 nm for the test and 500 nm for the background). Gauri S. Shrestha, M.Optom, FIACLE
  • 17.
    Light Adaptation Experiments Gauri S. Shrestha, M.Optom, FIACLE
  • 18.
    What does thegraph mean?  Sections 1-4 are the ‘scotopic portion’  Section 1: (Slope = 0)  Detection is limited by neural noise in very low light levels (practically black)  Section 2: (Slope = ½)  Background is very dim.  Fluctuations inherent in the light source play primary role in determining threshold Gauri S. Shrestha, M.Optom, FIACLE
  • 19.
    Light Adaptation Curve  Section 3:  Slope = 1  Indicates Weber’s Law: threshold contrast remains constant as the illumination changes  Scotopic constant: k = 0.14 Gauri S. Shrestha, M.Optom, FIACLE
  • 20.
    Weber’s Law  Whatdo we know from Weber’s Law?  ∆I = kIb  As background illumination increases, the increment intensity (JND, increment threshold) increases  If threshold increases, what happens to absolute sensitivity?  Absolute sensitivity decreases  As illumination increases, we are less sensitive Gauri S. Shrestha, M.Optom, FIACLE
  • 21.
    Light Adaptation Curve  Section 4:  Slope = infinity  With high levels of illumination, rods cannot detect any stimulus  When does rod saturation occur?  10% of rhodopsin is bleached Gauri S. Shrestha, M.Optom, FIACLE
  • 22.
    Light Adaptation Curve  Section 5:  Slope = 1  makes up the photopic portion of the curve  Photopic system is following Weber’s Law (k = 0.015)  Photopic system is much more sensitive to contrast than the scotopic system Gauri S. Shrestha, M.Optom, FIACLE
  • 23.
    Mechanism of lightadaptation  Photochemical reaction Rhodopsin Retinal + Opsin  Rod:  Saturates once the light is moderately bright.  Cones:  Continue to adapt and respond to brighter illumination  Reaches to maximum after 5-10 mins. Gauri S. Shrestha, M.Optom, FIACLE
  • 24.
    Mechanism of lightadaptation  Photoregeneration:  Isomerisation of the immediate products of bleaching- back into the photosensitive pigments.  Threshold rise when,  Rate of bleaching regeneration of photopigment Gauri S. Shrestha, M.Optom, FIACLE
  • 25.
    Dark Adaptation  Subjectis exposed to a bright adapting light so that most of the photo pigments are bleached  Light is then turned off and detection threshold is measured repeatedly over a period of time  The background is totally dark  The stimulus is large, centrally fixated  Wavelength is 420 nm Gauri S. Shrestha, M.Optom, FIACLE
  • 26.
    The Goldmann-Weekers Machine Gauri S. Shrestha, M.Optom, FIACLE
  • 27.
    The Goldmann-Weekers Machine Gauri S. Shrestha, M.Optom, FIACLE
  • 28.
    Cones and Rods… First Section  Rapid threshold reduction (5 min) followed by plateau  This represents the cone thresholds  Cone-Rod Break  Break in curve that occurs after 10 min. of adaptation  Second Section  Reduction in threshold that extends to 35 minutes  This represents the rod thresholds Gauri S. Shrestha, M.Optom, FIACLE
  • 29.
    Dark Adaptation Curve Cones recover within 5 min while rods take up to 35 min to fully recover sensitivity  The Rod-Cone break is the point where the rods become more sensitive than the cones  The two plateaus represent the thresholds of the rods and cones. Gauri S. Shrestha, M.Optom, FIACLE
  • 30.
    Gauri S. Shrestha,M.Optom, FIACLE
  • 31.
    Factors Affecting DarkAdaptation.  Intensity and duration of the pre-adapting light  Size and position of the retina used in measuring dark adaptation  Wavelength distribution of the light used  Rhodopsin regeneration Gauri S. Shrestha, M.Optom, FIACLE
  • 32.
    Intensity of pre-adaptinglight  With increasing levels of pre-adapting luminance  the cone branch becomes longer while the rod branch becomes more delayed.  Absolute threshold takes longer time to reach.  At low levels of pre-adapting luminance  rod threshold drops quickly to reach absolute threshold. Gauri S. Shrestha, M.Optom, FIACLE
  • 33.
    Intensity and durationof pre-adapting light Gauri S. Shrestha, M.Optom, FIACLE
  • 34.
    Duration of pre-adaptinglight  Shorter the duration of the pre-adapting light, the more rapid the decrease in dark adaptation.  For extremely short pre-adaptation periods  a single rod curve is obtained.  Only after long pre-adaptation, a bi-phasic, cone and rod branches are obtained. Gauri S. Shrestha, M.Optom, FIACLE
  • 35.
    Gauri S. Shrestha,M.Optom, FIACLE
  • 36.
    Size and locationof the retina used  The retinal location used to register the test spot during dark adaptation will affect the dark adaptation curve  When a small test spot is located at the fovea (eccentricity of 0o), only one branch is seen with a higher threshold compared to the rod branch.  When the same size test spot is used in the peripheral retina during dark adaptation  the typical break appears in the curve representing the cone branch and the rod branch. Gauri S. Shrestha, M.Optom, FIACLE
  • 37.
    Size and locationof the retina used Gauri S. Shrestha, M.Optom, FIACLE
  • 38.
    Location of theretina used Gauri S. Shrestha, M.Optom, FIACLE
  • 39.
    Size and locationof the retina used  A single branch obtained when a small test spot is used  only cones present at the fovea are stimulated.  A rod-cone break is seen when a larger test spot is used  the test spot stimulates both cones and rods.  As the test spot becomes even larger, incorporating more rods, the sensitivity of the eye in the dark is even greater  reflecting the larger spatial summation characteristics of the rod pathway. Gauri S. Shrestha, M.Optom, FIACLE
  • 40.
    Wavelength of thethreshold light  From figure, a rod-cone break is not seen when using light of long wavelengths such as extreme red.  This occurs due to rods and cones having similar sensitivities to light of long wavelengths Gauri S. Shrestha, M.Optom, FIACLE
  • 41.
    Wavelength of thethreshold light Gauri S. Shrestha, M.Optom, FIACLE
  • 42.
    Wavelength of thresholdlight  depicts the photopic and scotopic spectral sensitivity functions  to illustrate the point that the rod and cone sensitivity difference is dependent upon test wavelength.  when light of short wavelength is used,  the rod-cone break is most prominent?? Gauri S. Shrestha, M.Optom, FIACLE
  • 43.
    Rhodopsin regeneration  Darkadaptation also depends upon photopigment bleaching  The time course for dark adaptation and rhodopsin regeneration was same  Using retinal densitometry.  Bleaching rhodopsin by 1% raises threshold by 10 (decreases sensitivity by 10)  Bleaching of cone photopigment has a smaller effect on cone thresholds. Gauri S. Shrestha, M.Optom, FIACLE
  • 44.
    Rhodopsin regeneration Log relative threshold as a function of the percentage of photopigment bleached Gauri S. Shrestha, M.Optom, FIACLE
  • 45.
    Clinical Pearl Gauri S. Shrestha, M.Optom, FIACLE
  • 46.
    Clinical Pearl  Rodmonochromatism  Sensory nystagmus  Blurred vision  Photophobia  Color vision Gauri S. Shrestha, M.Optom, FIACLE
  • 47.
    Congenital stationary nightblindness  Psychophysical and electrophysiological findings in negative electroretinography (ERG) selective loss of the b- wave Gauri S. Shrestha, M.Optom, FIACLE
  • 48.
    Retinitis Pigmentosa  Depressionof the curve occurs in conditions affecting the outer retina and RPE Gauri S. Shrestha, M.Optom, FIACLE
  • 49.
    Prolong Dark adaptation  Vitamin A deficiency  Effect of anoxia  Effect of tobacco inhalation  Anaesthesia  Ocular opacities  Retinal degeneration  Myopia  Glaucoma ? Gauri S. Shrestha, M.Optom, FIACLE
  • 50.
     Which typeof tint is better to preserve bleaching of rods?  Does photochromic lens help preserve dark adaptation?  Progressive conditions with impaired dark adaptations are __________ & ________  Name the tints that help in optimizing dark adaptation. Gauri S. Shrestha, M.Optom, FIACLE

Editor's Notes

  • #7 Foveally fixated object blue light= dull
  • #12 With dark adaptation, we noticed that there is progressive decrease in threshold (increase in sensitivity) with time in the dark.
  • #34 Dark adaptation depends upon differing intensities and duration of pre-adapting light. With increasing levels of pre-adapting luminance, the cone branch becomes longer while the rod branch becomes more delayed. Absolute threshold takes longer time to reach. At low levels of pre-adapting luminance, rod threshold drops quickly to reach absolute threshold.
  • #36 The shorter the duration of the pre-adapting light, the more rapid the decrease in dark adaptation. For extremely short pre-adaptation periods, a single rod curve is obtained. It is only after long pre-adaptation that a bi-phasic, cone and rod branches are obtained.
  • #38 The retinal location used to register the test spot during dark adaptation will affect the dark adaptation curve due to the distribution of the rod and cones in the retina. When a small test spot is located at the fovea (eccentricity of 0 o ), only one branch is seen with a higher threshold compared to the rod branch. When the same size test spot is used in the peripheral retina during dark adaptation, the typical break appears in the curve representing the cone branch and the rod branch.