This document provides a summary of a presentation on visual acuity and contrast sensitivity. It discusses:
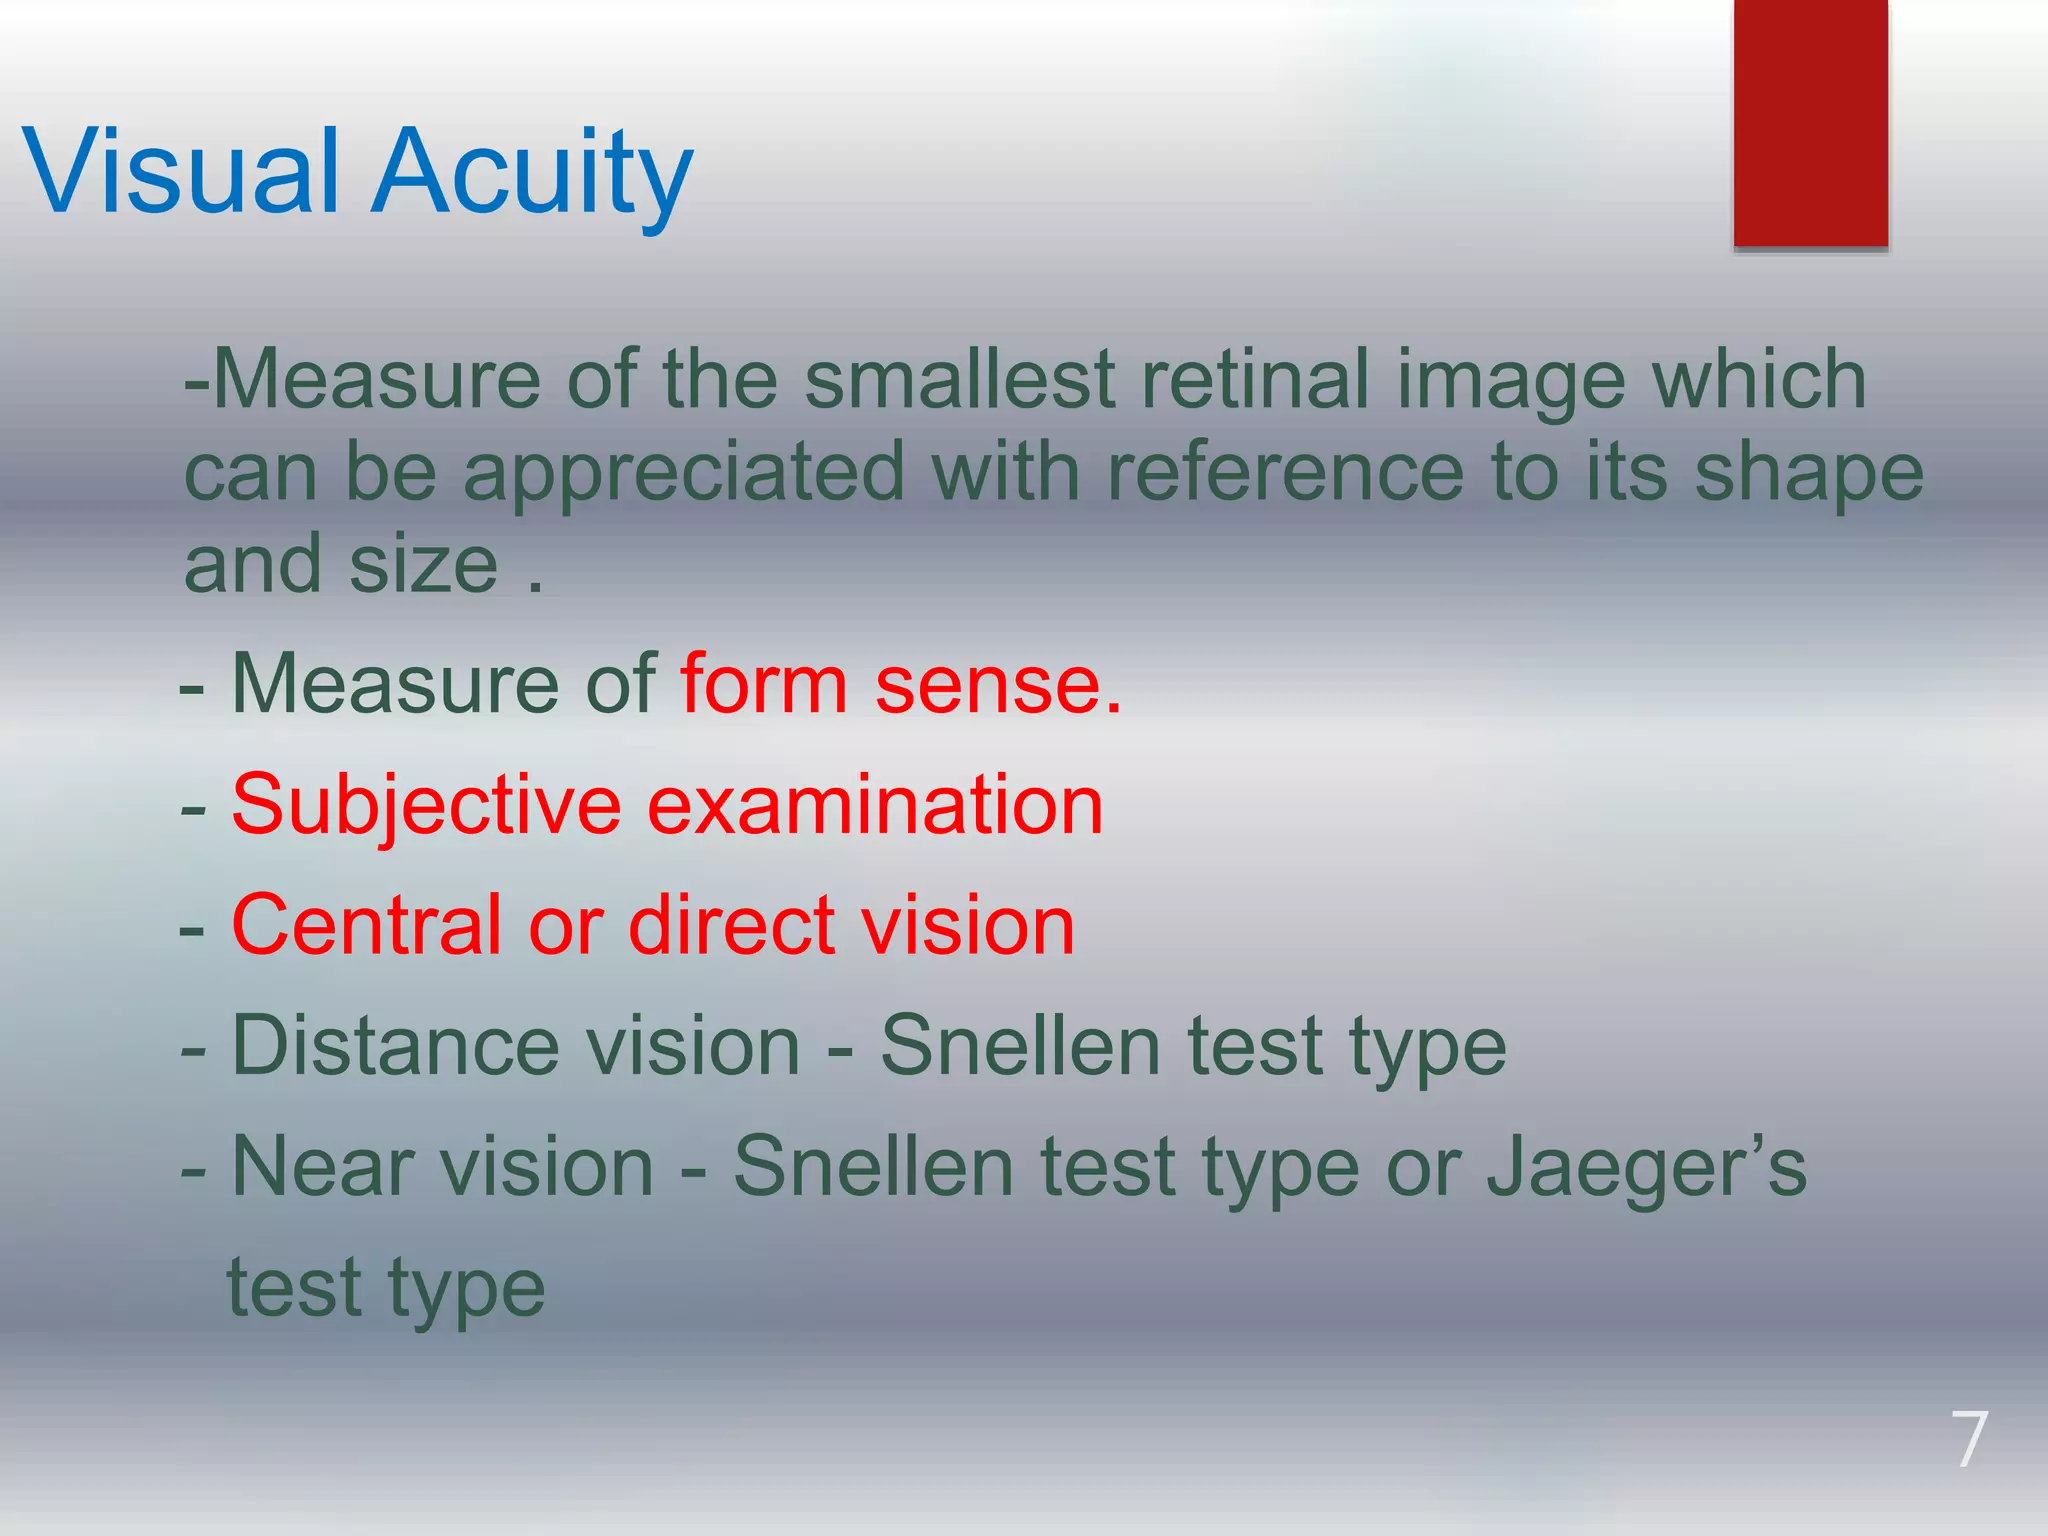
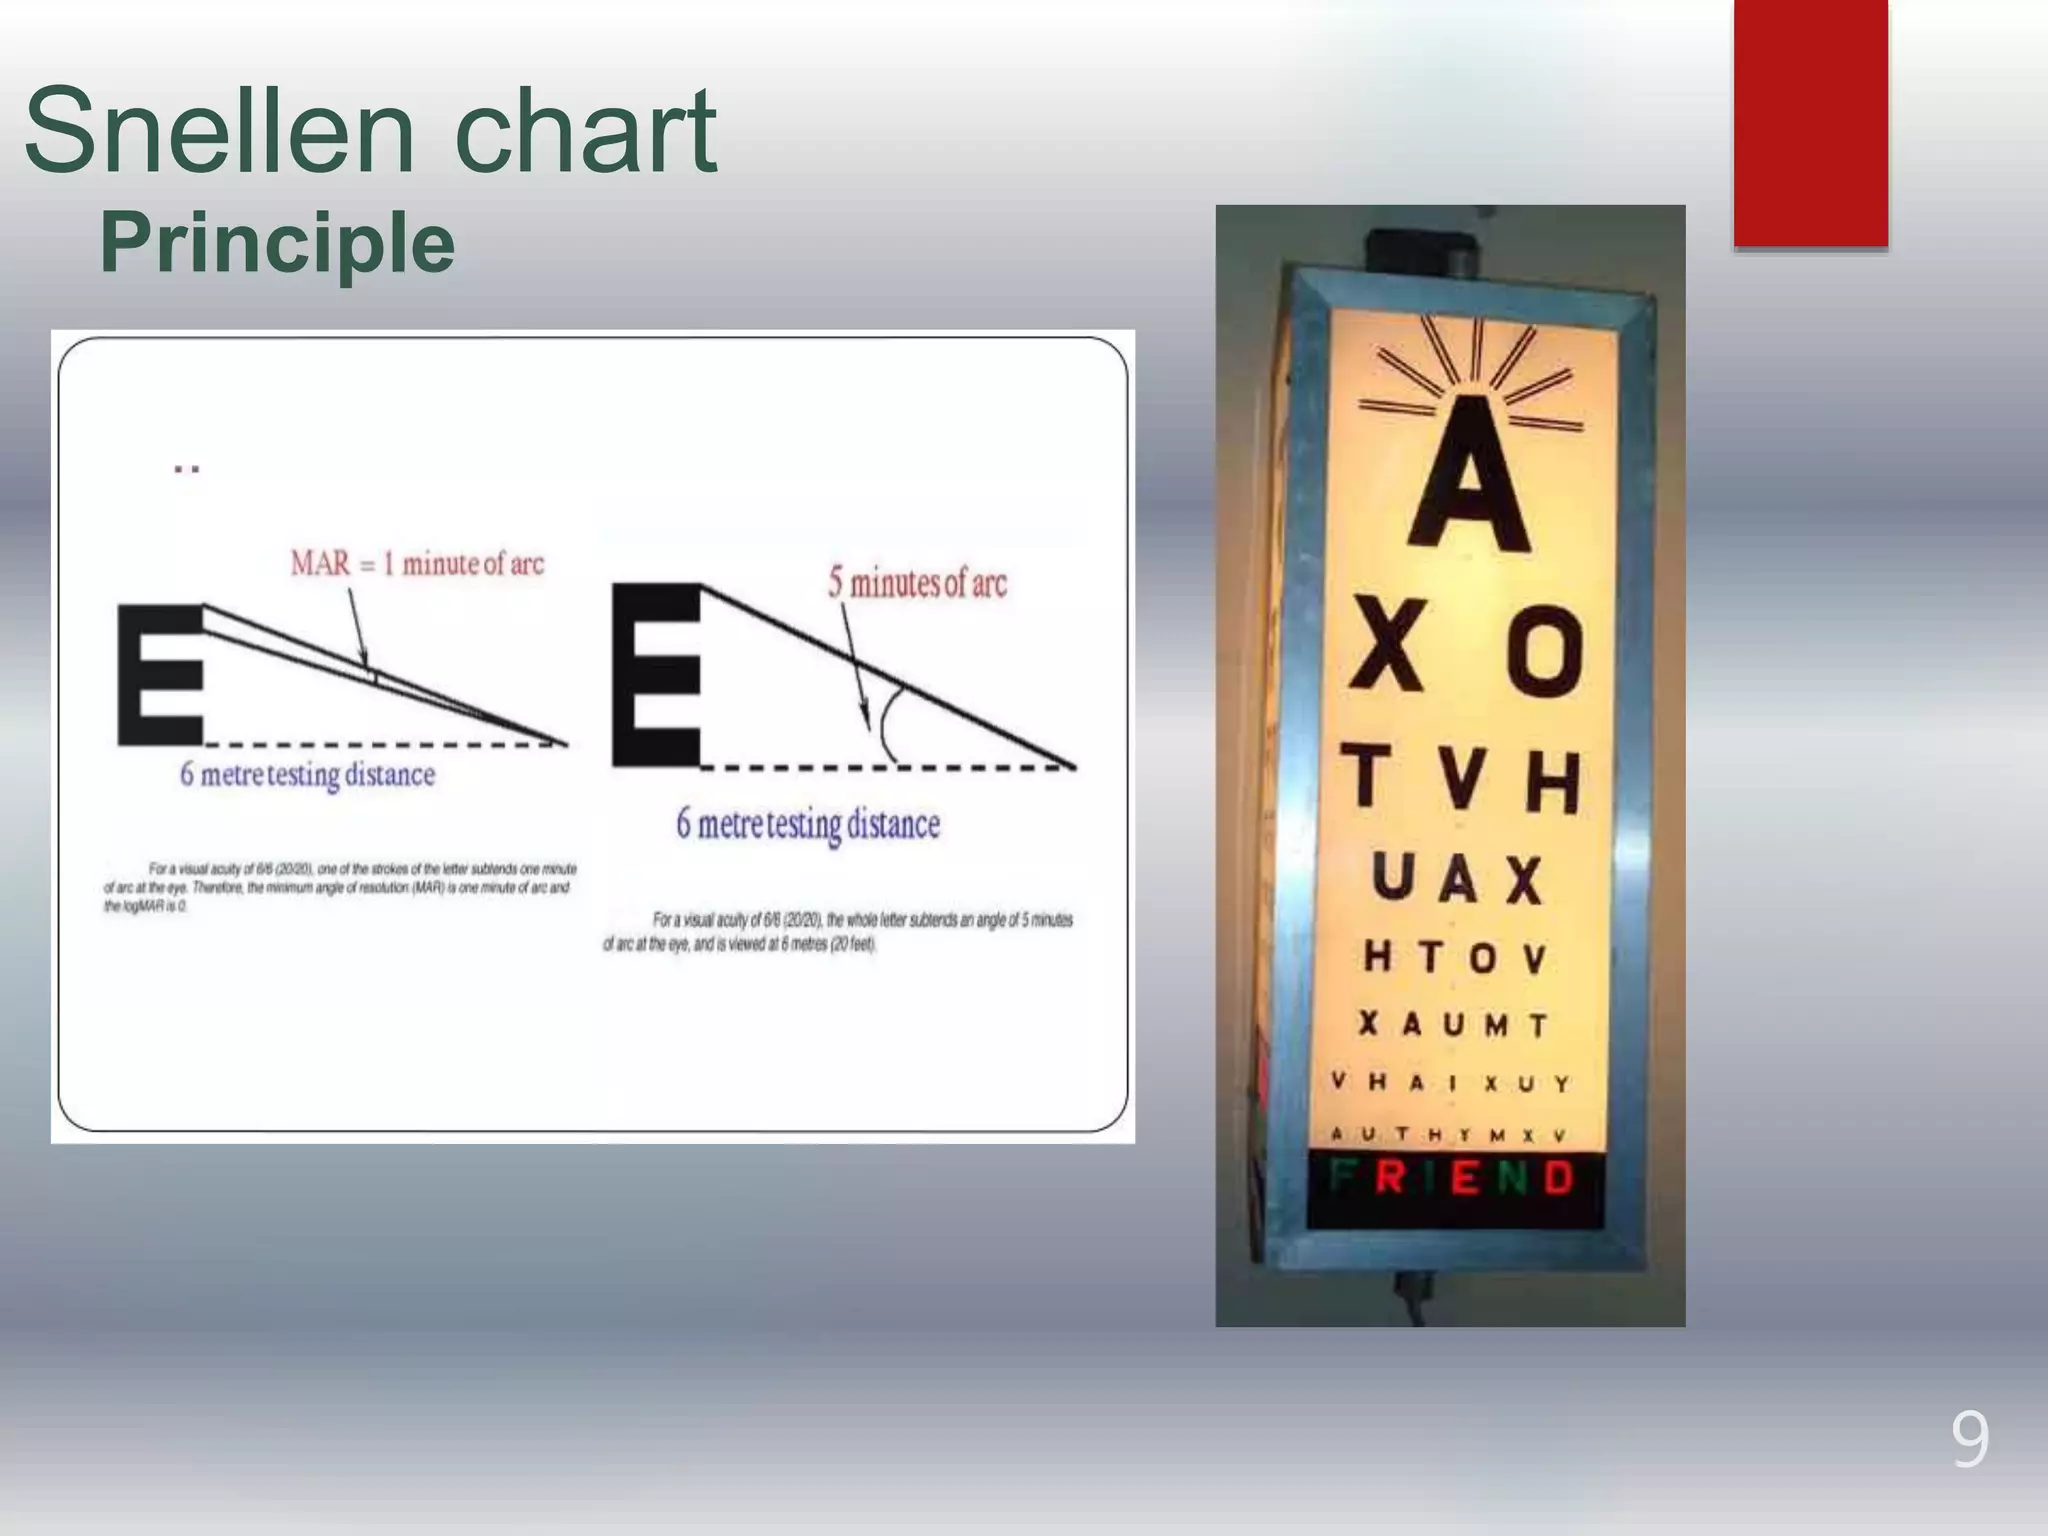
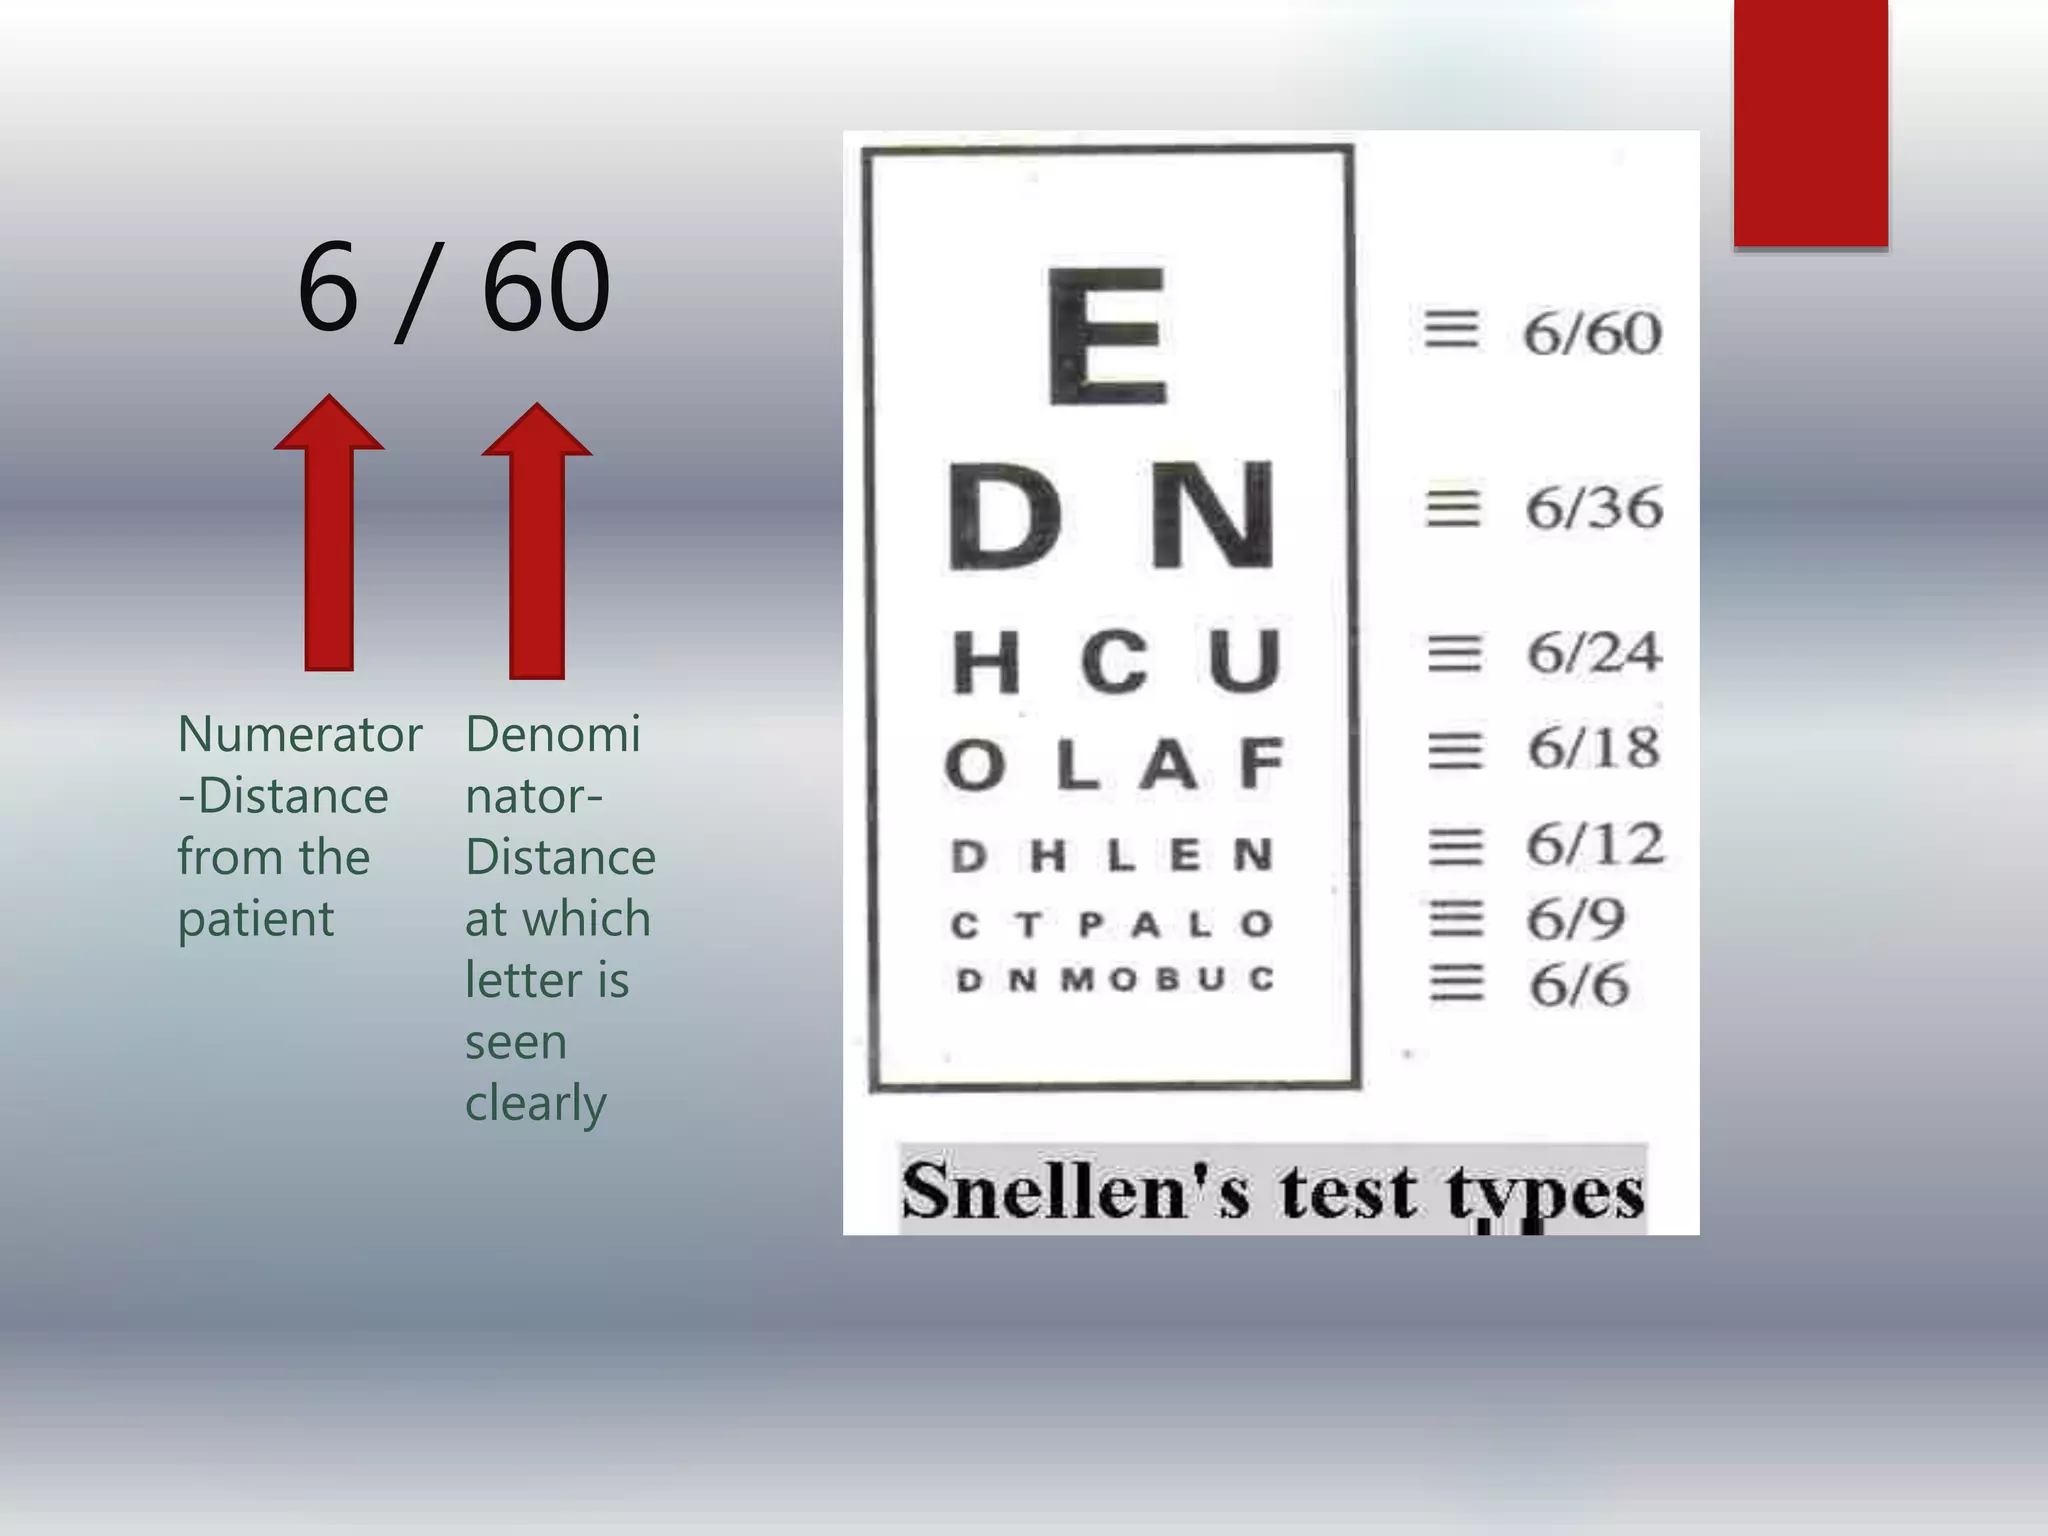
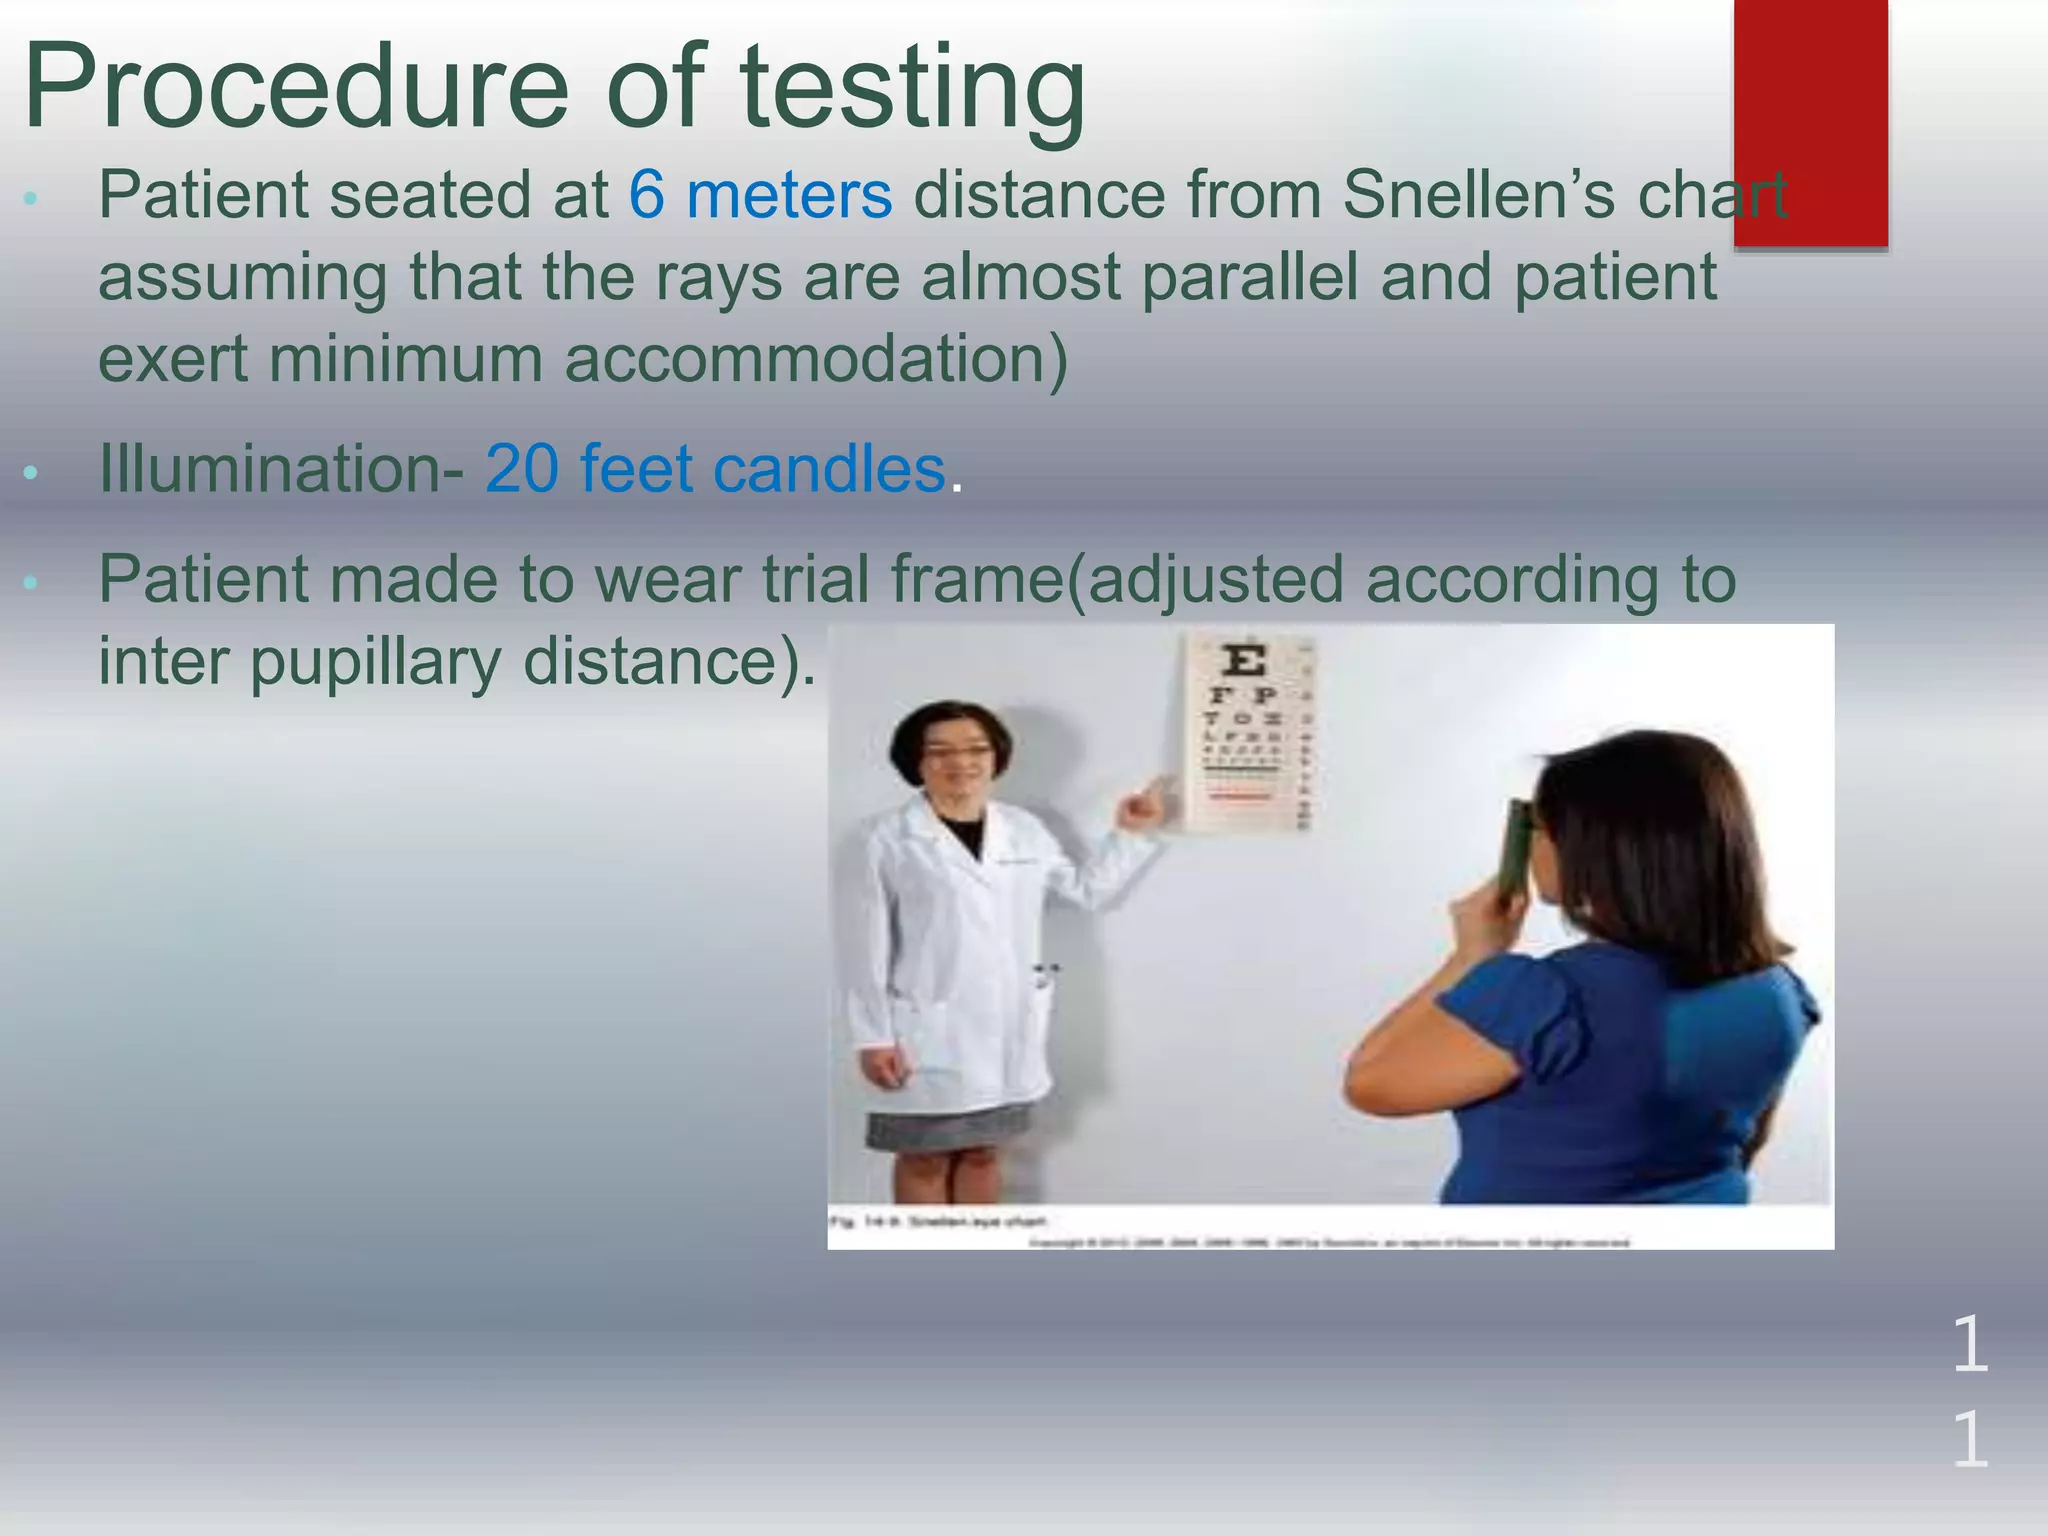
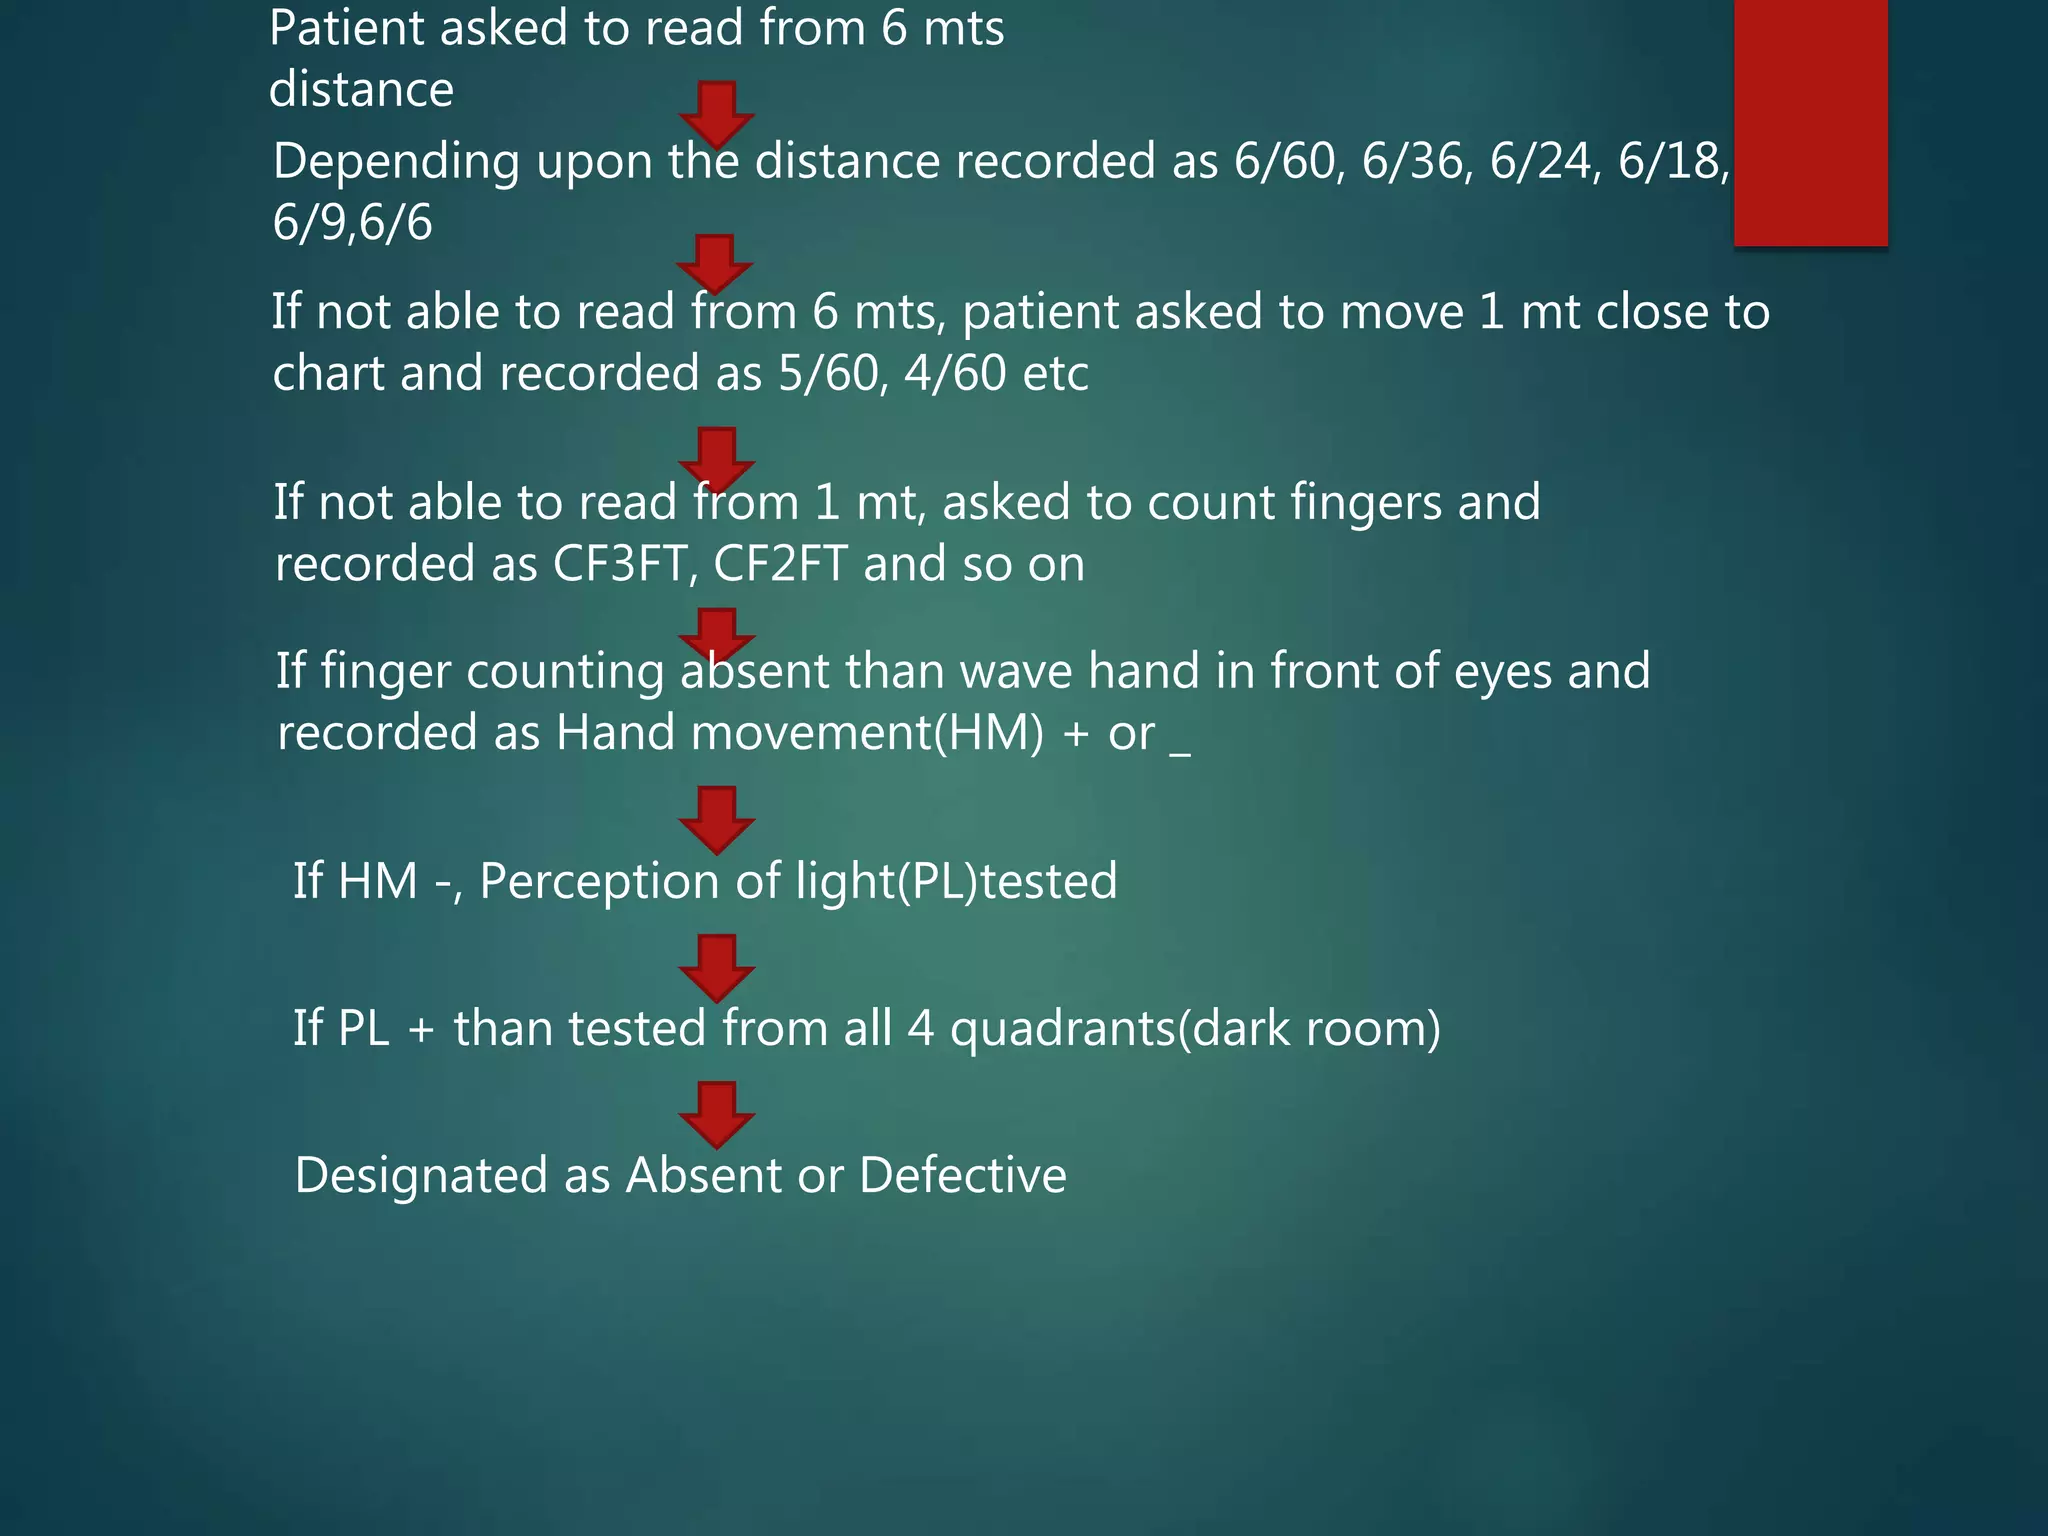
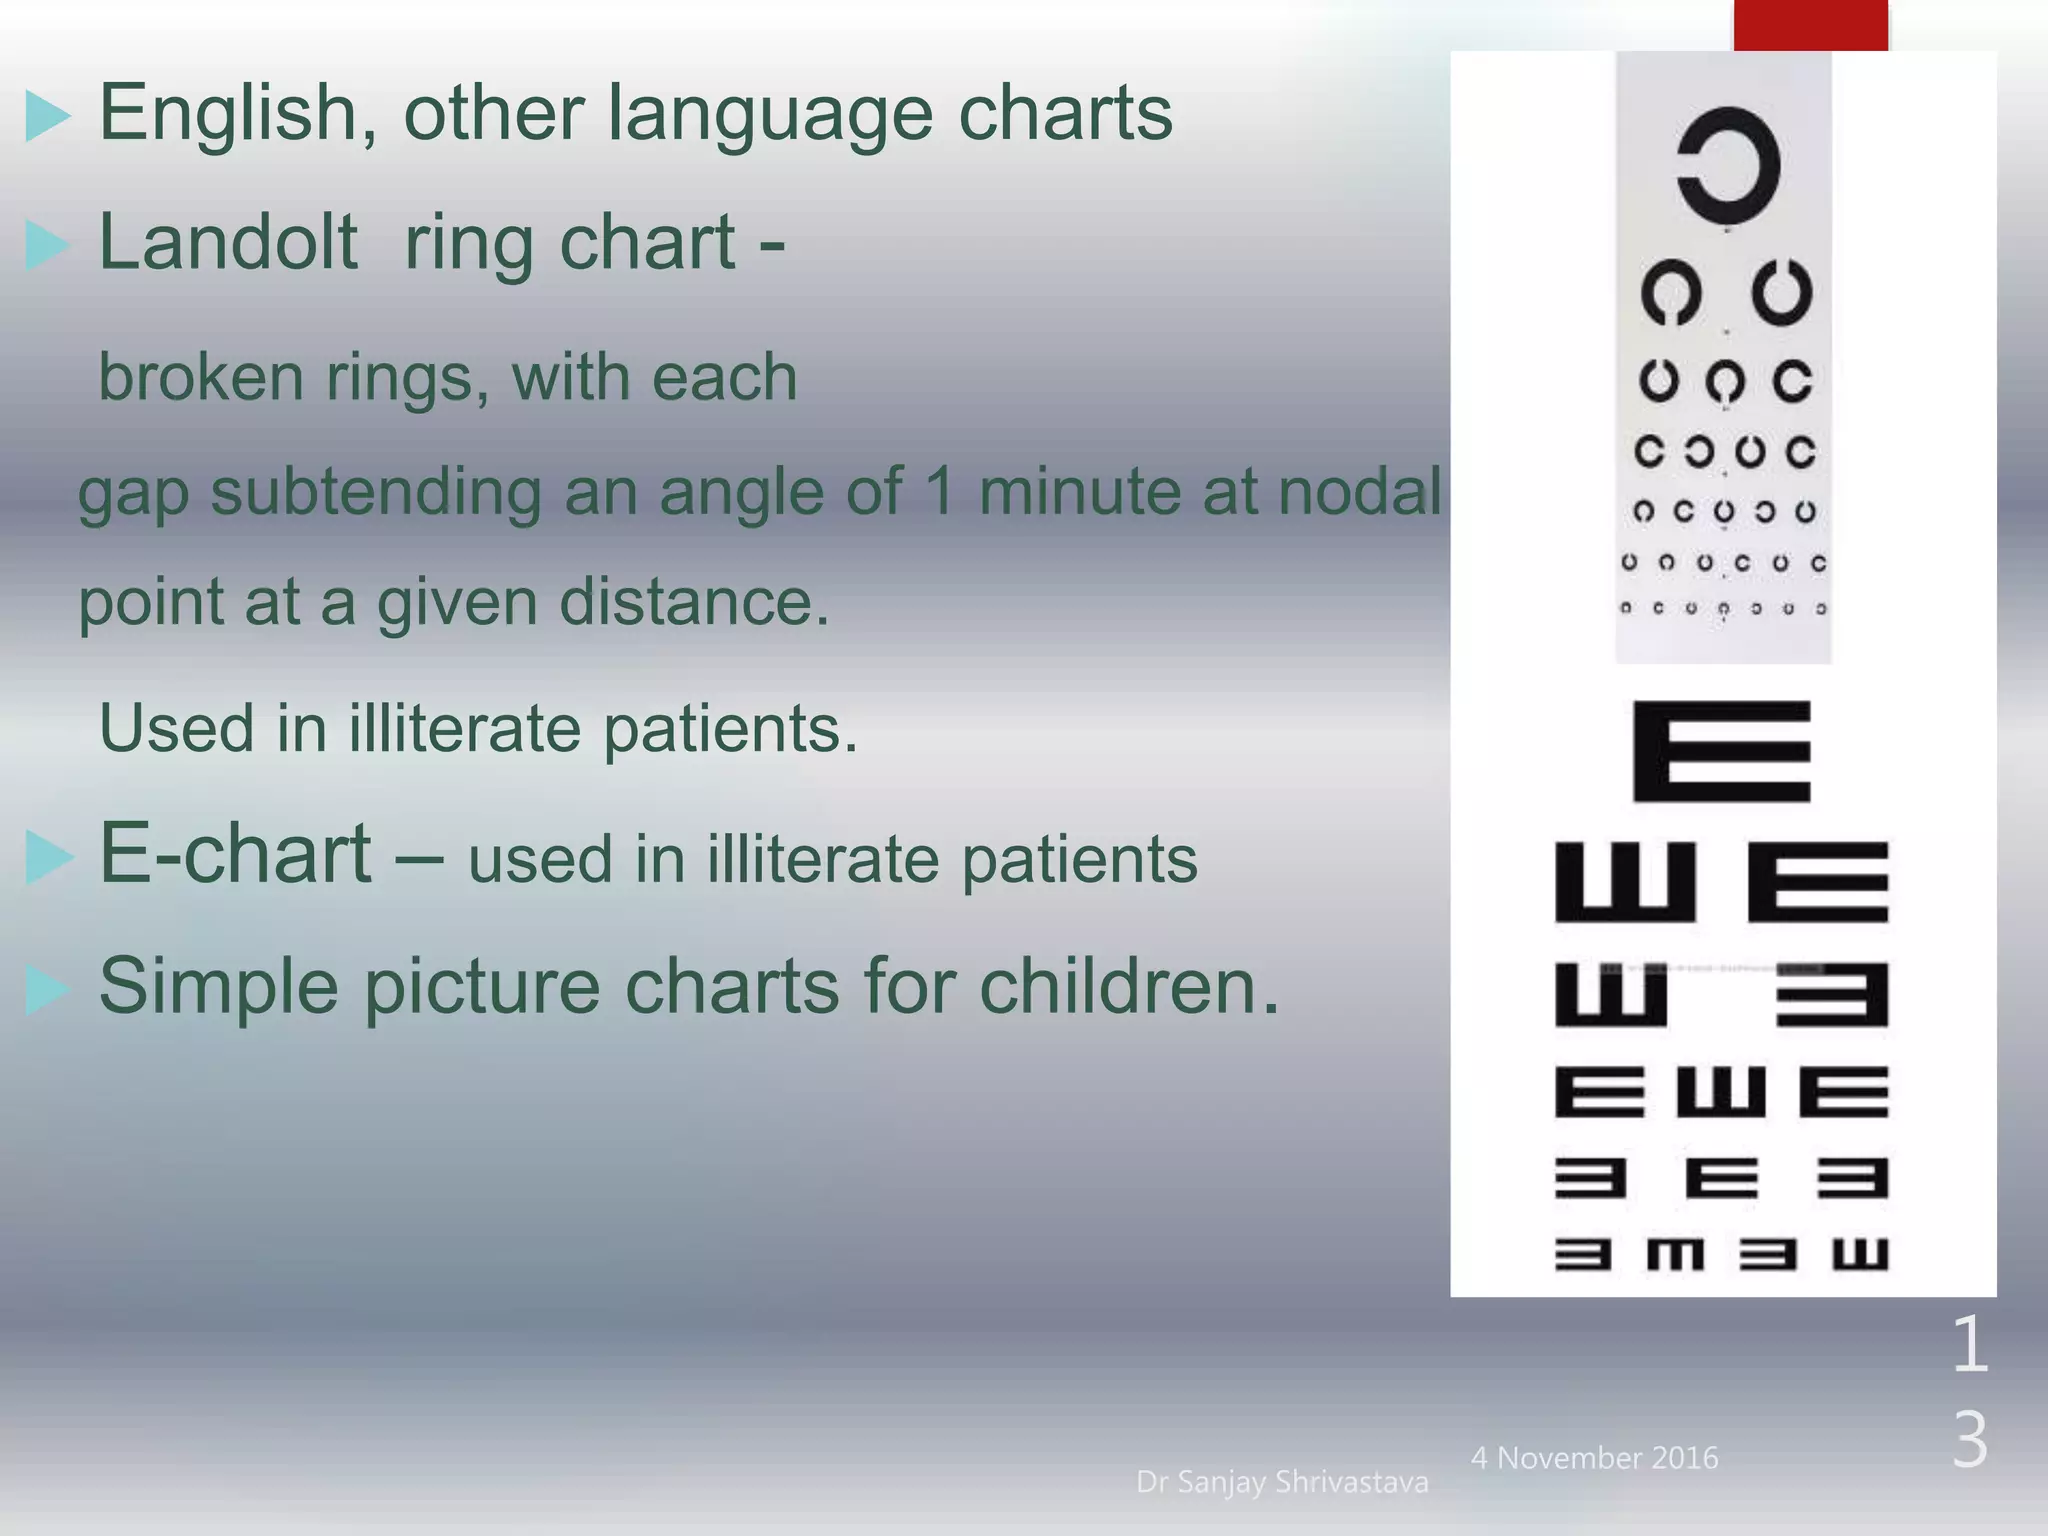
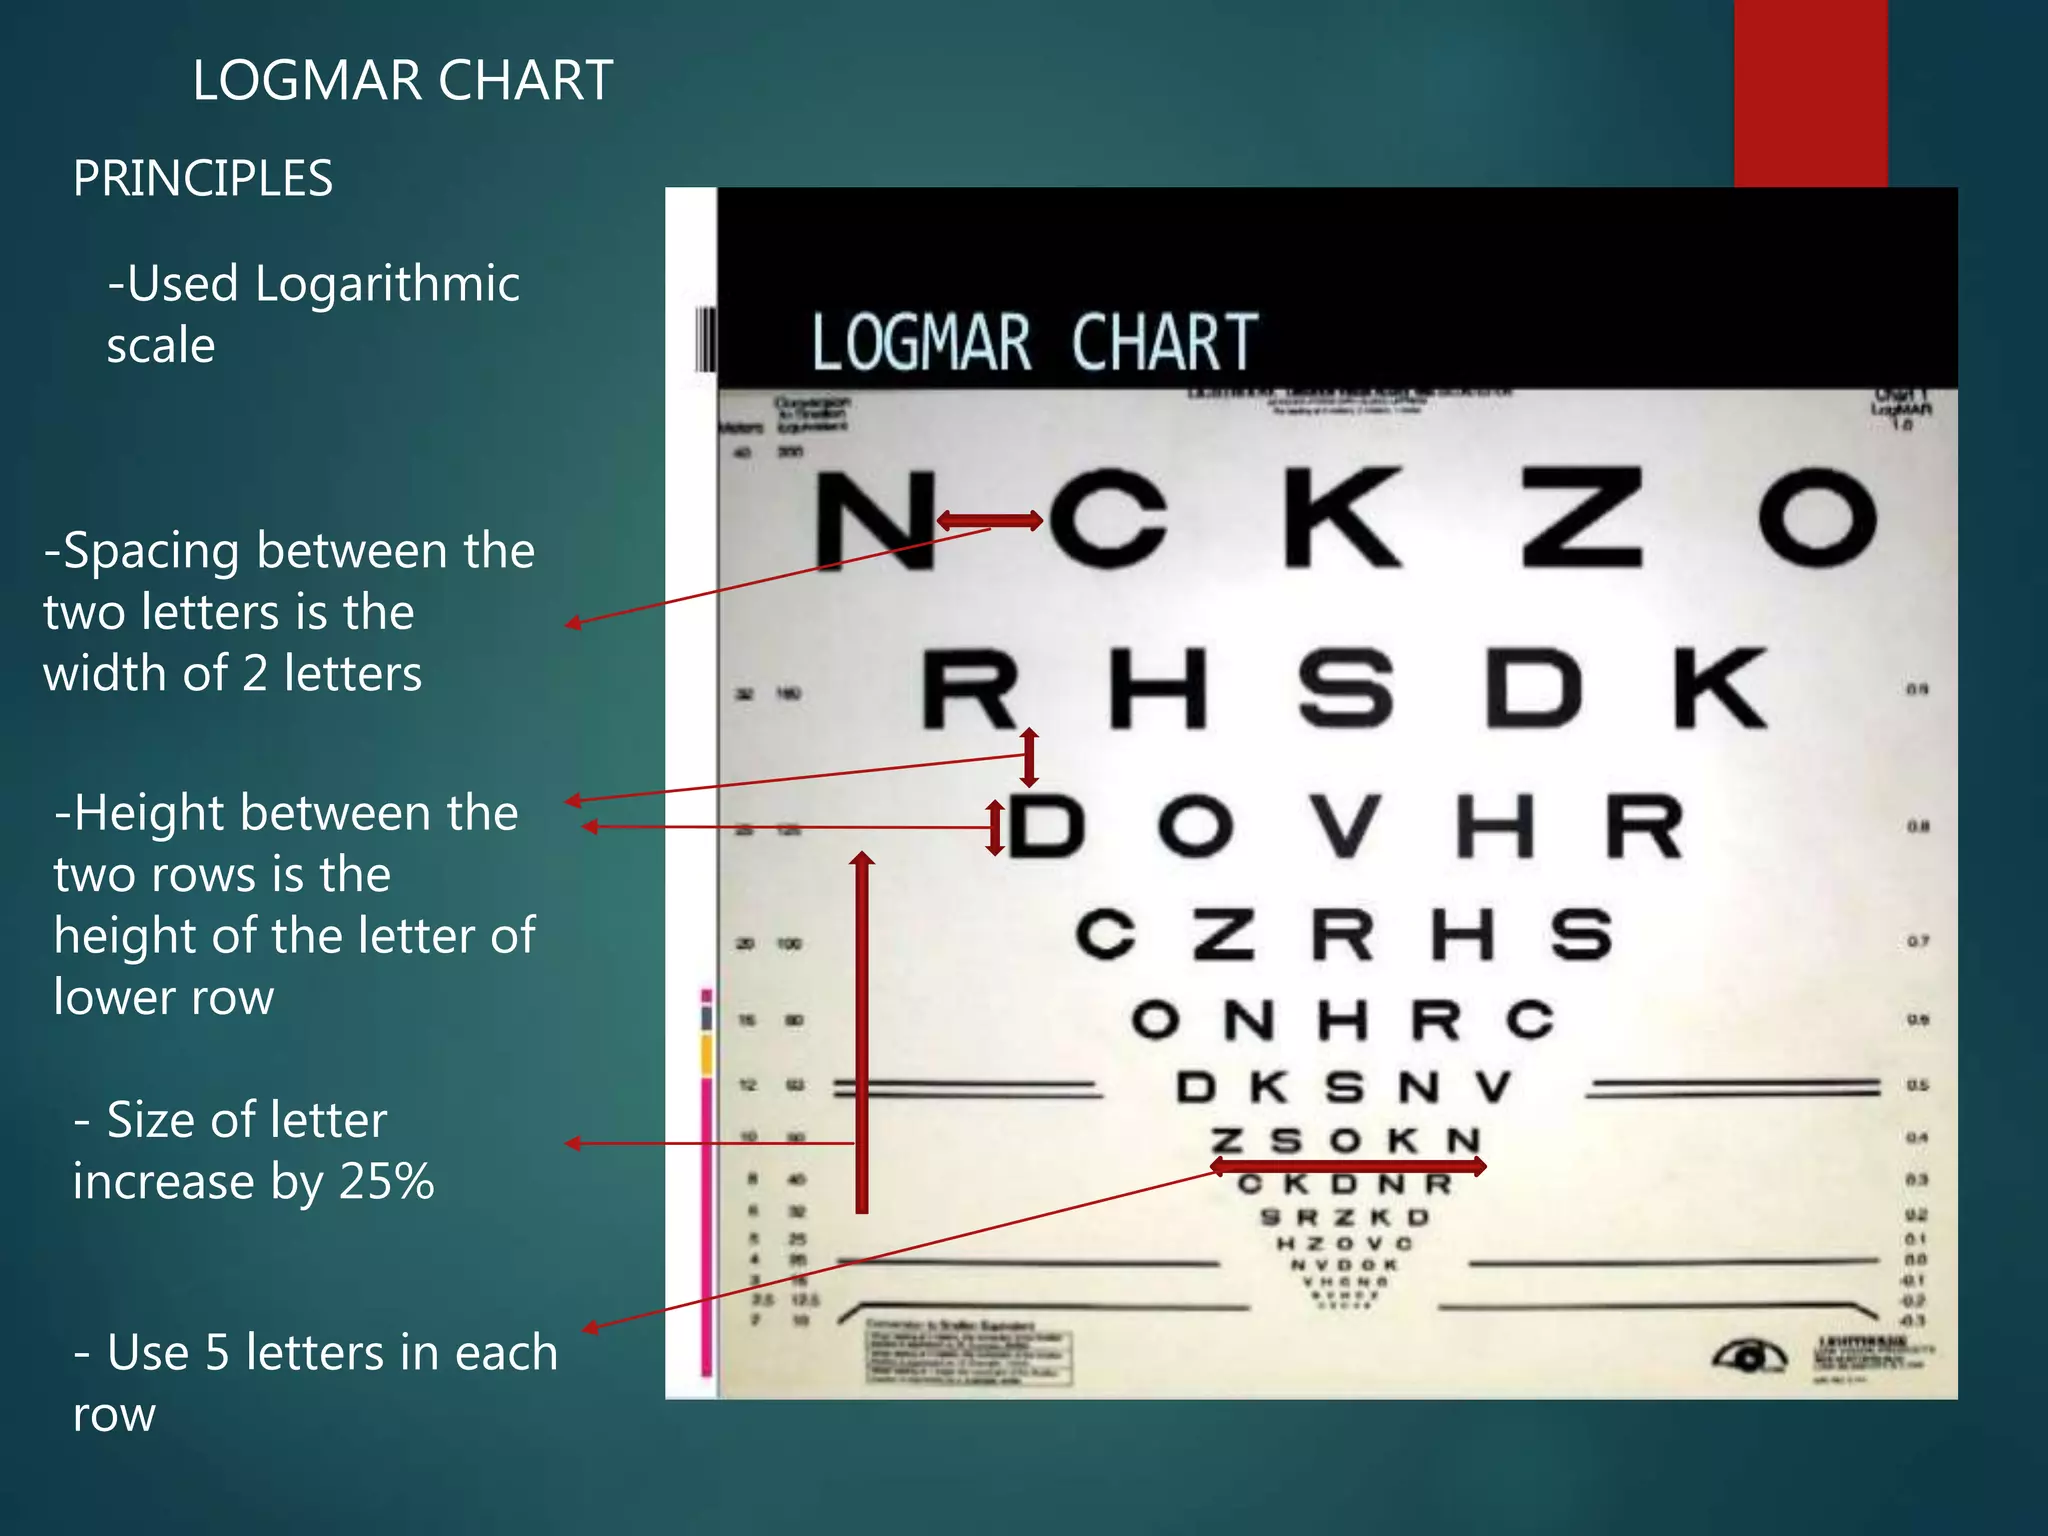
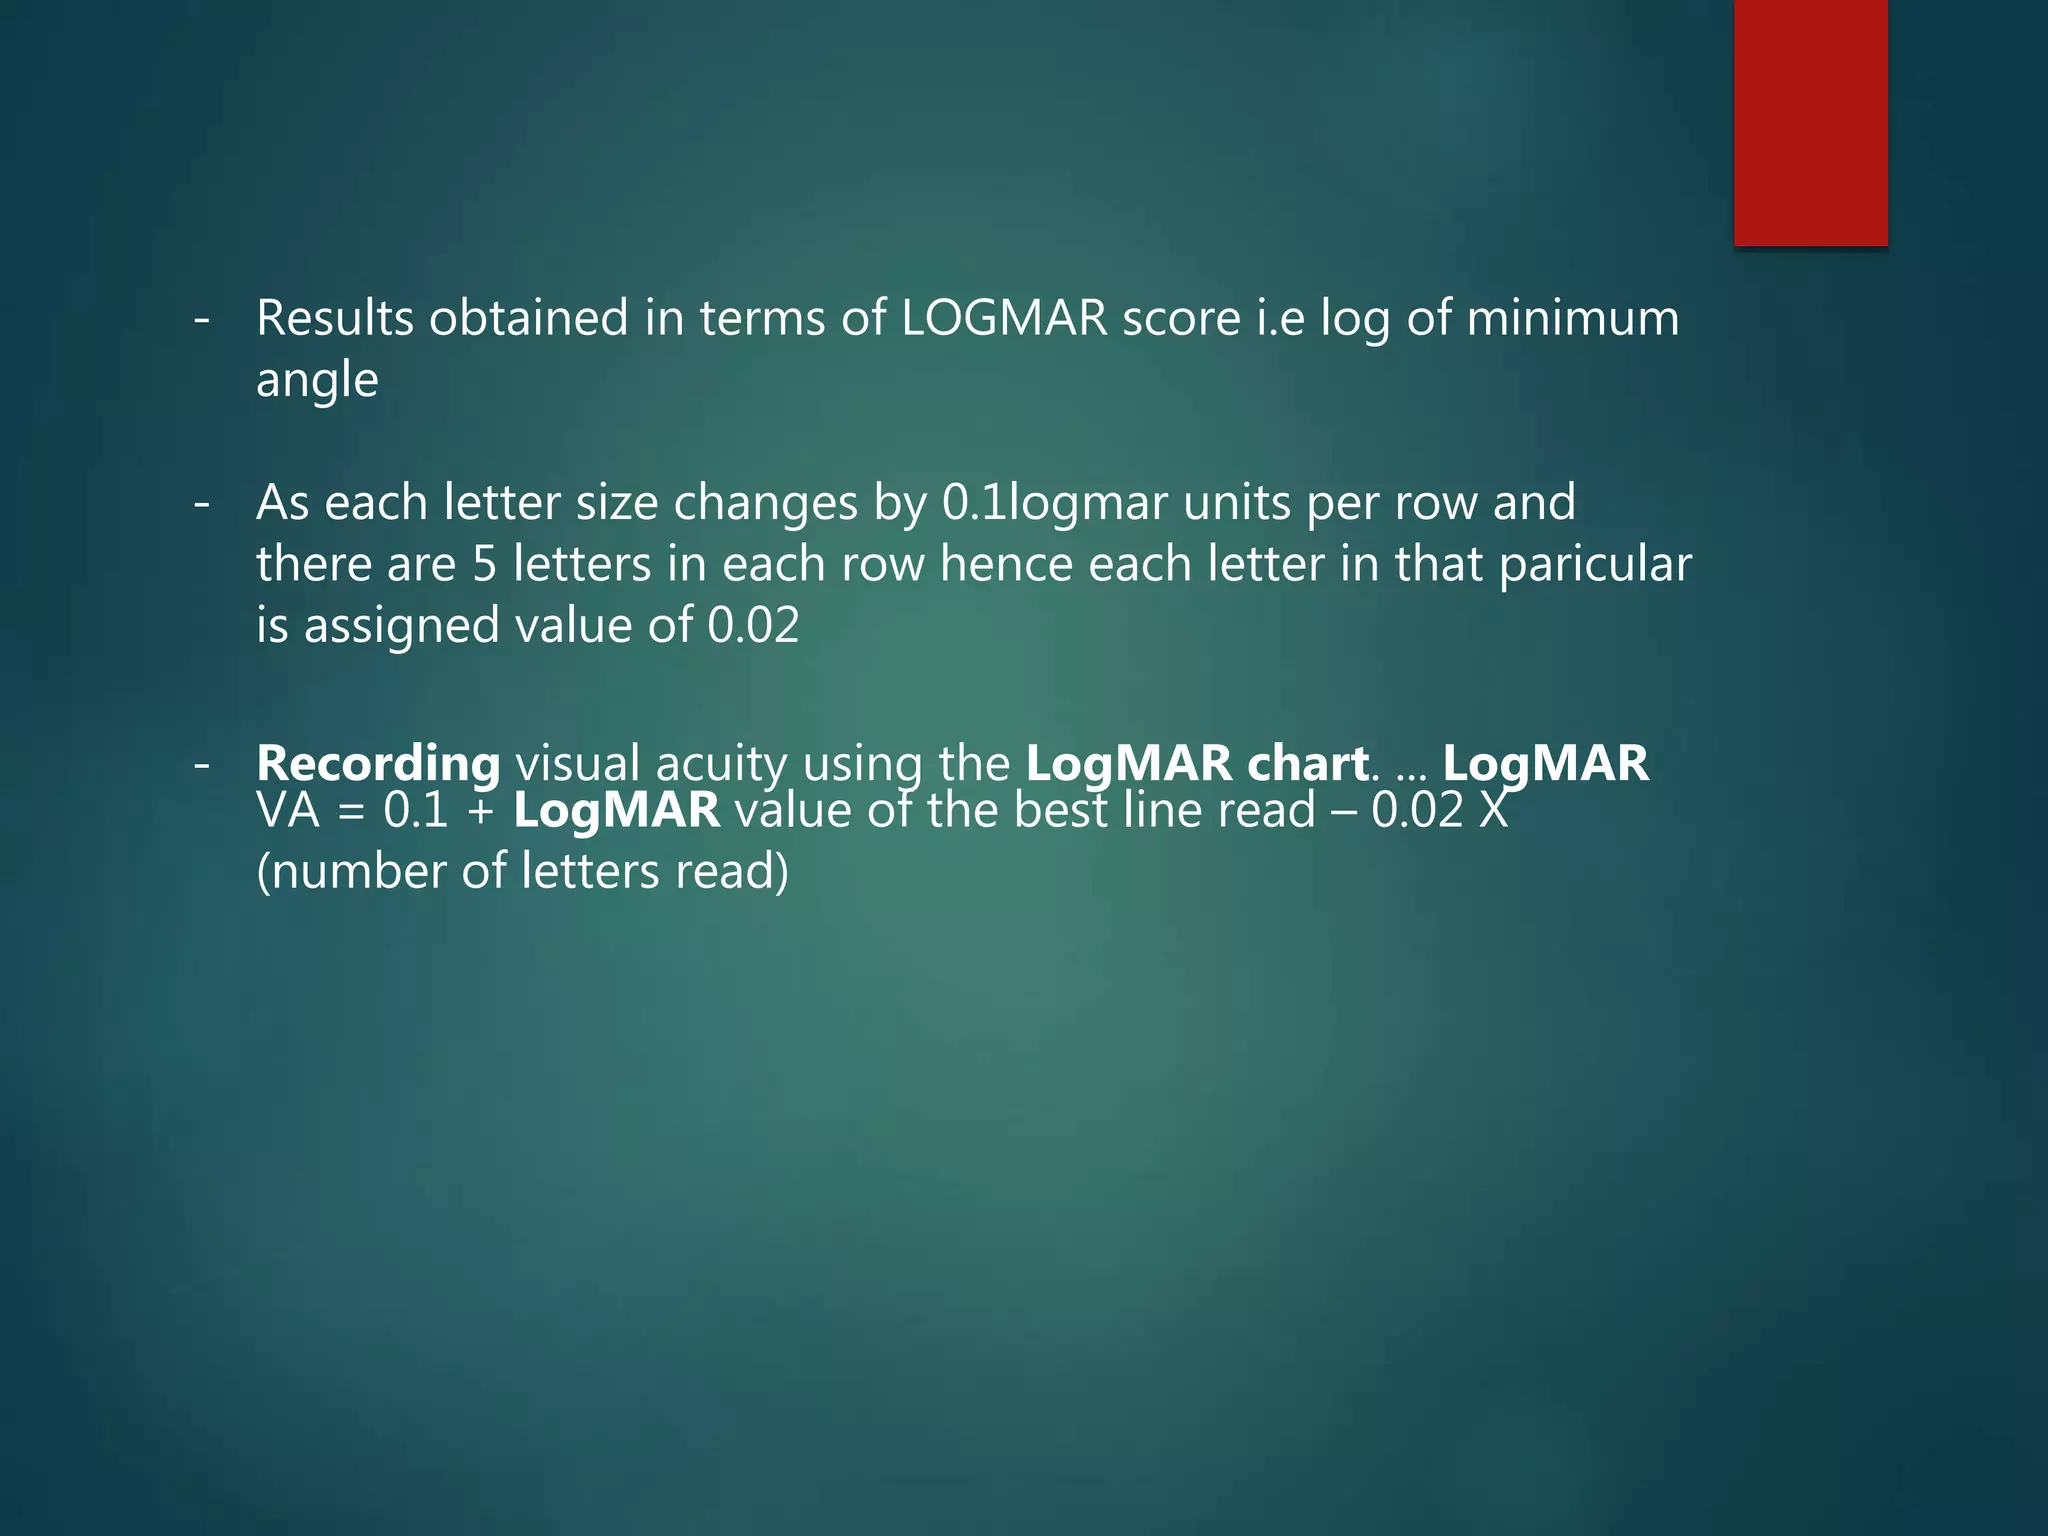
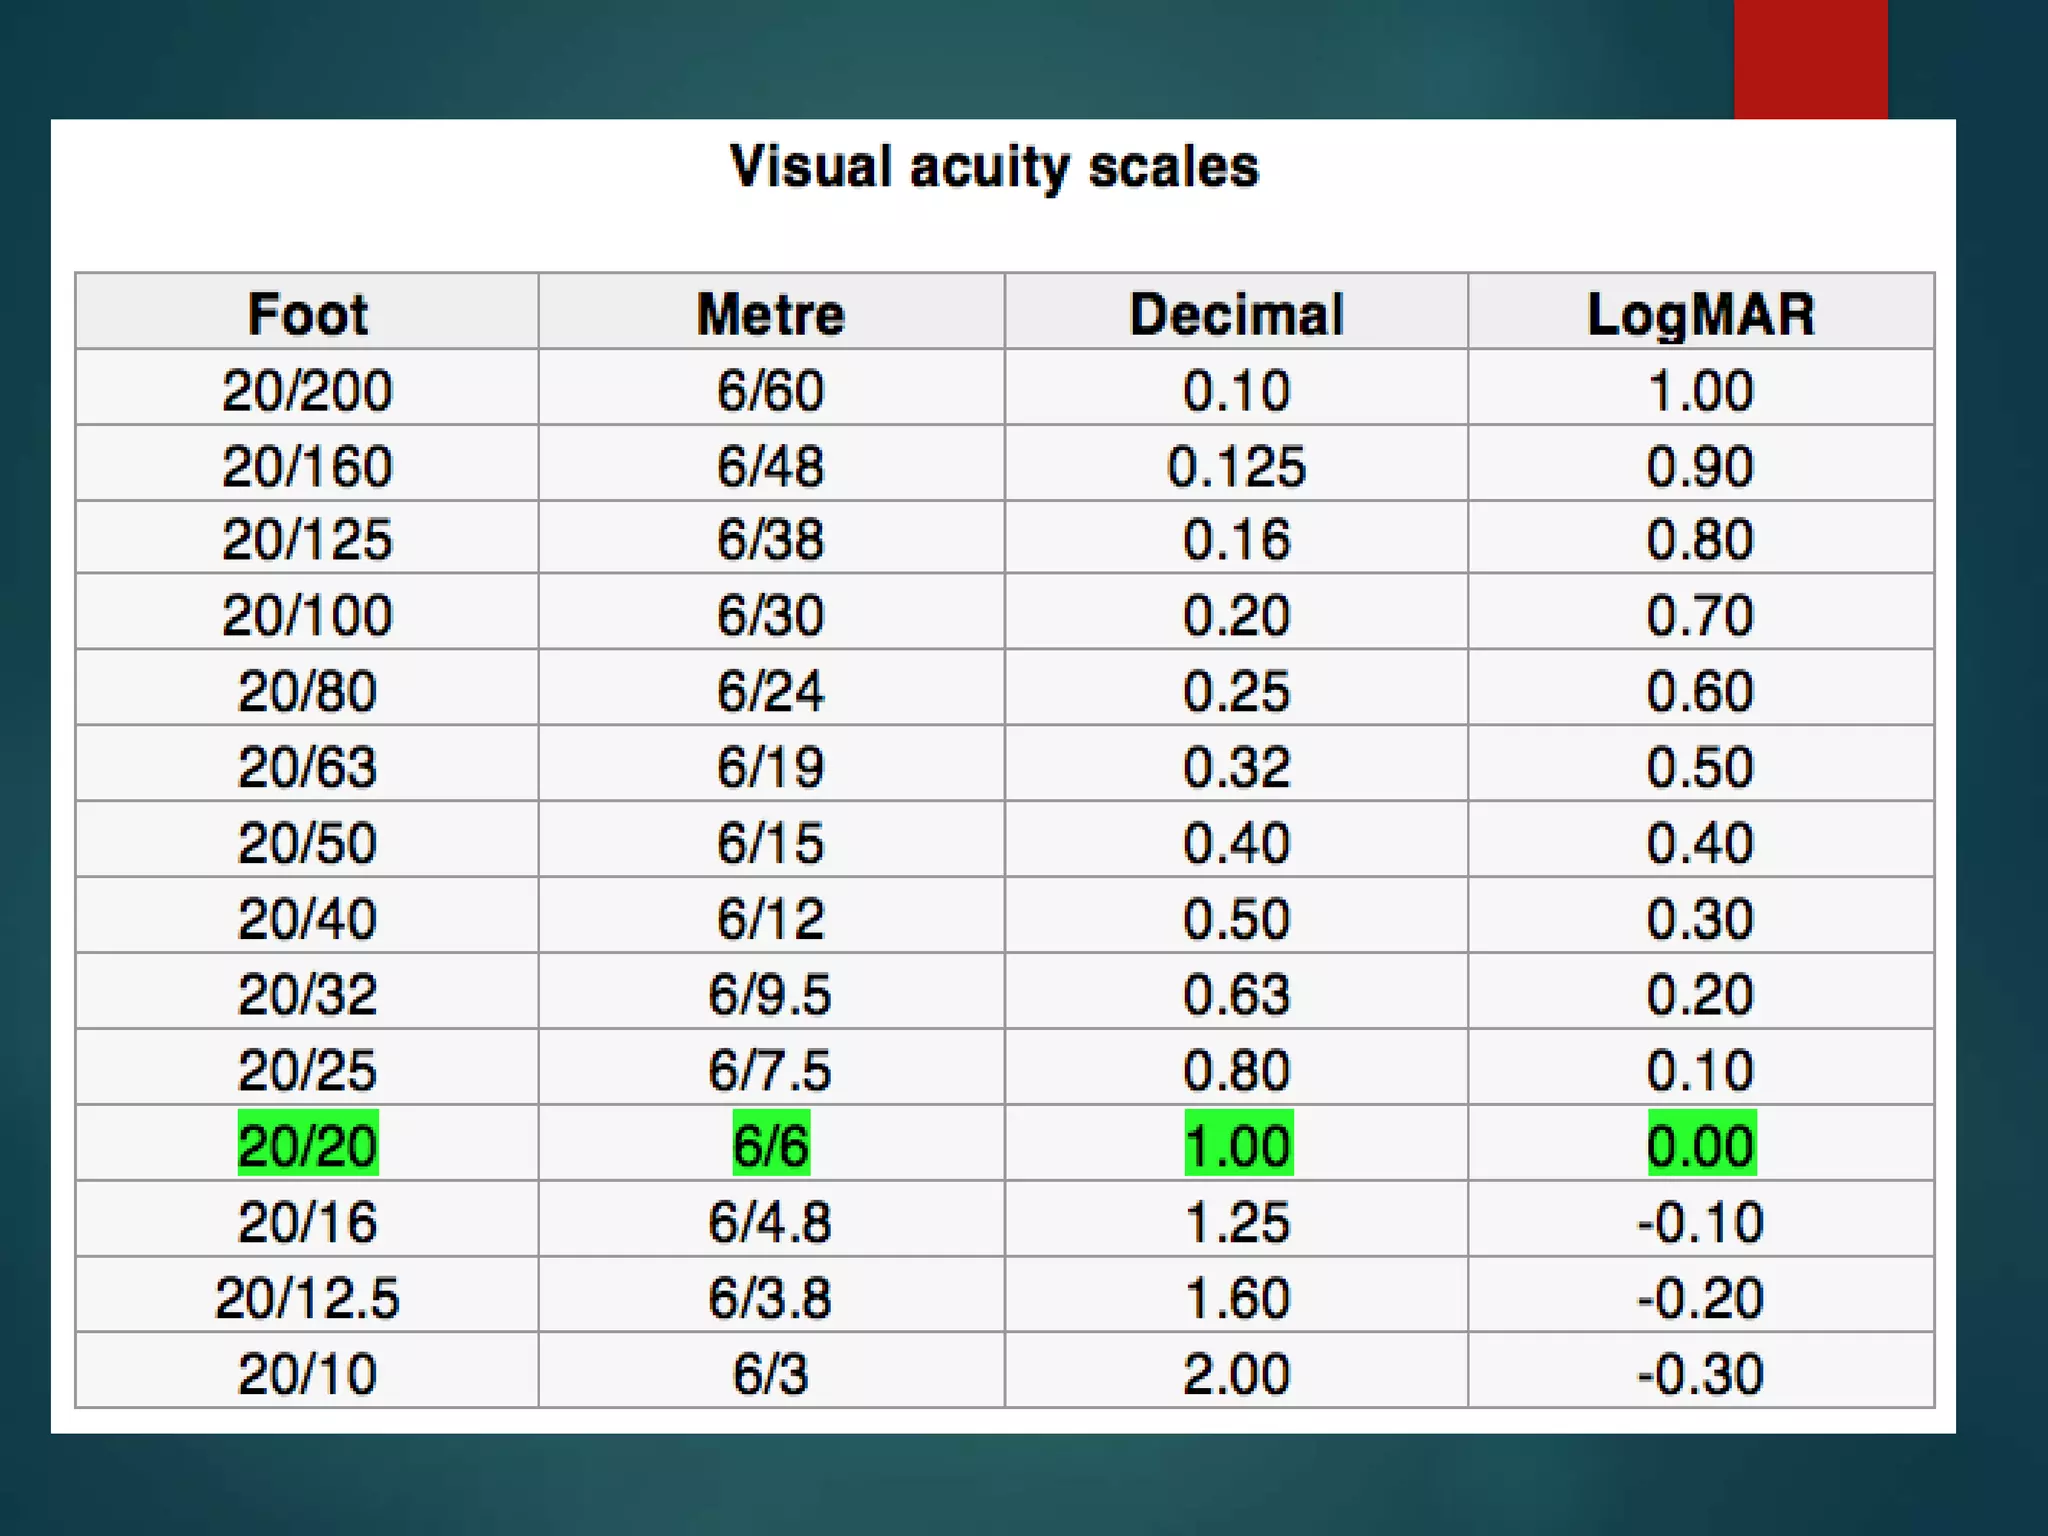
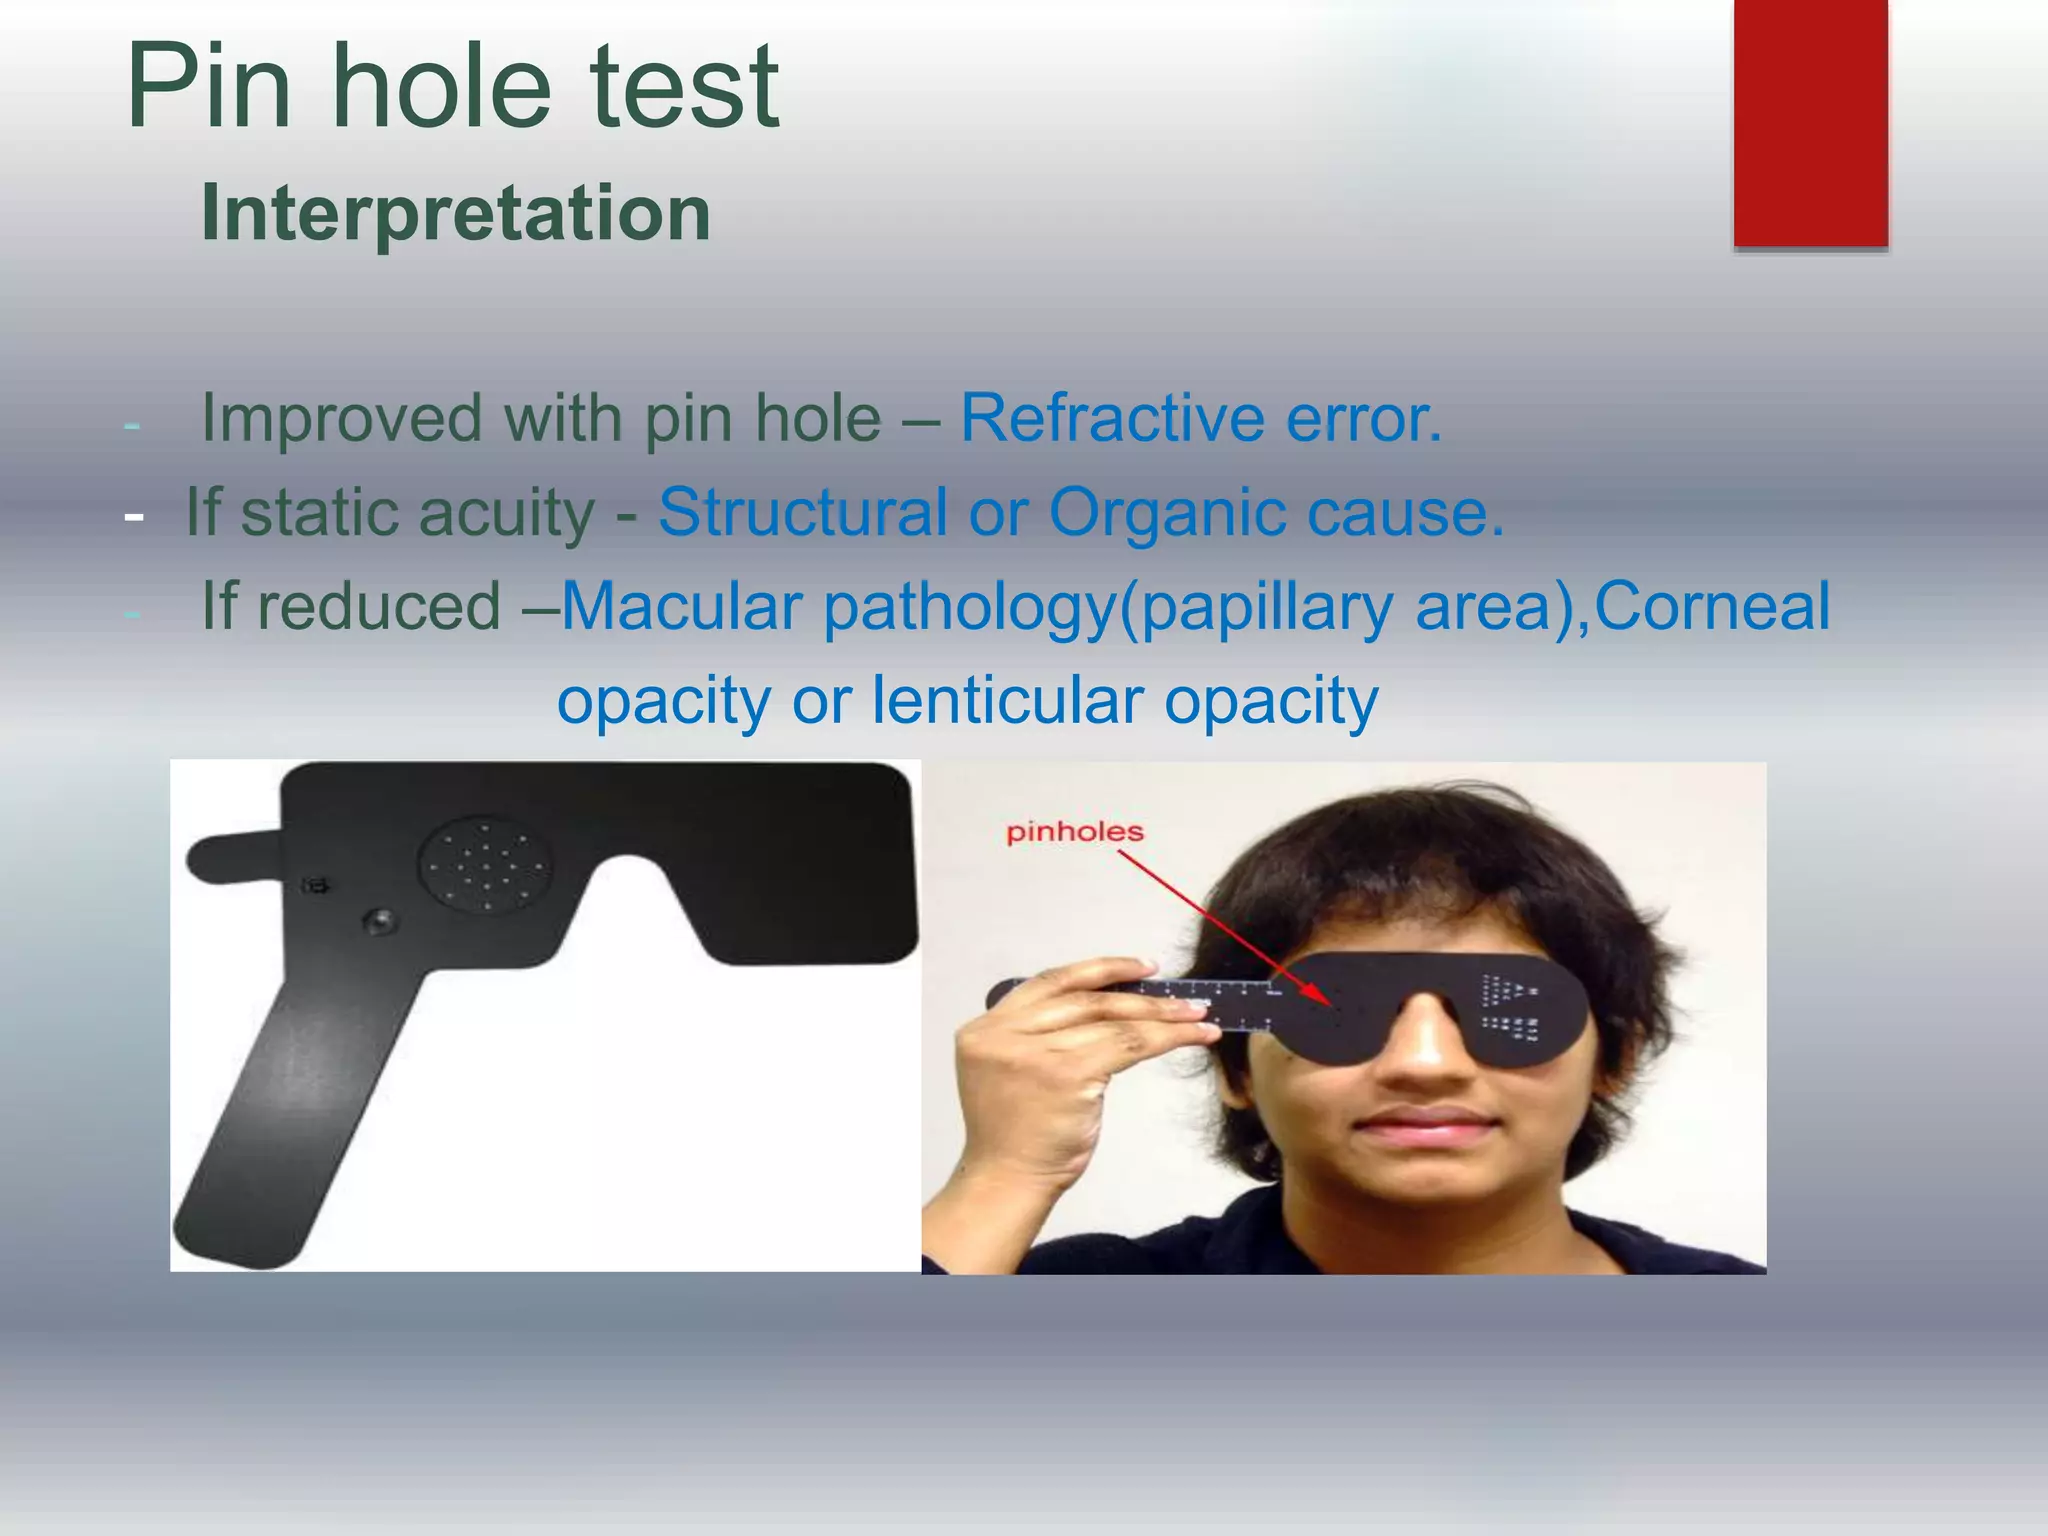
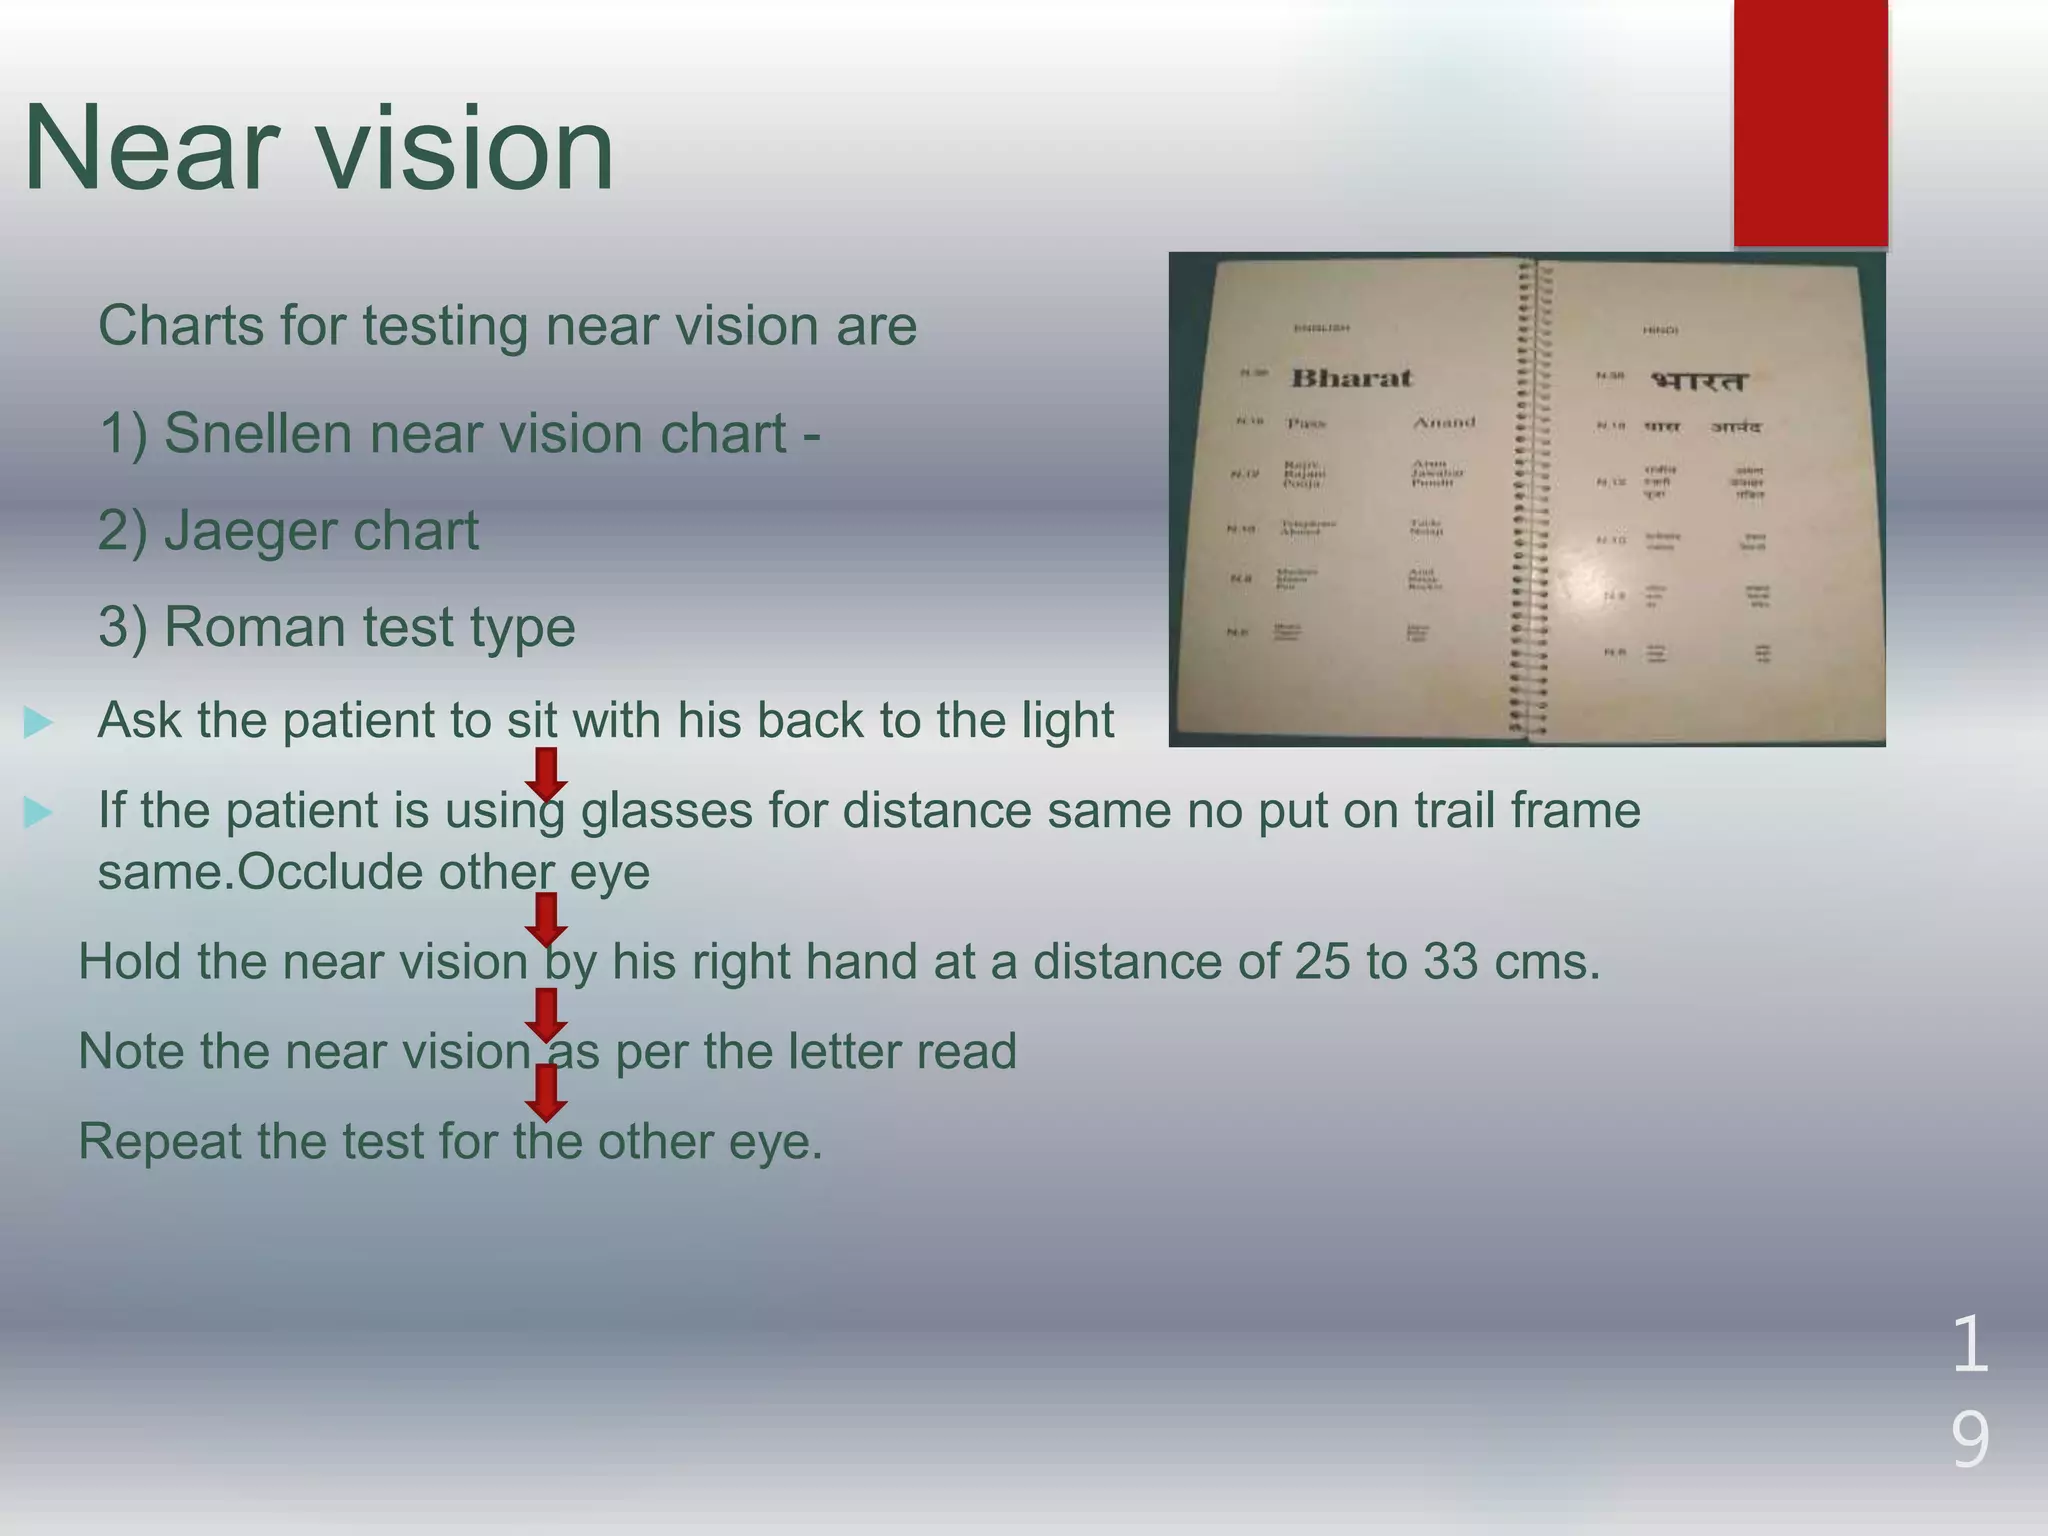
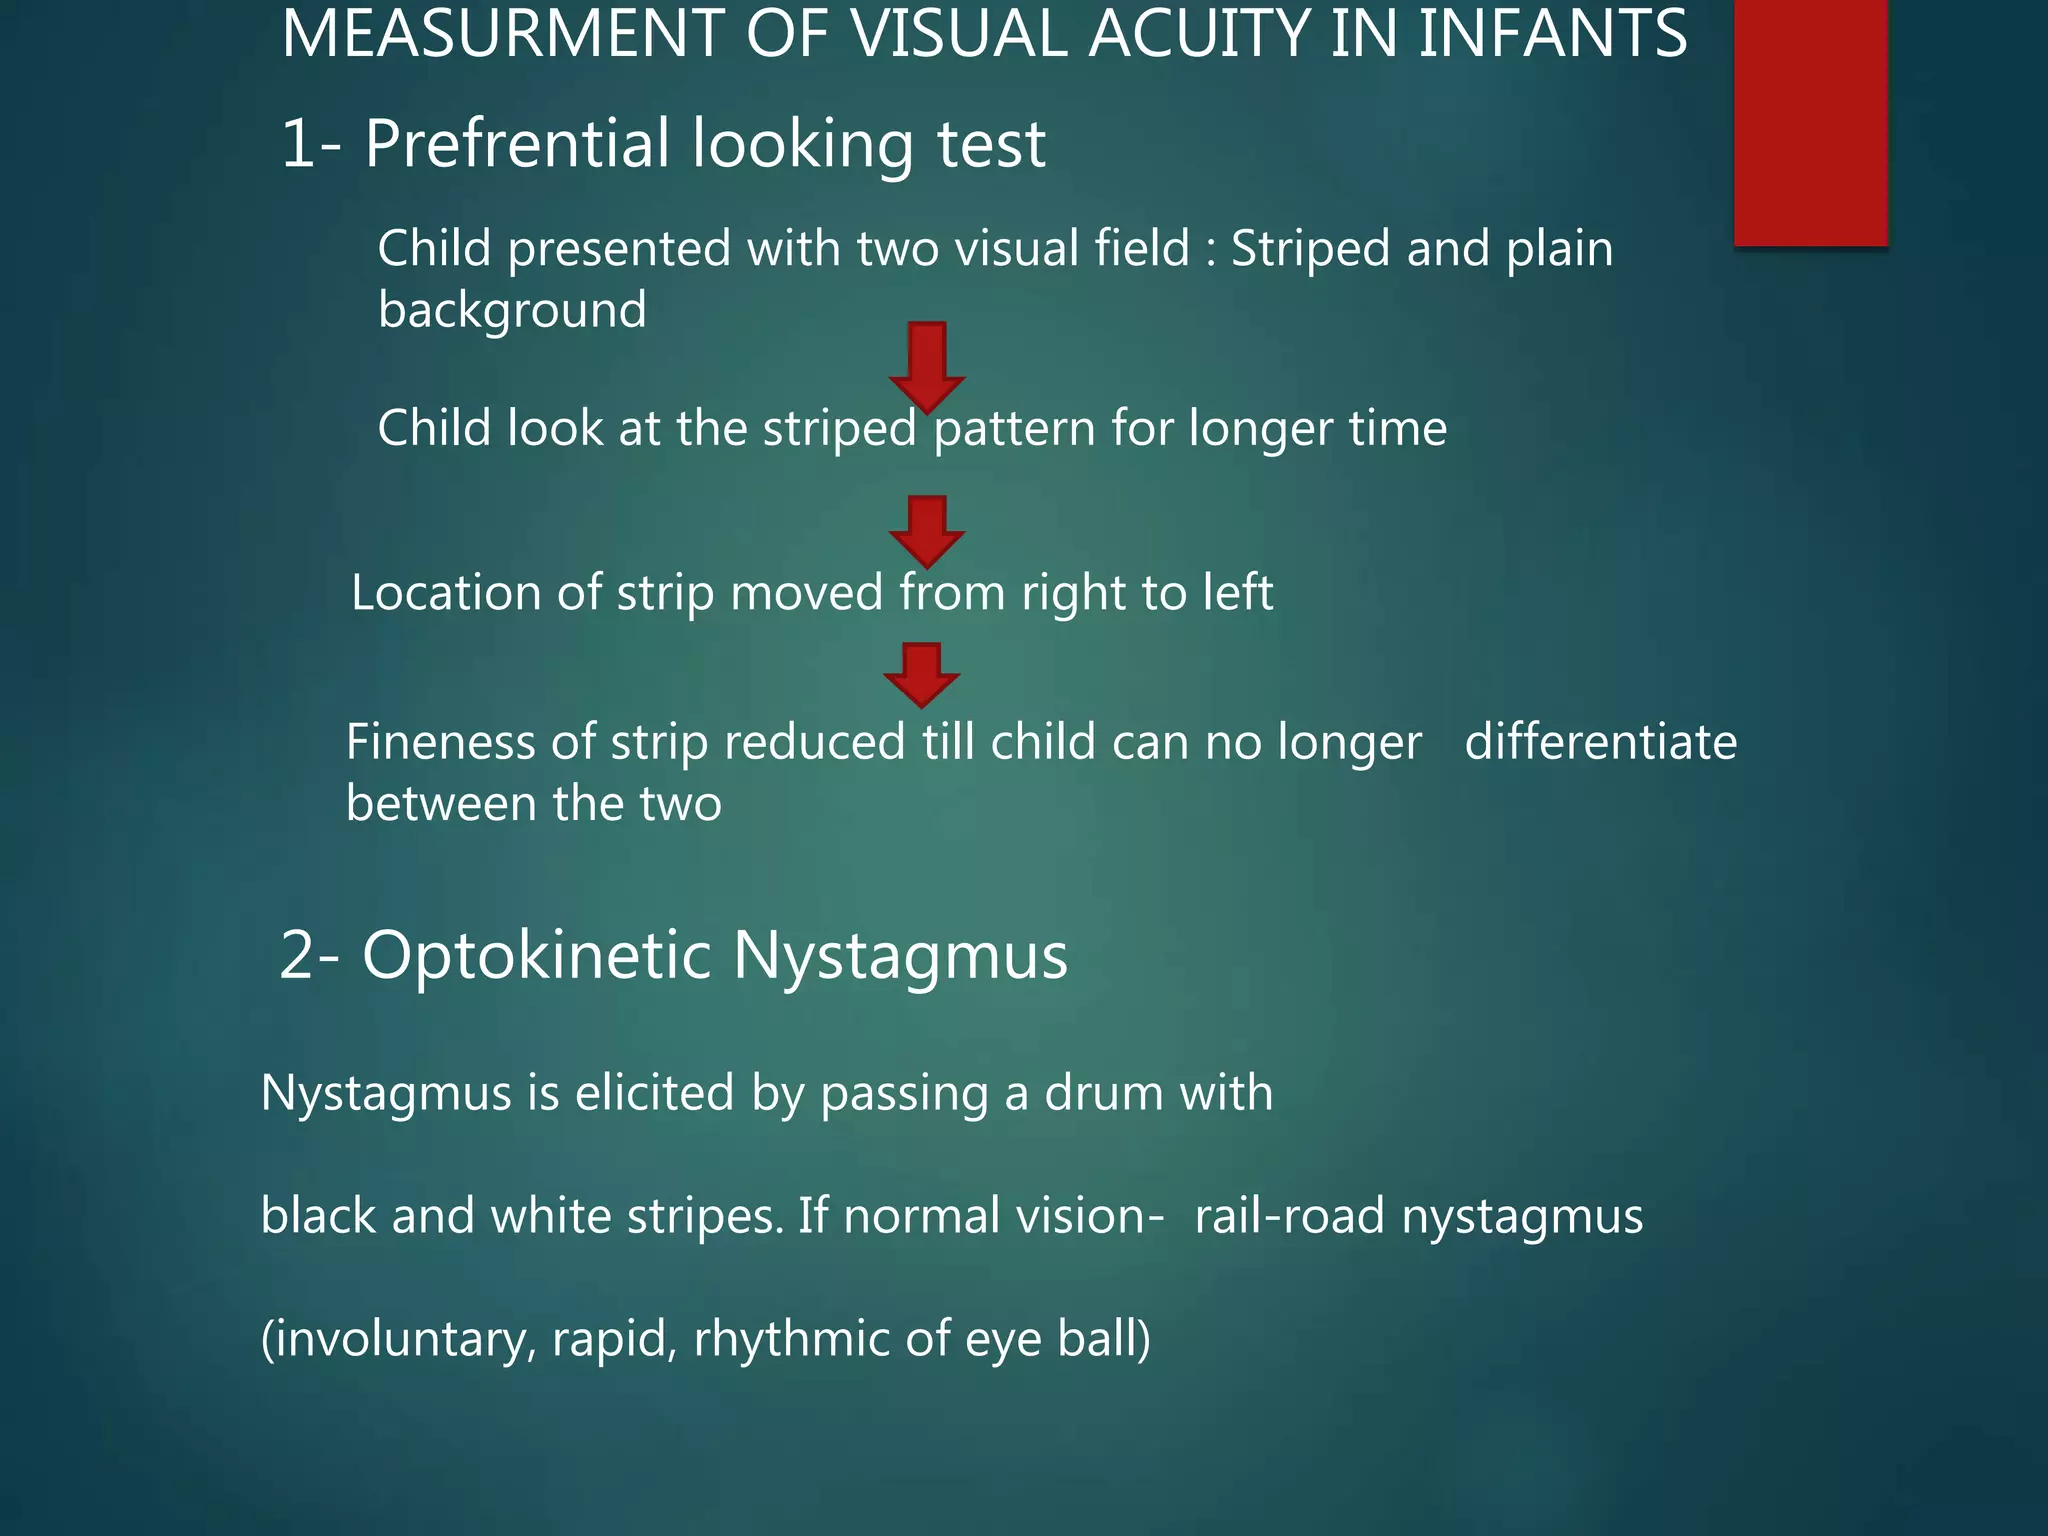
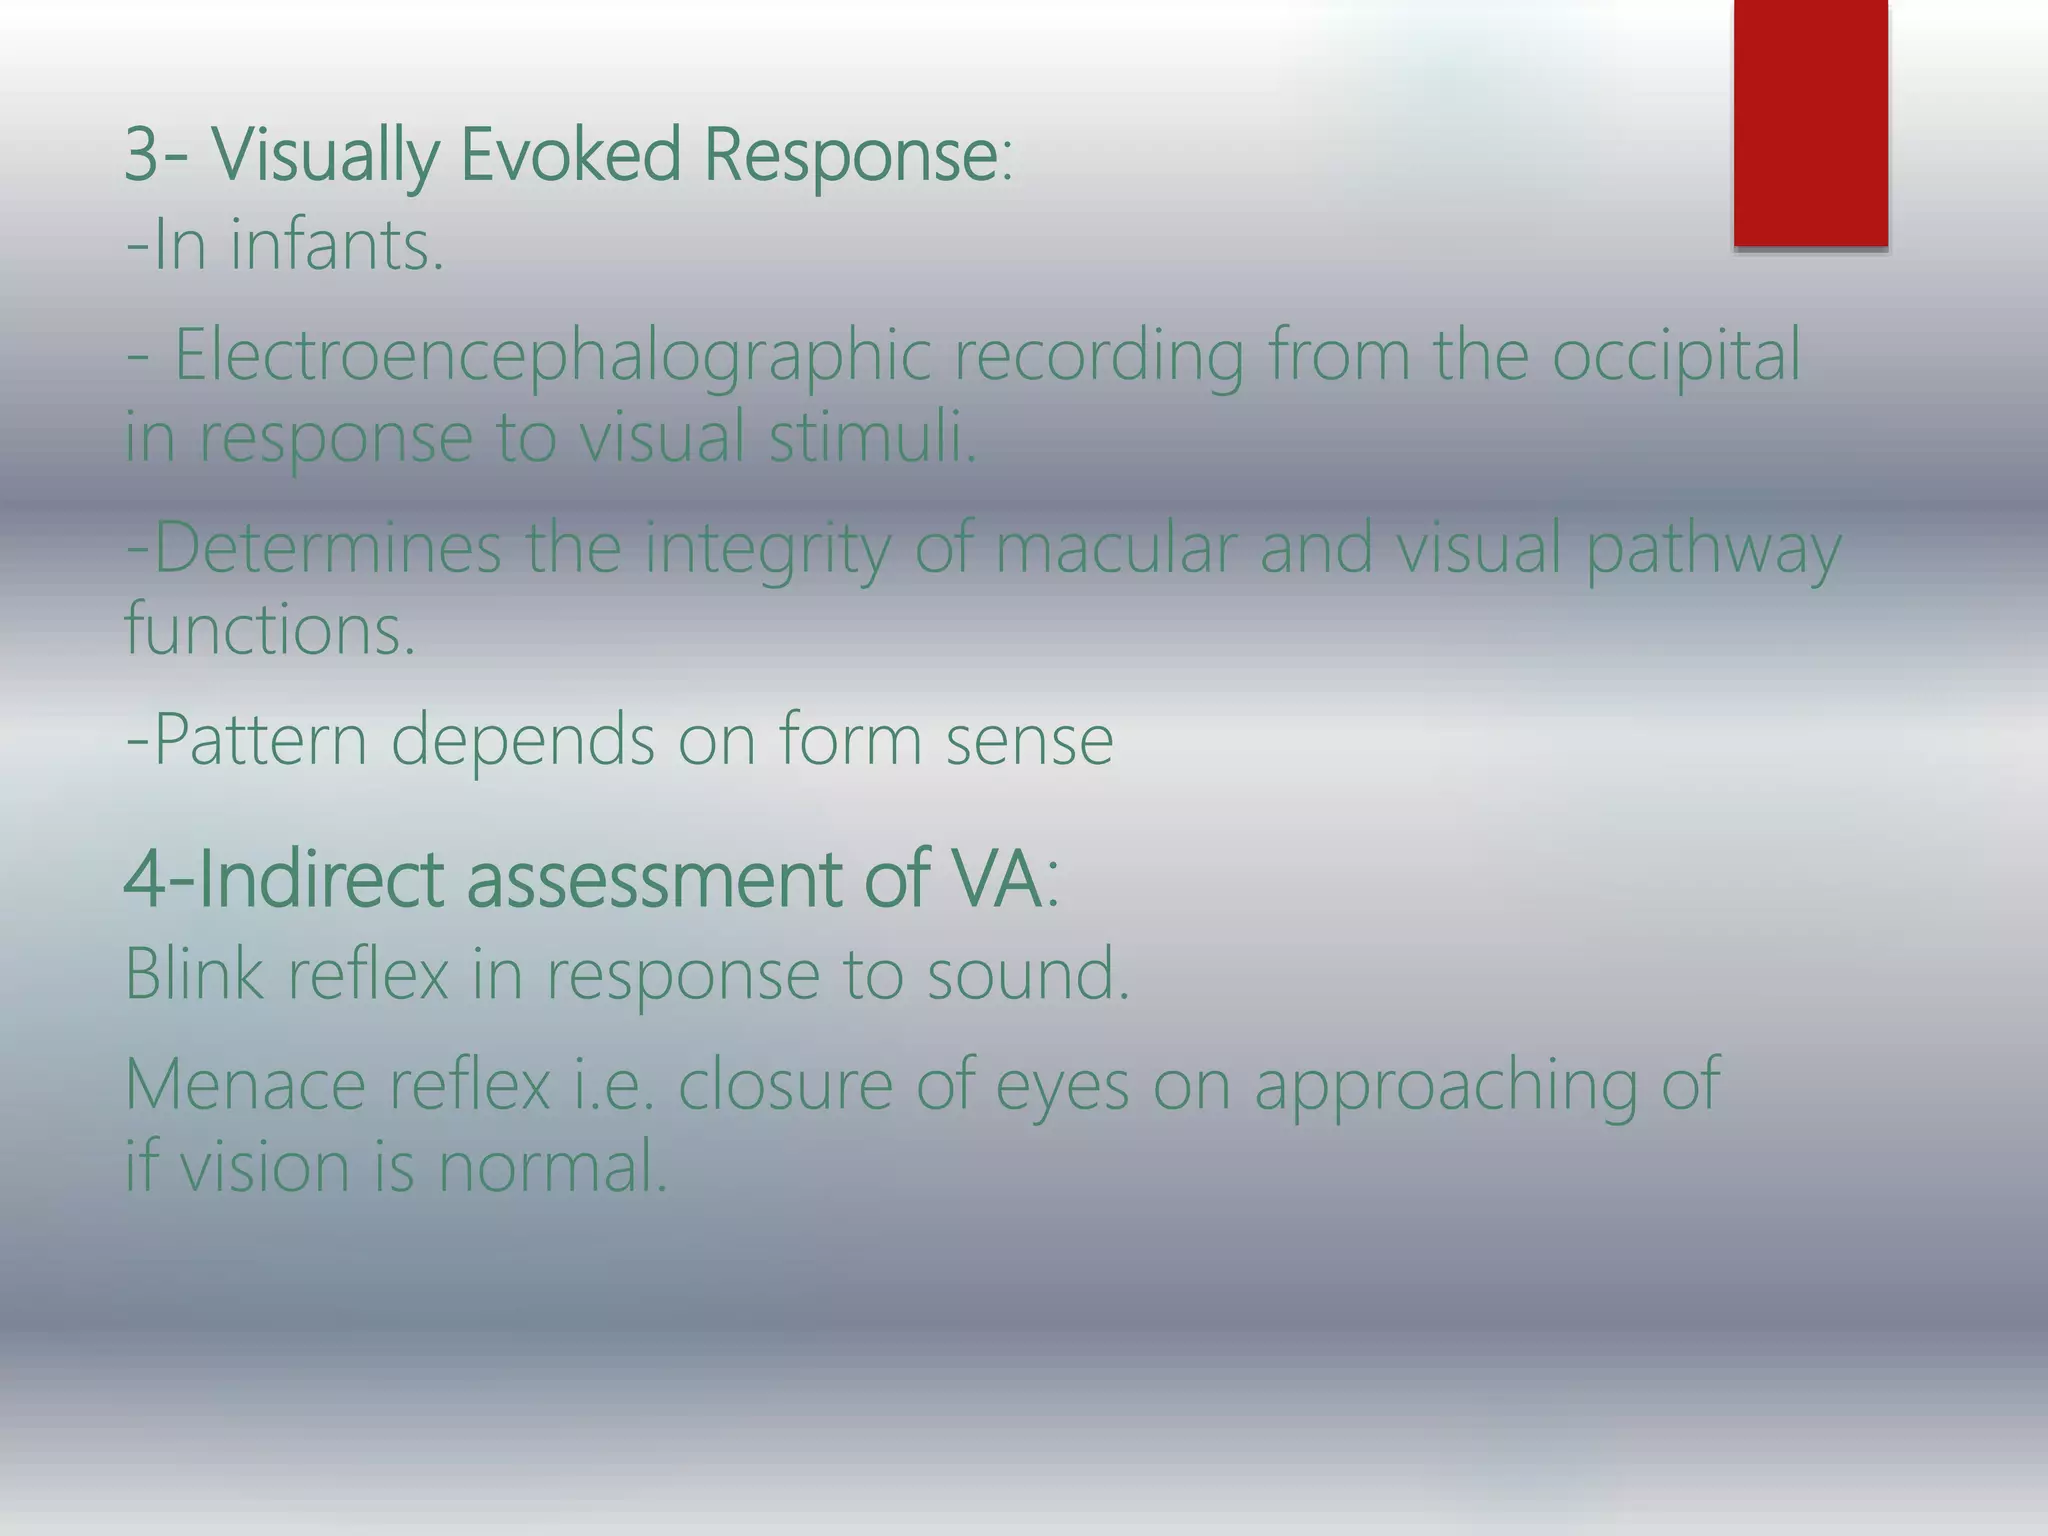
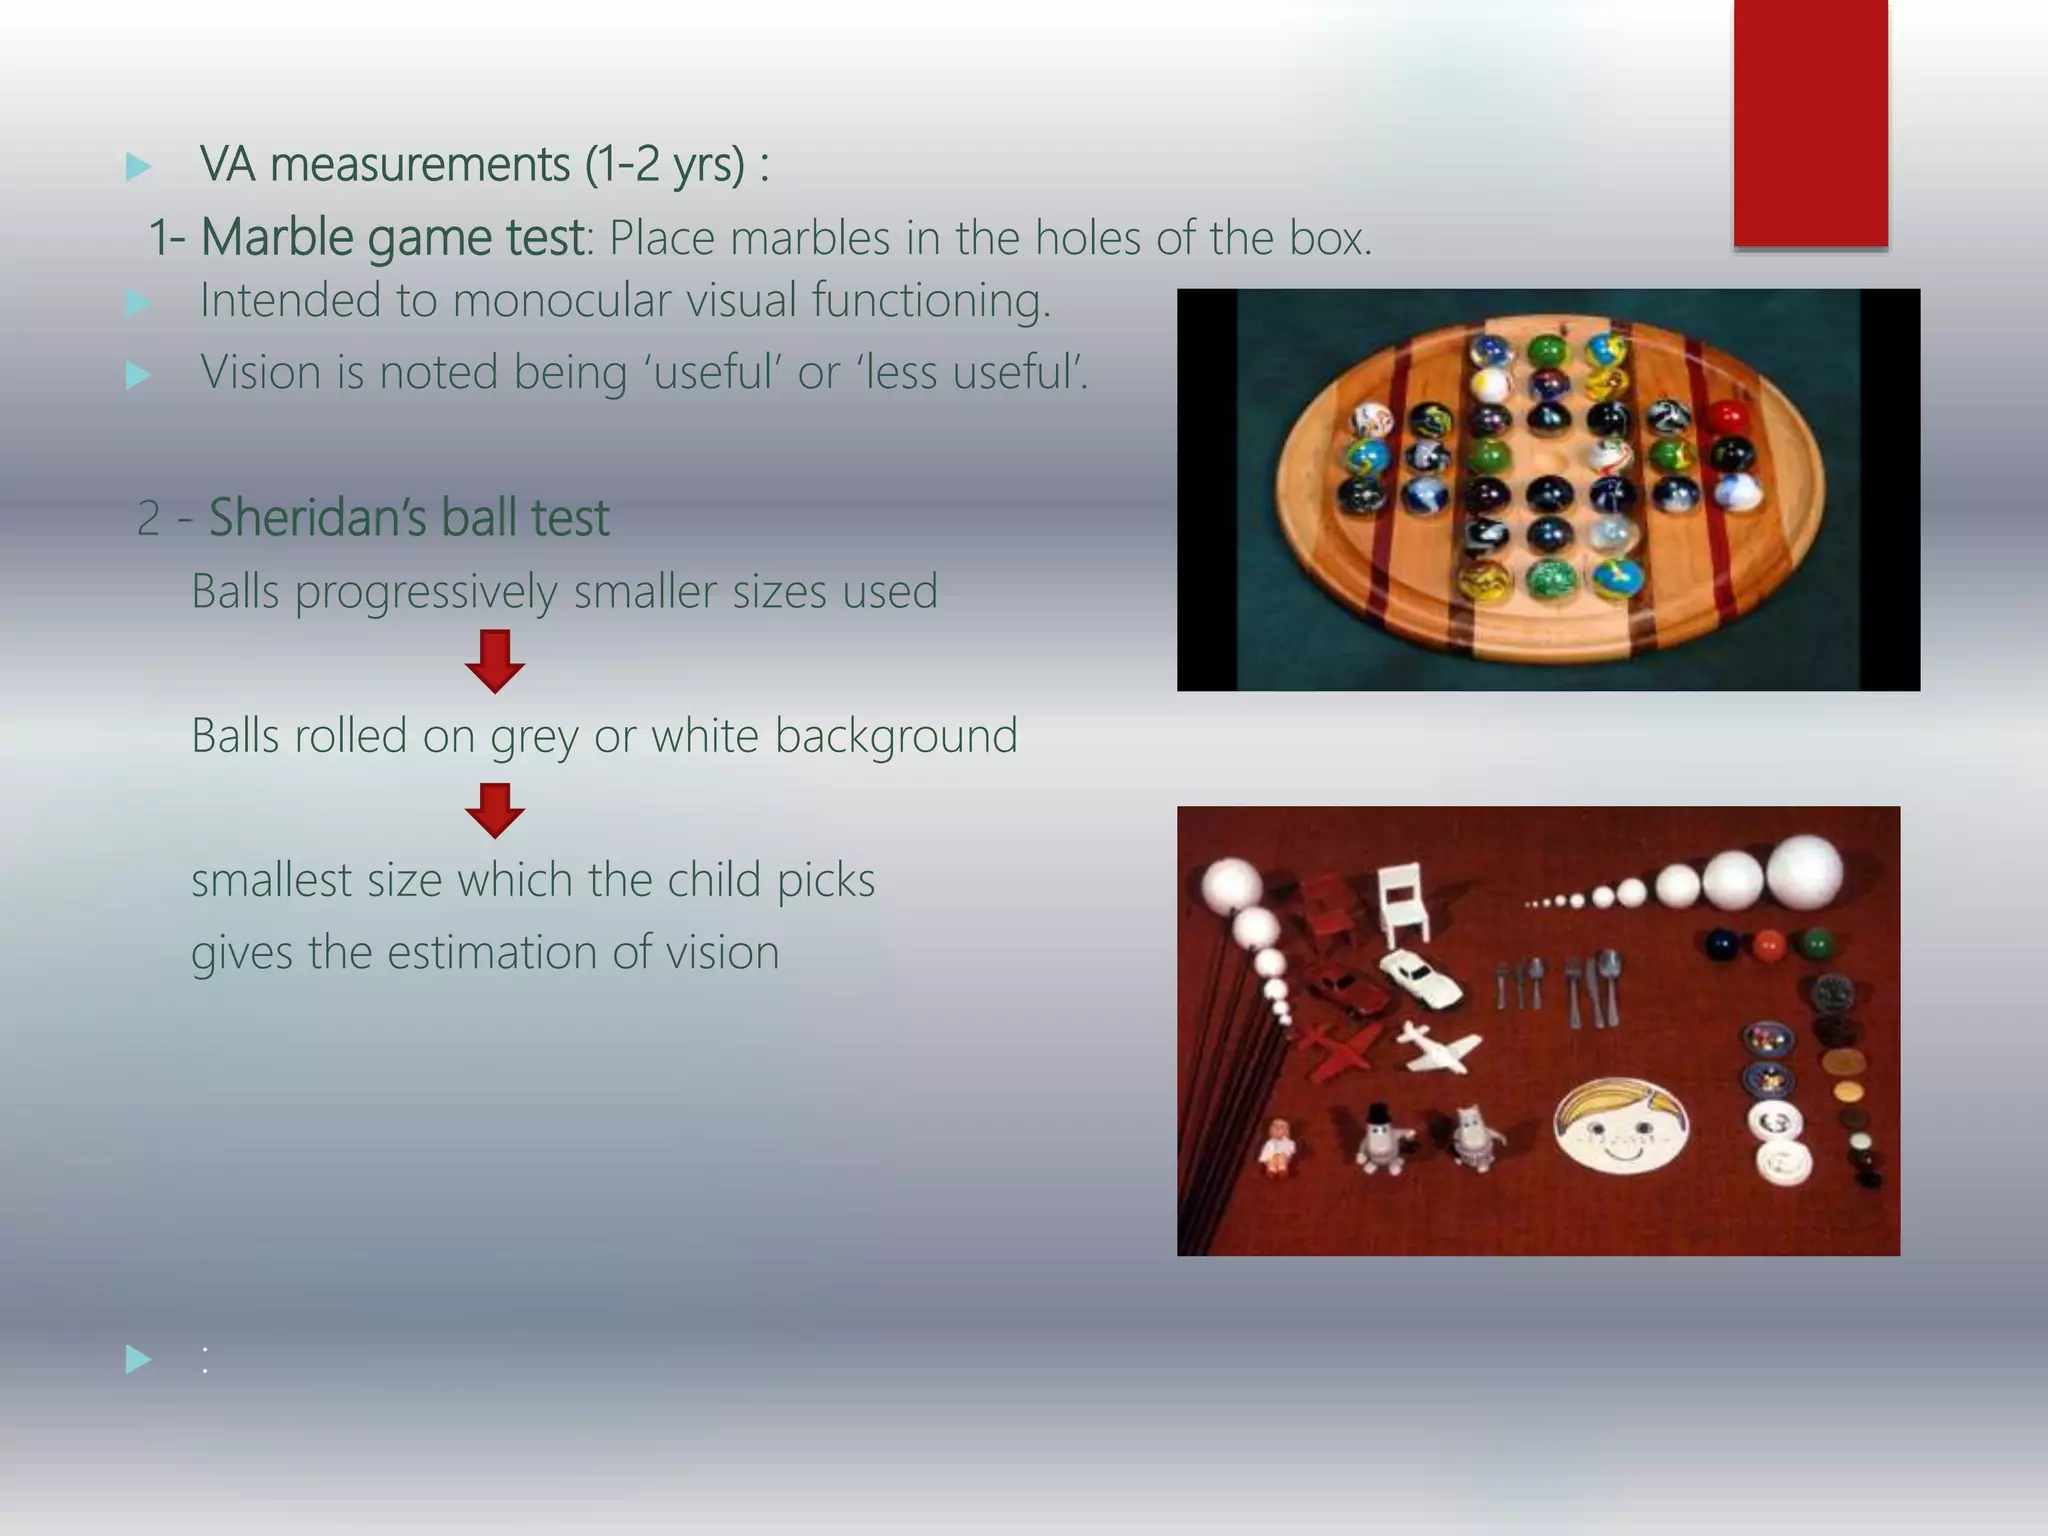
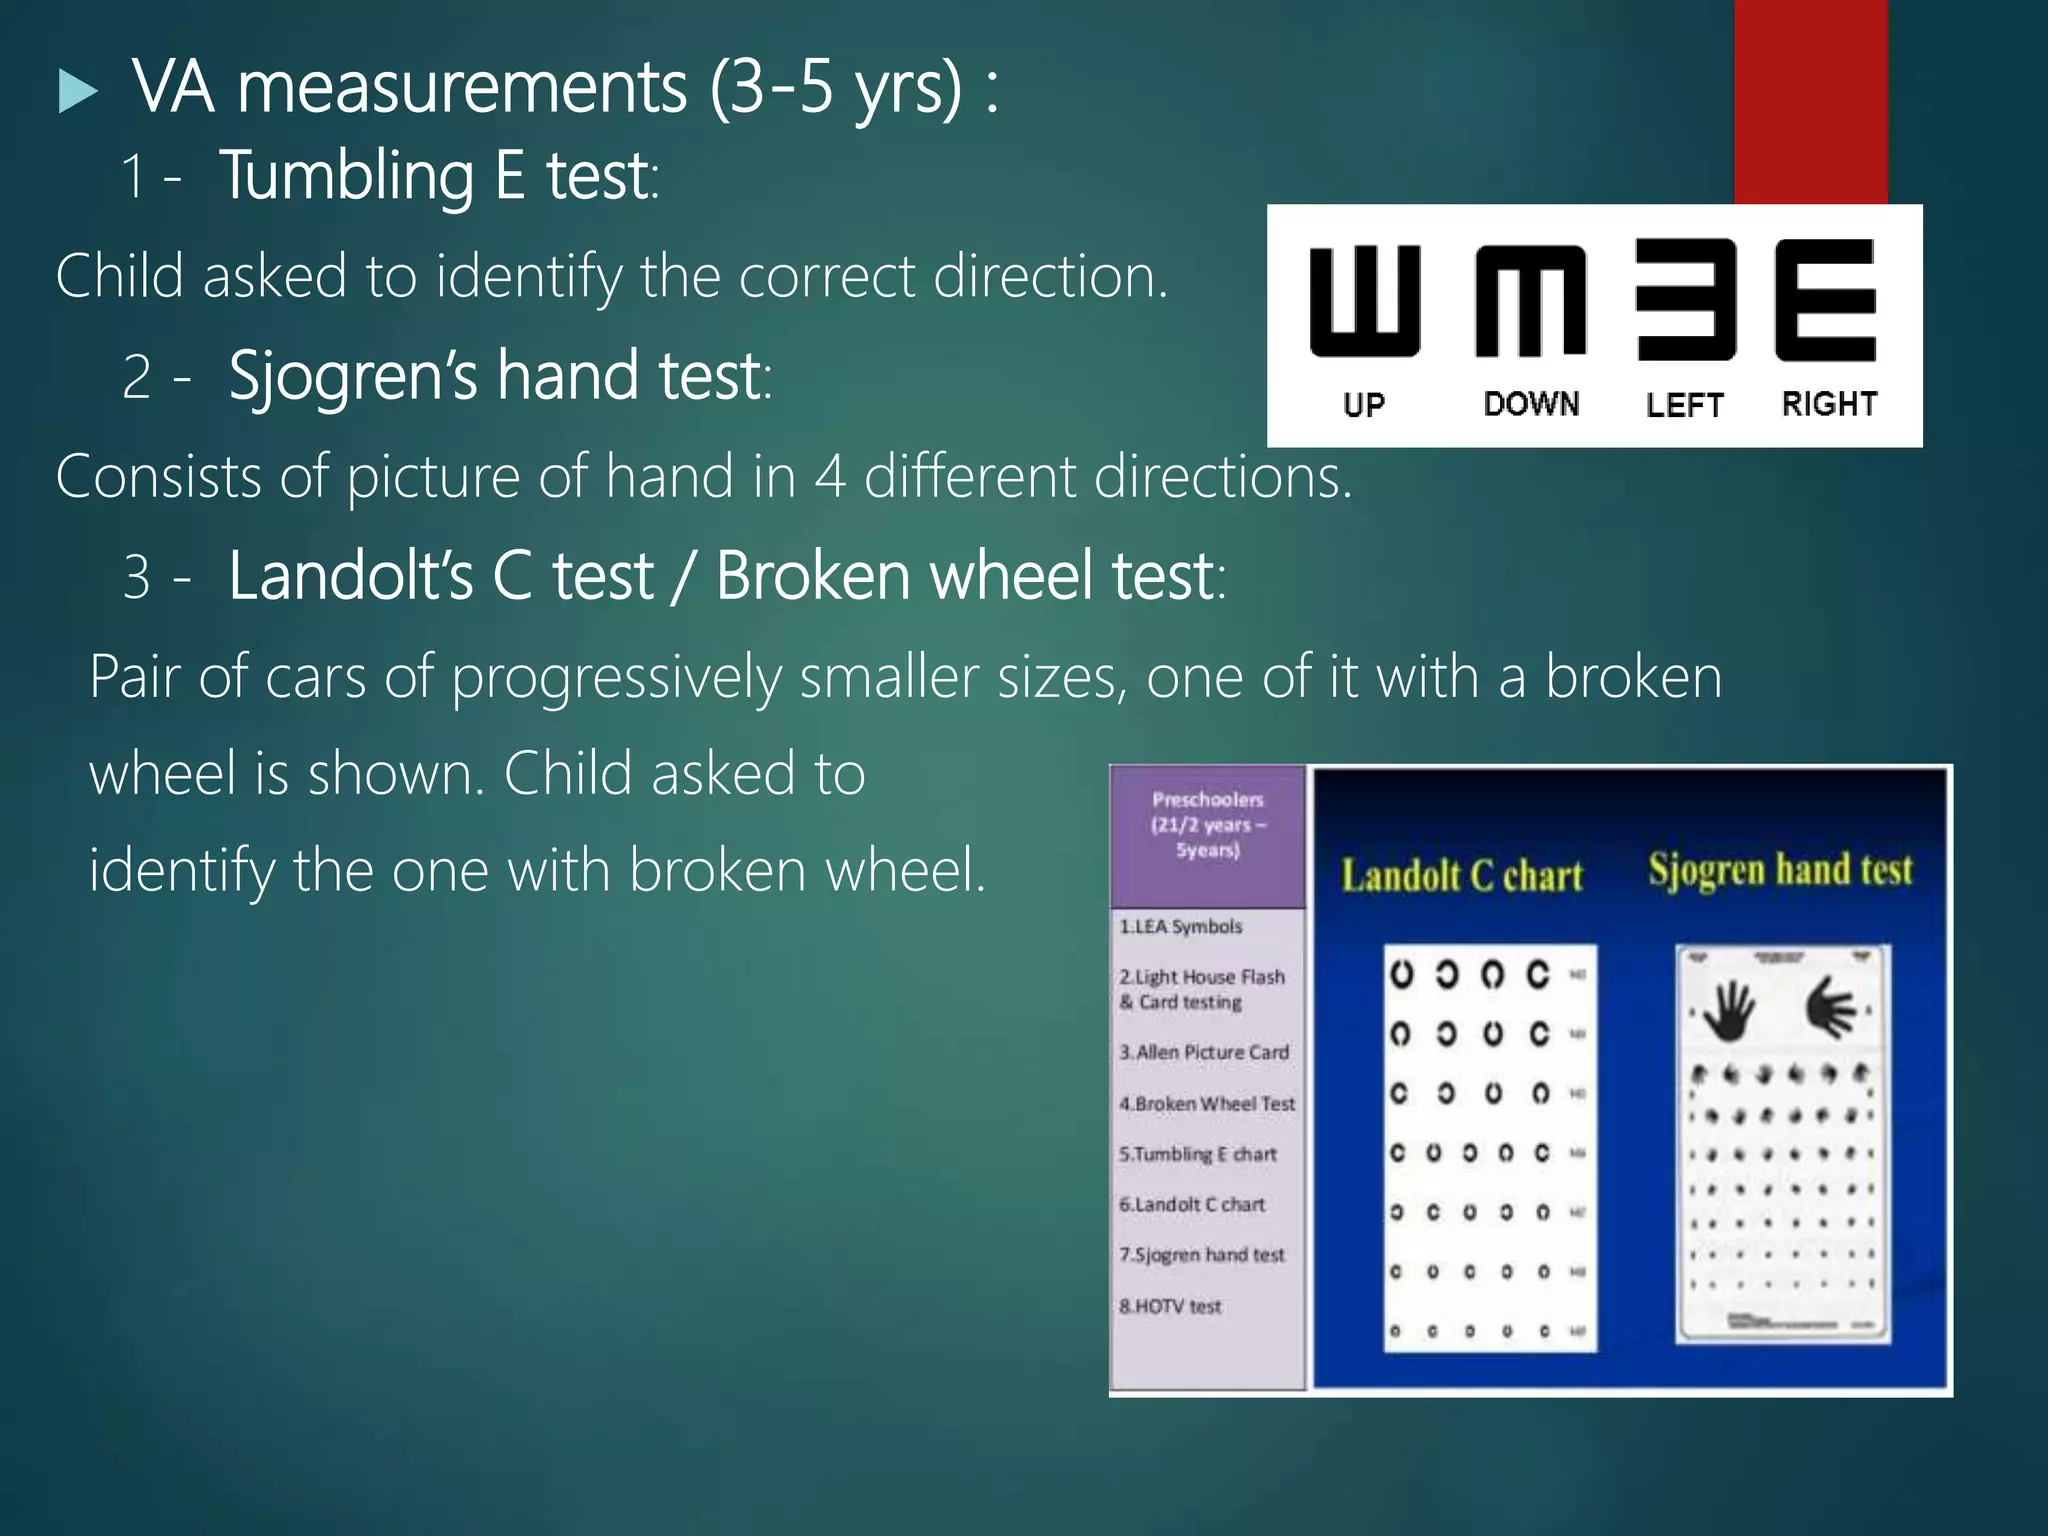
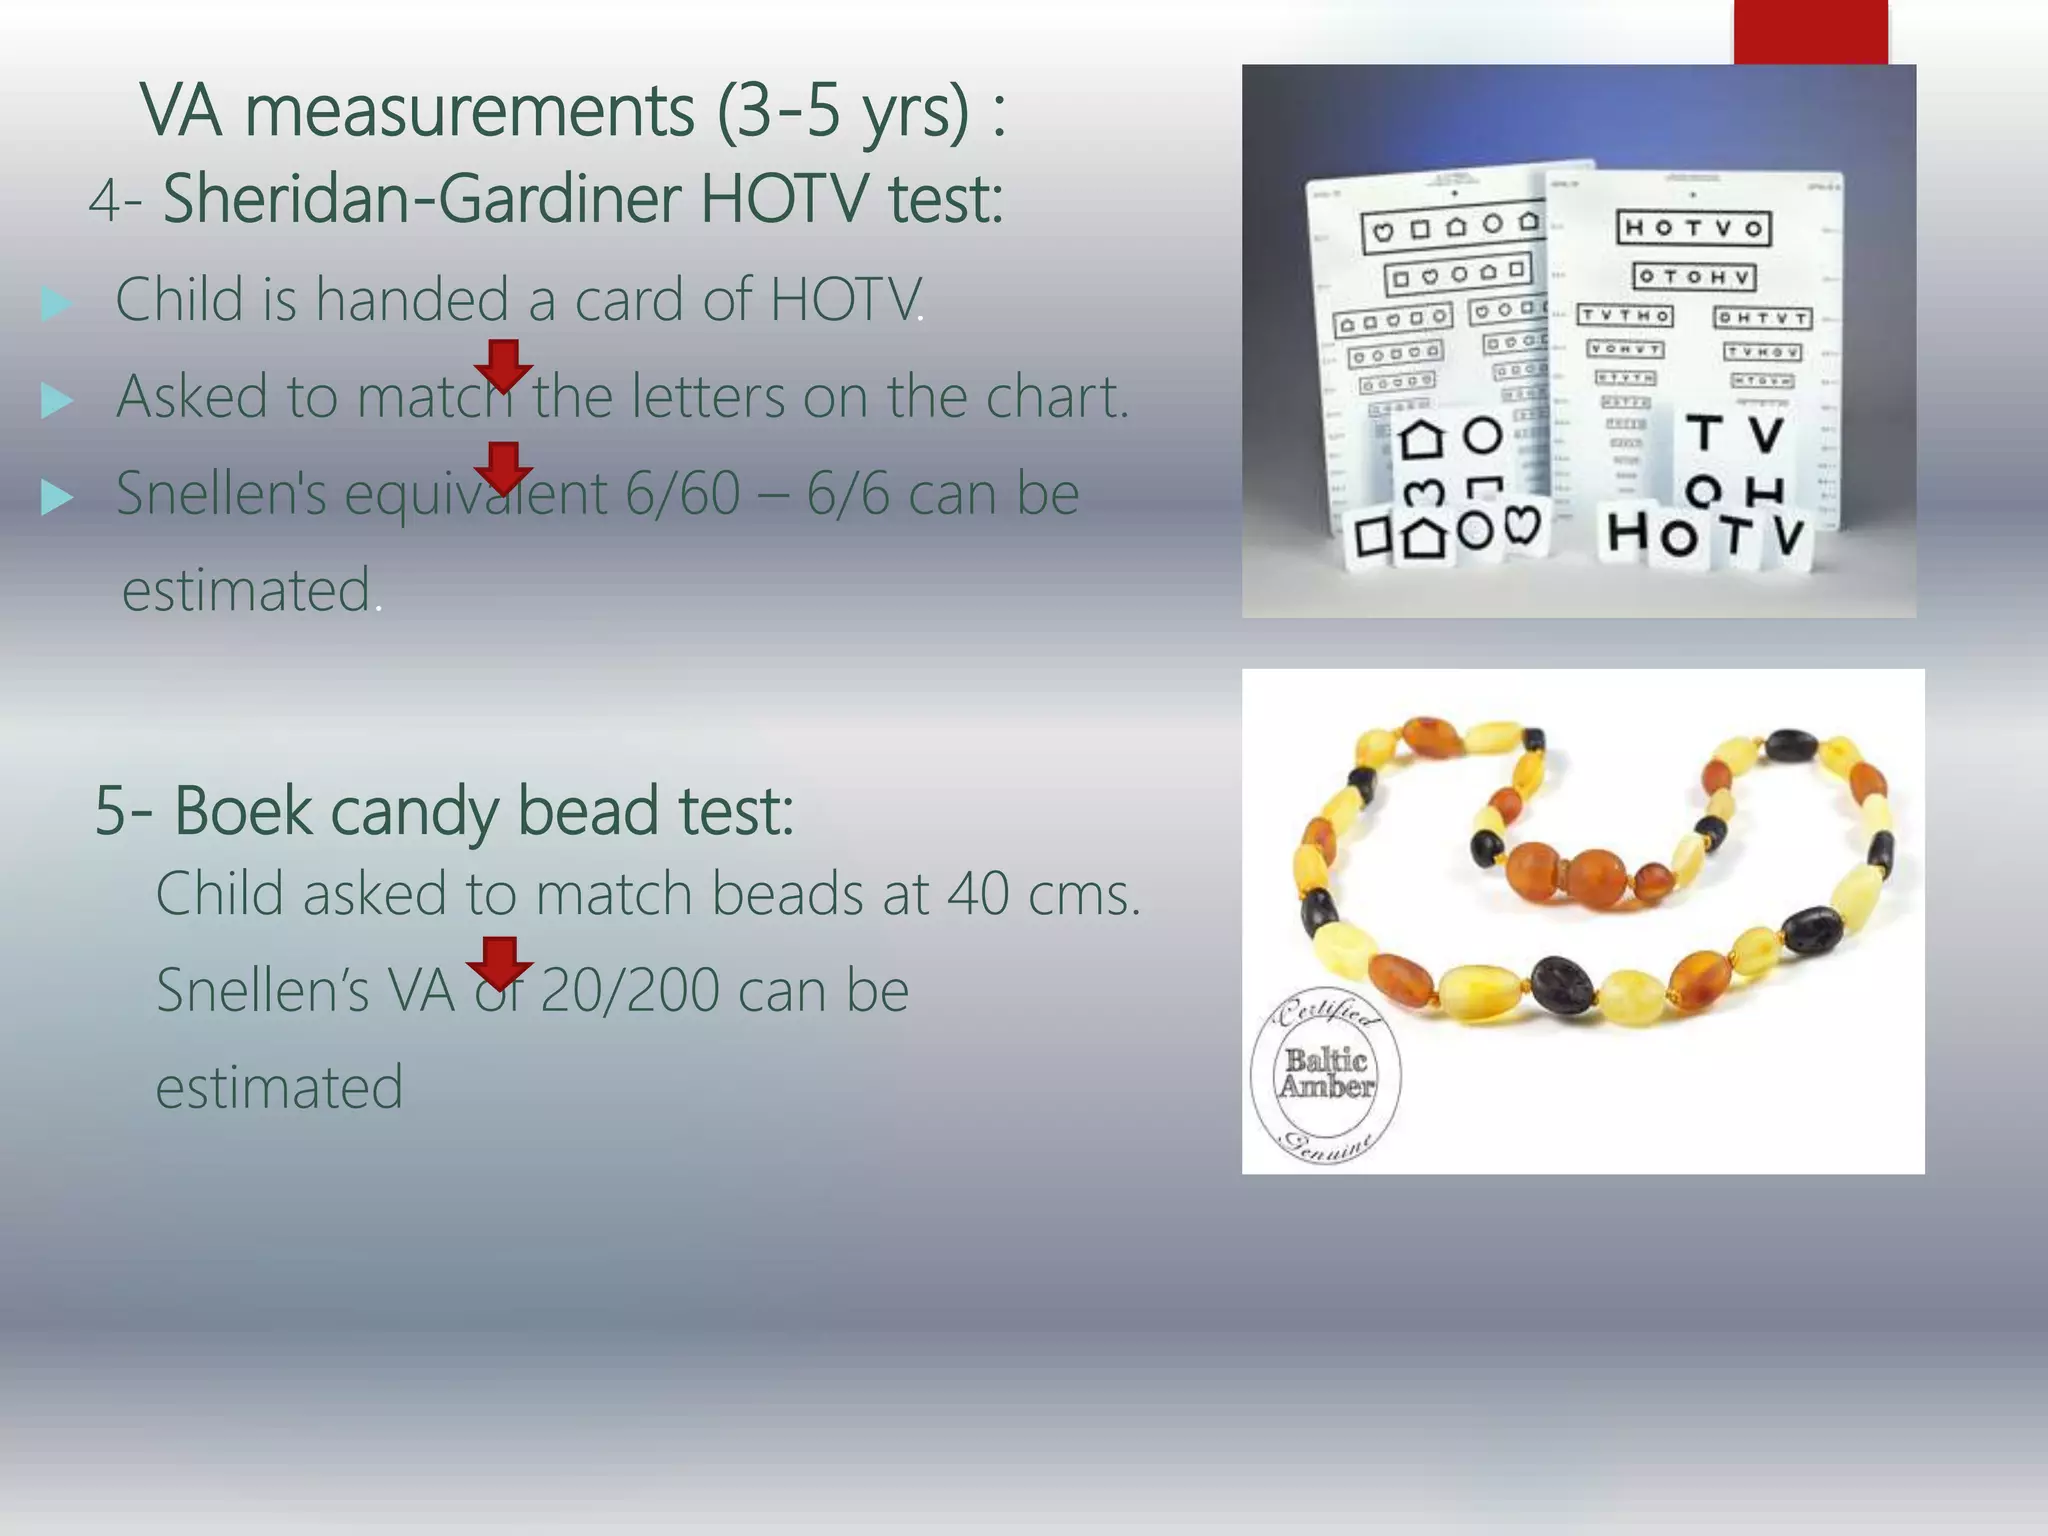
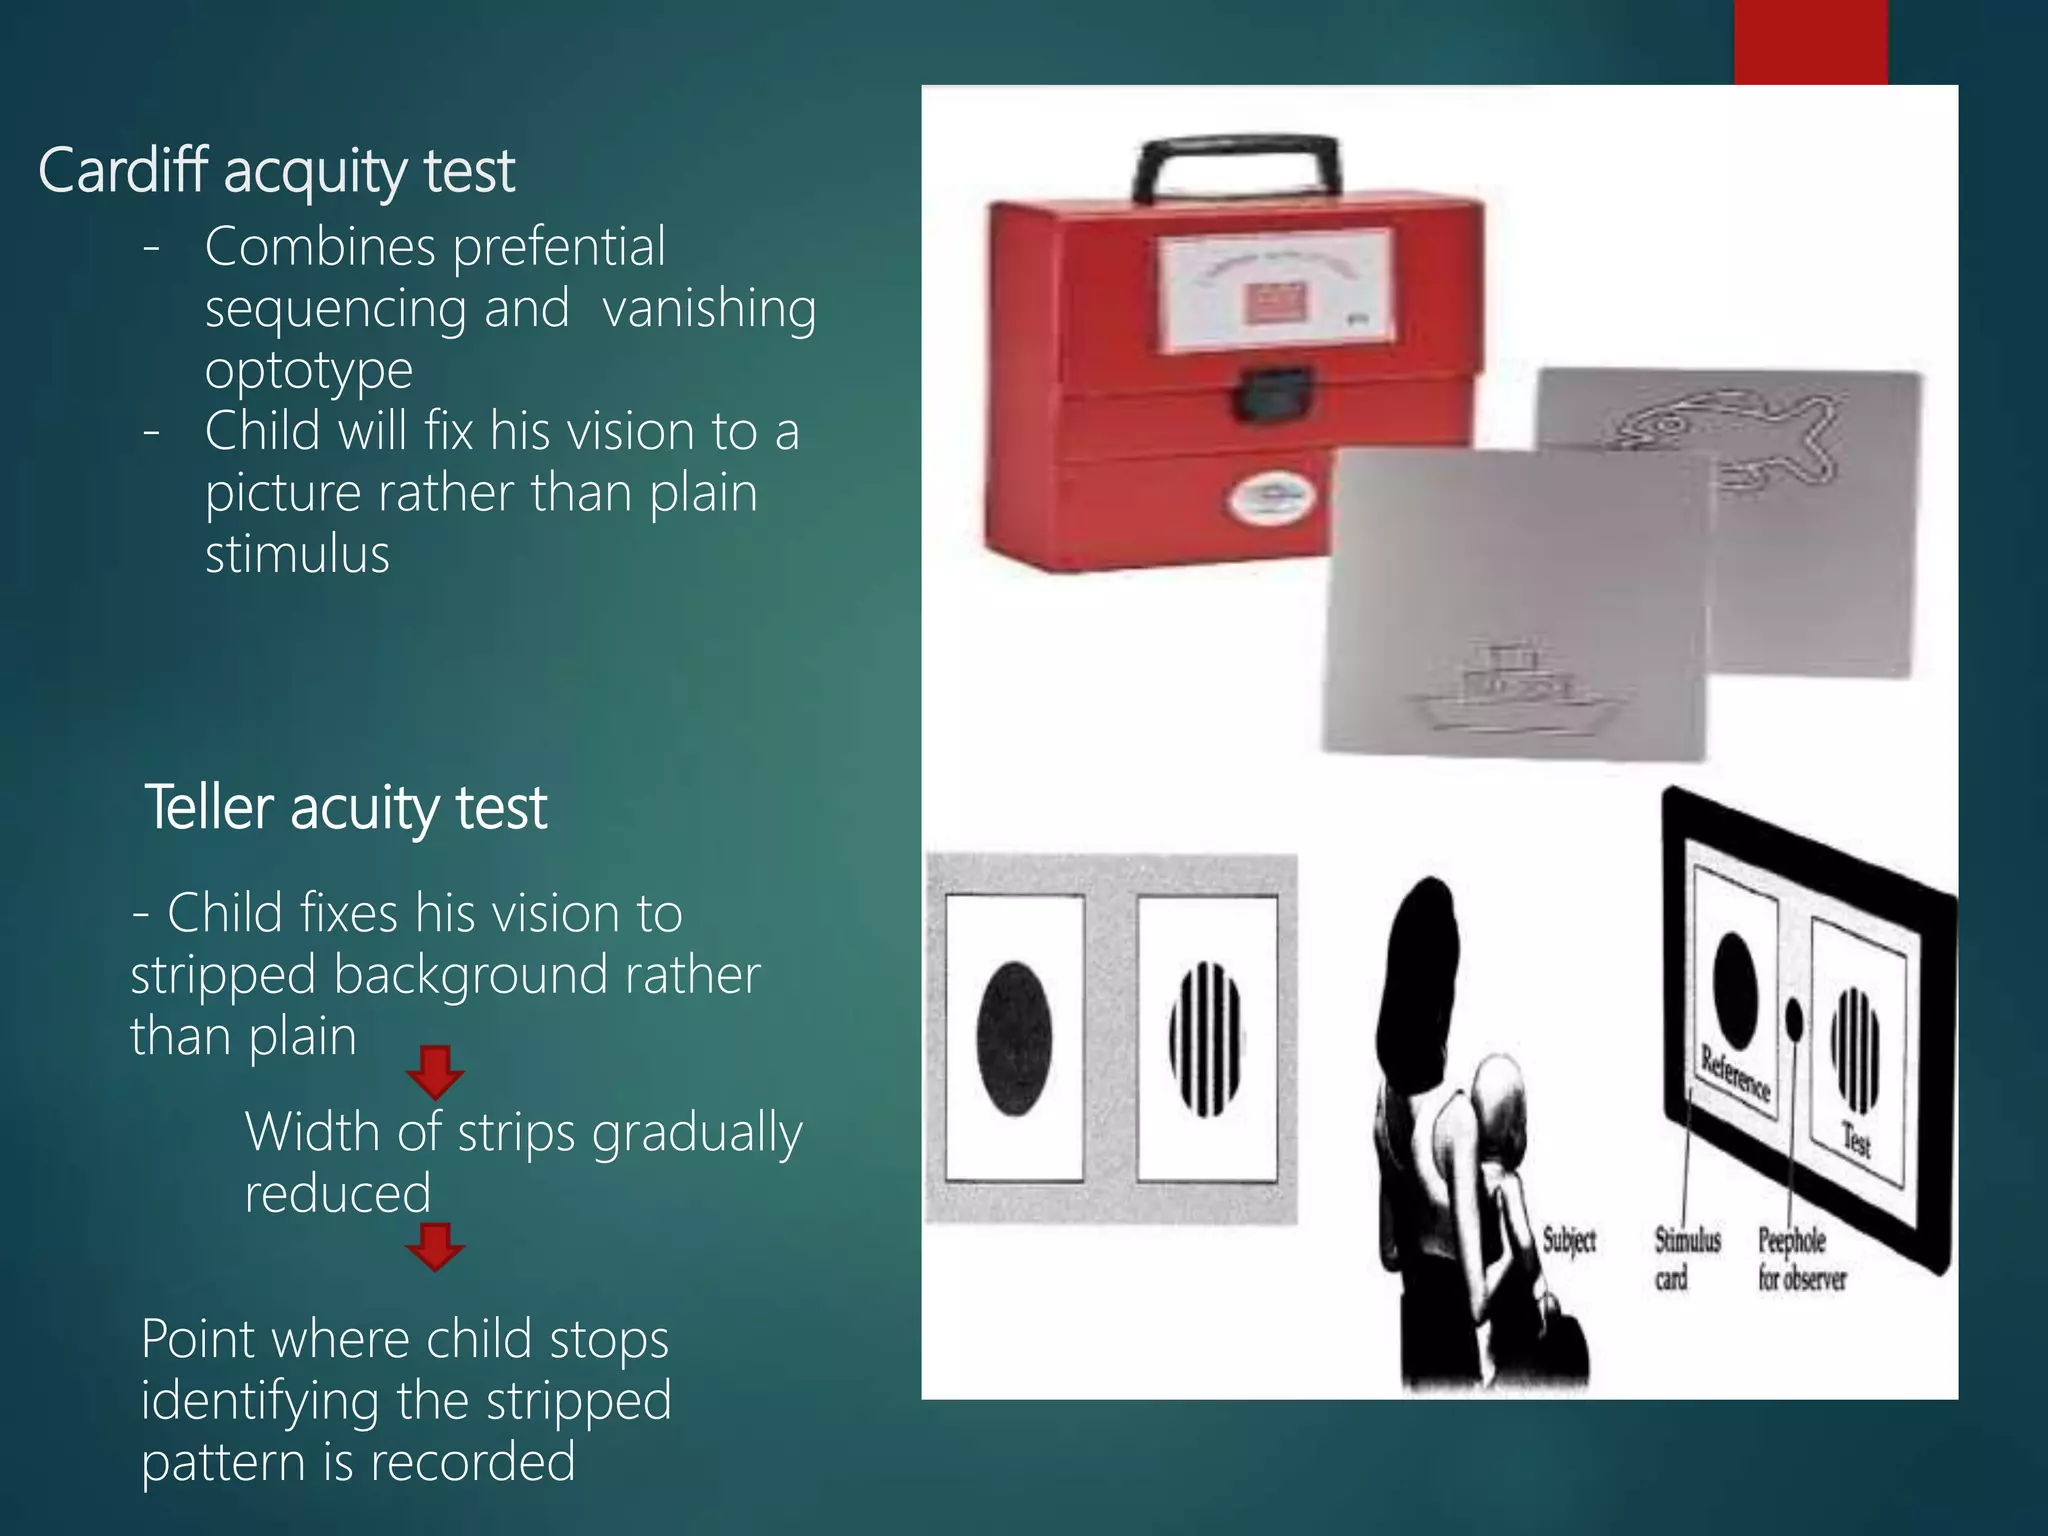
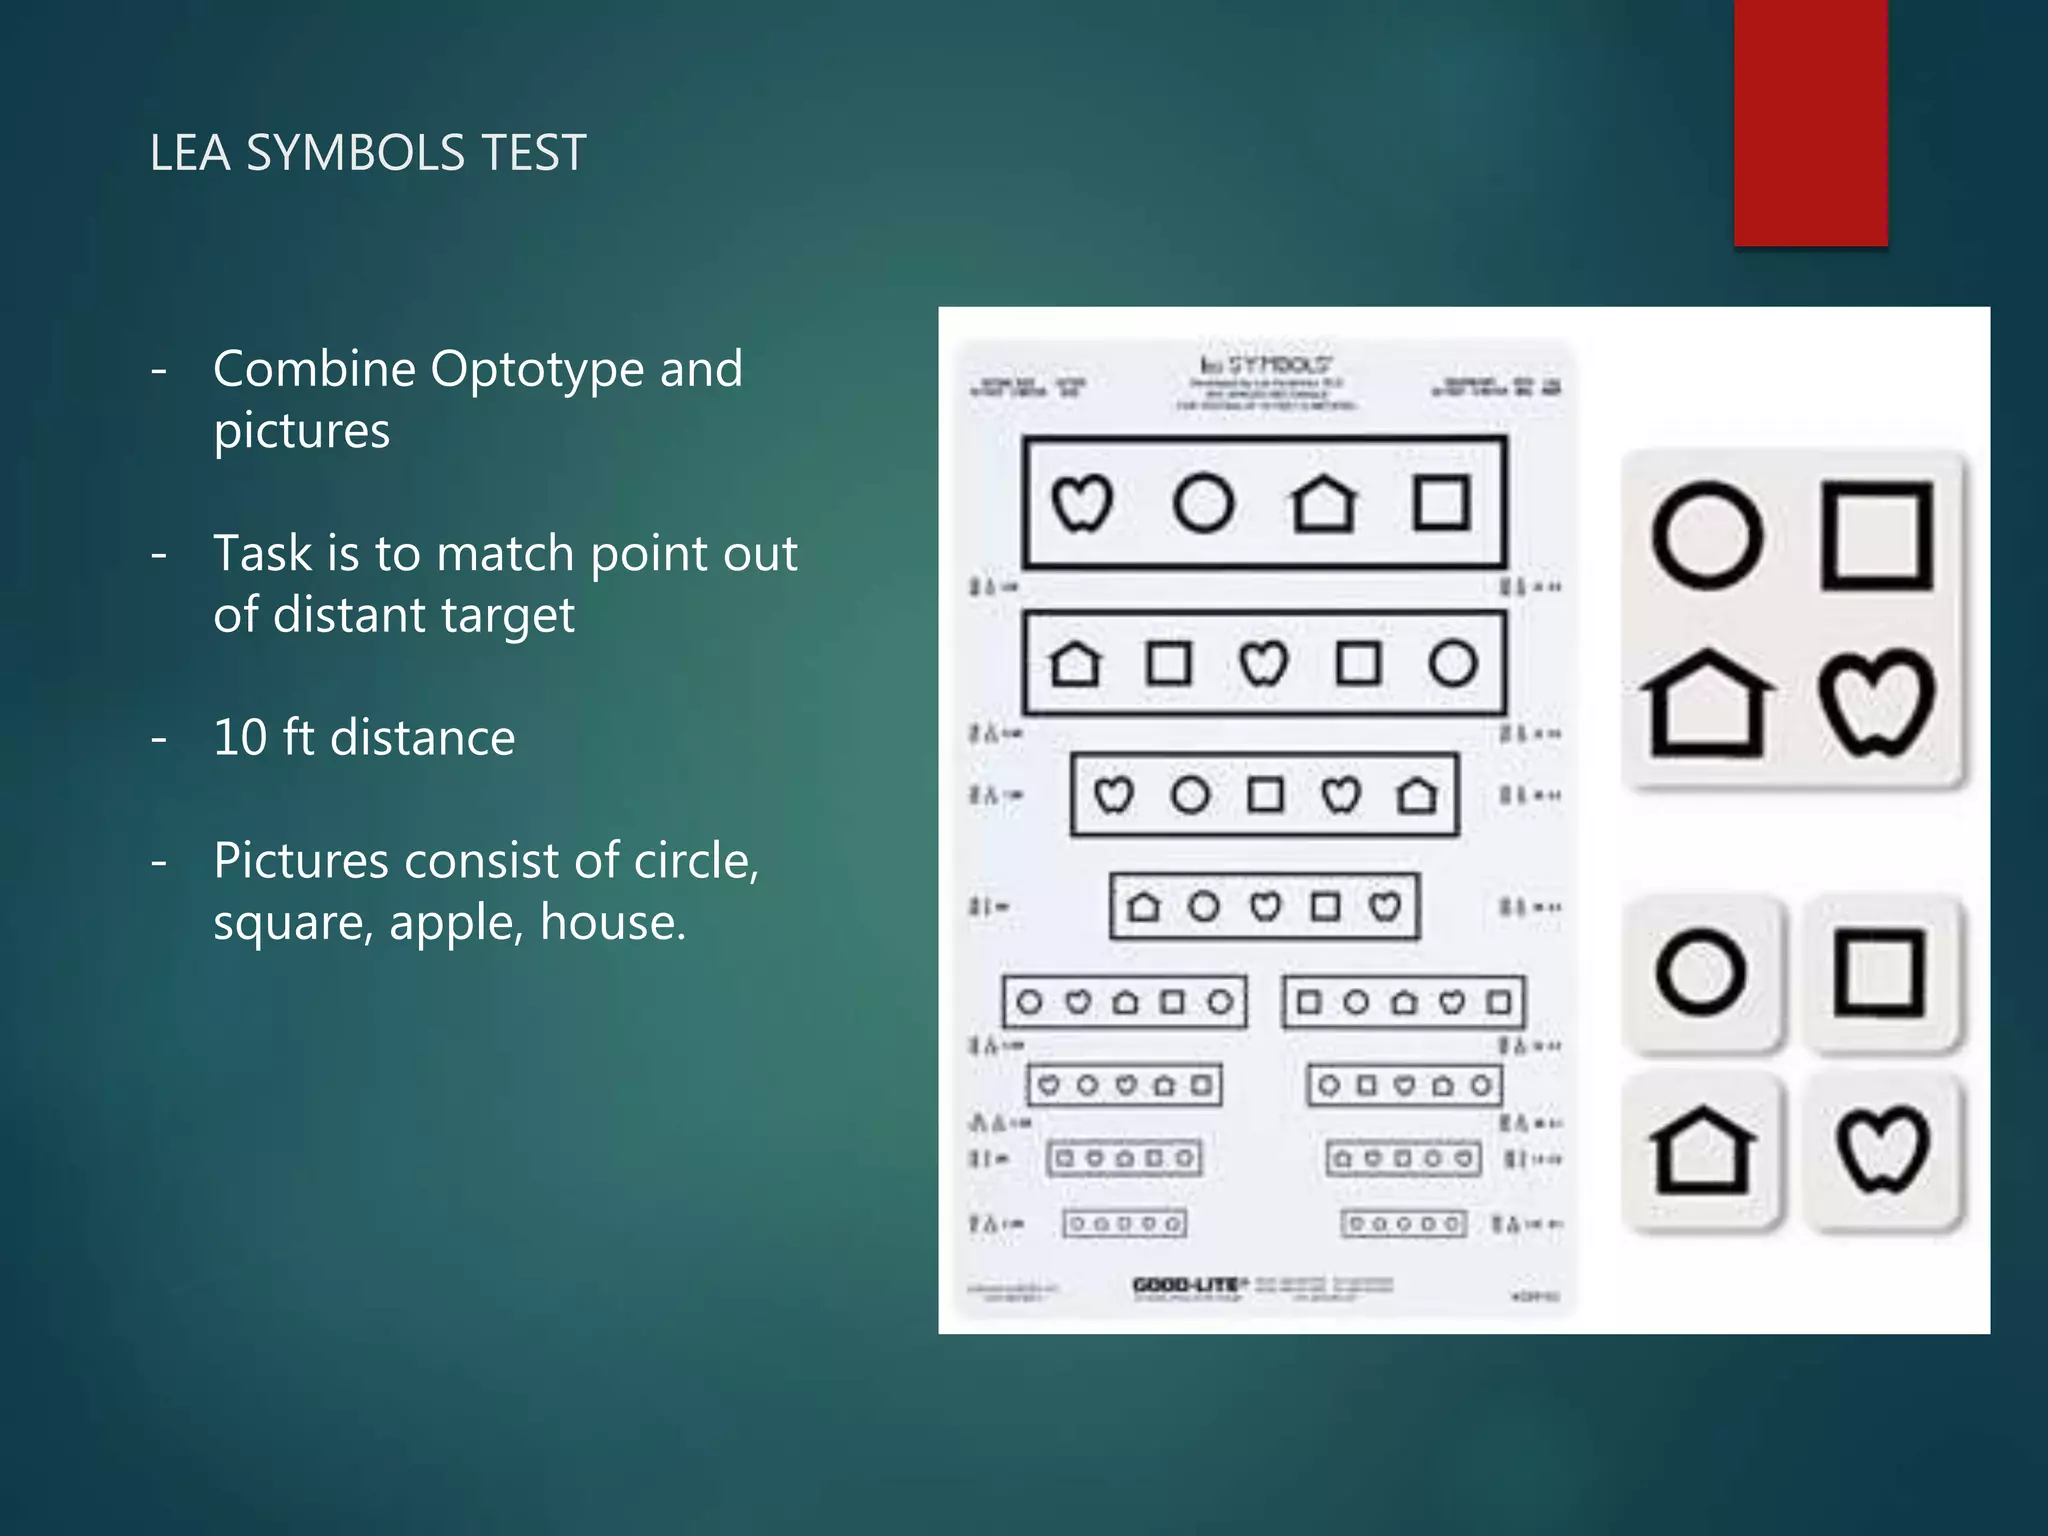
1. Visual acuity testing methods including Snellen charts, LogMAR charts, and methods for testing children.
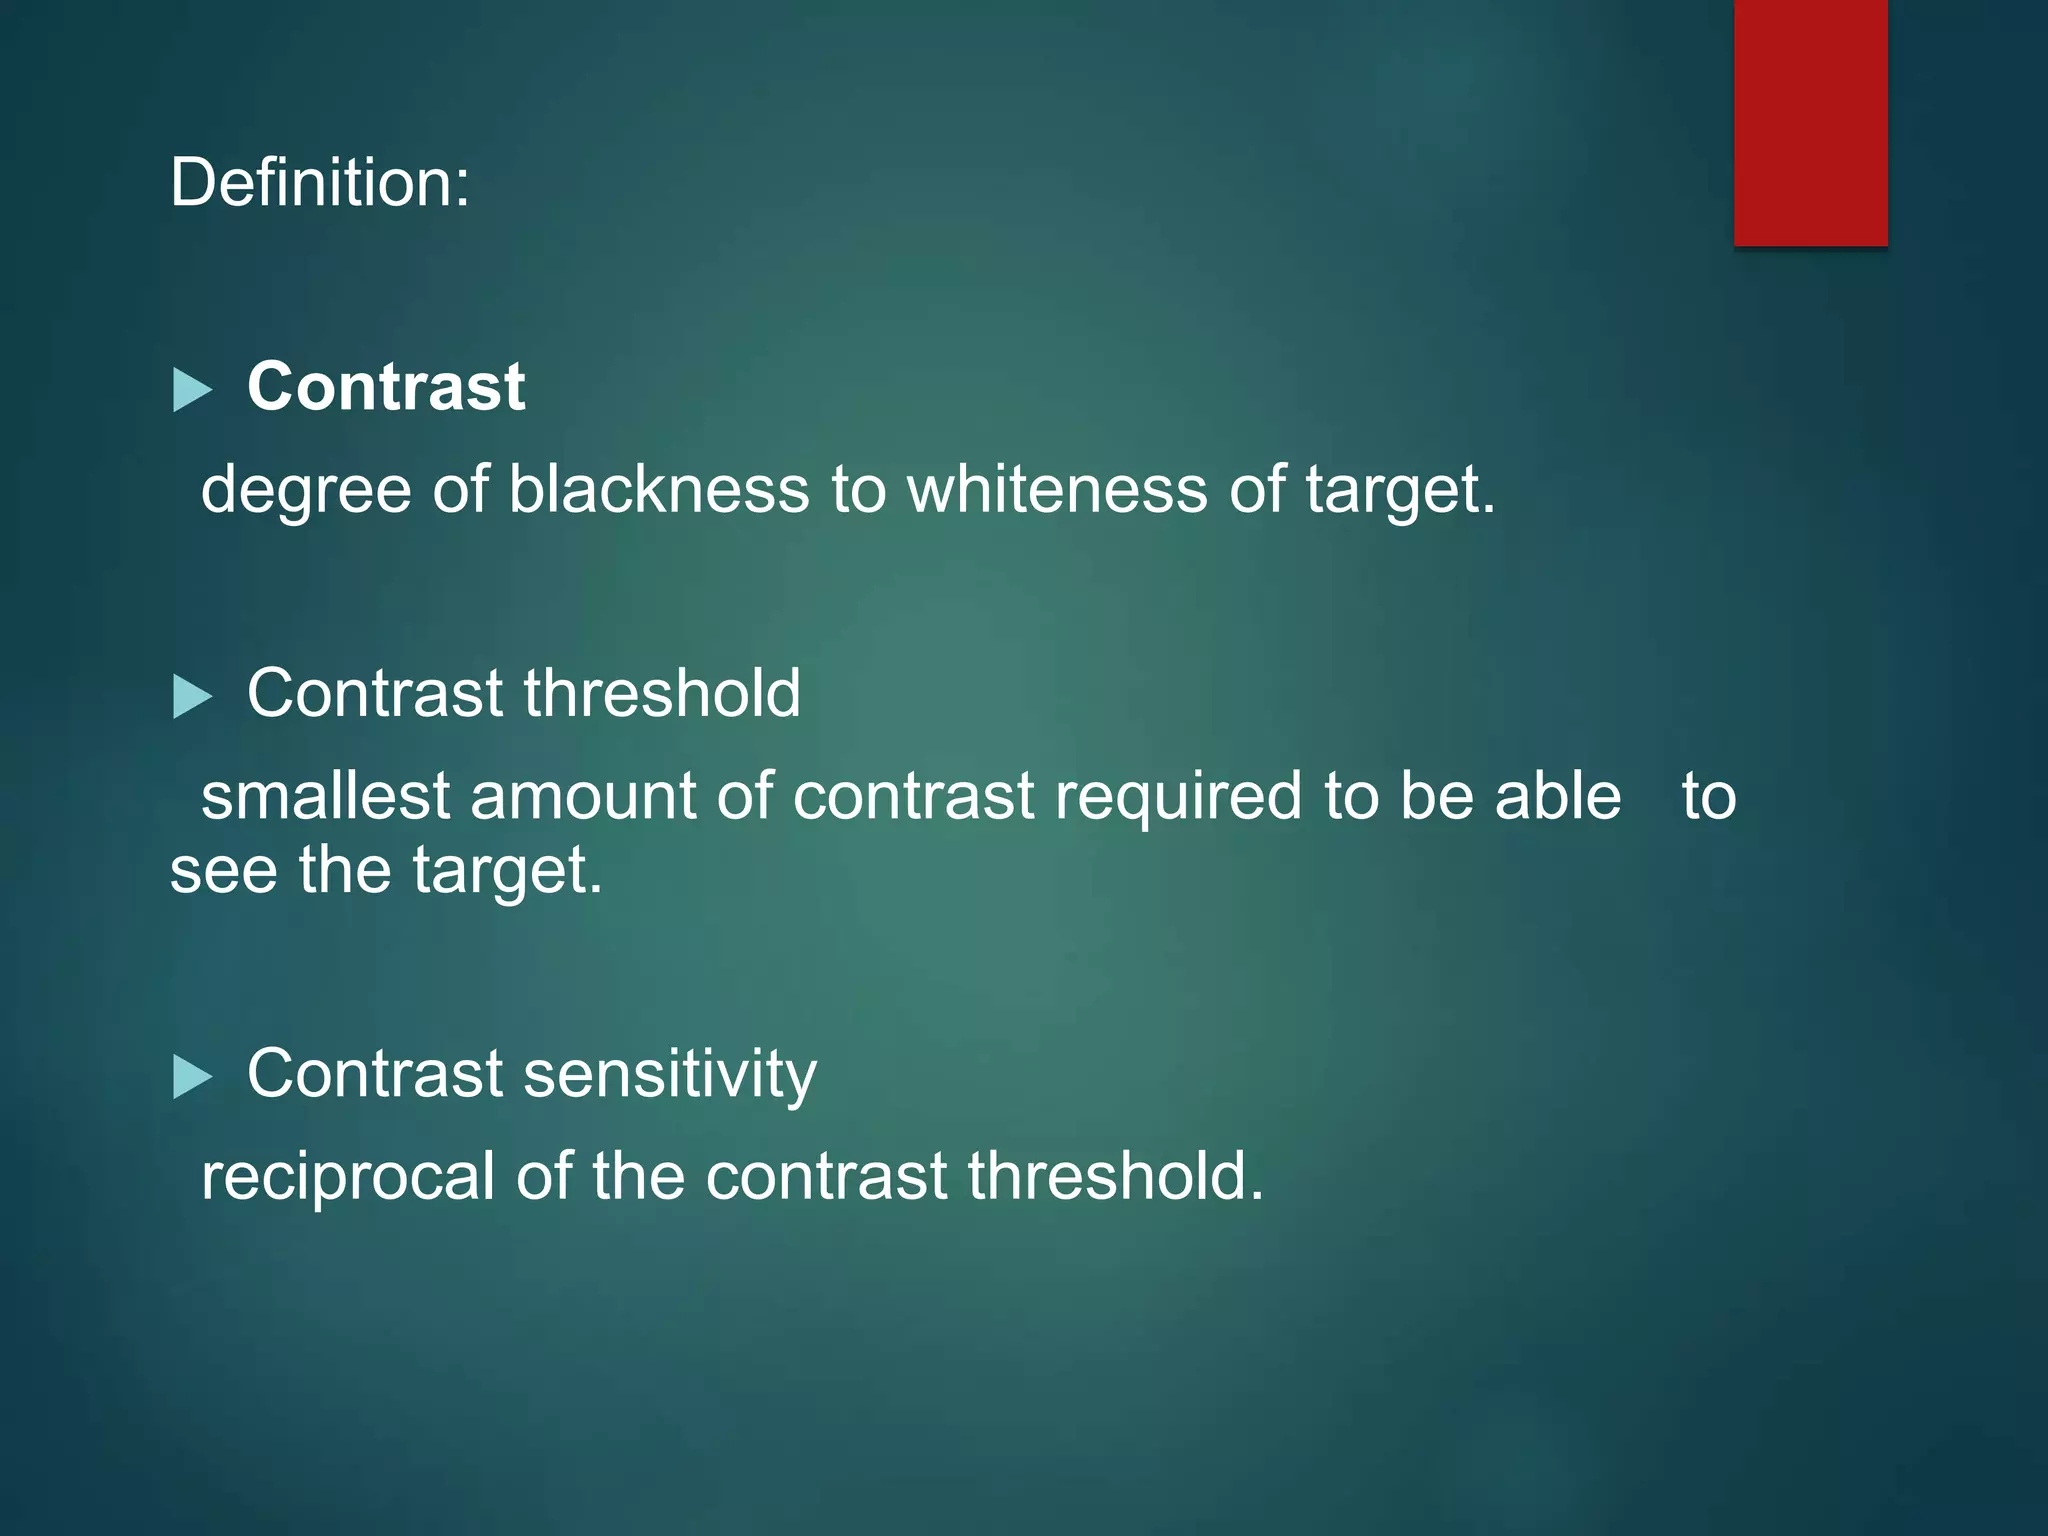
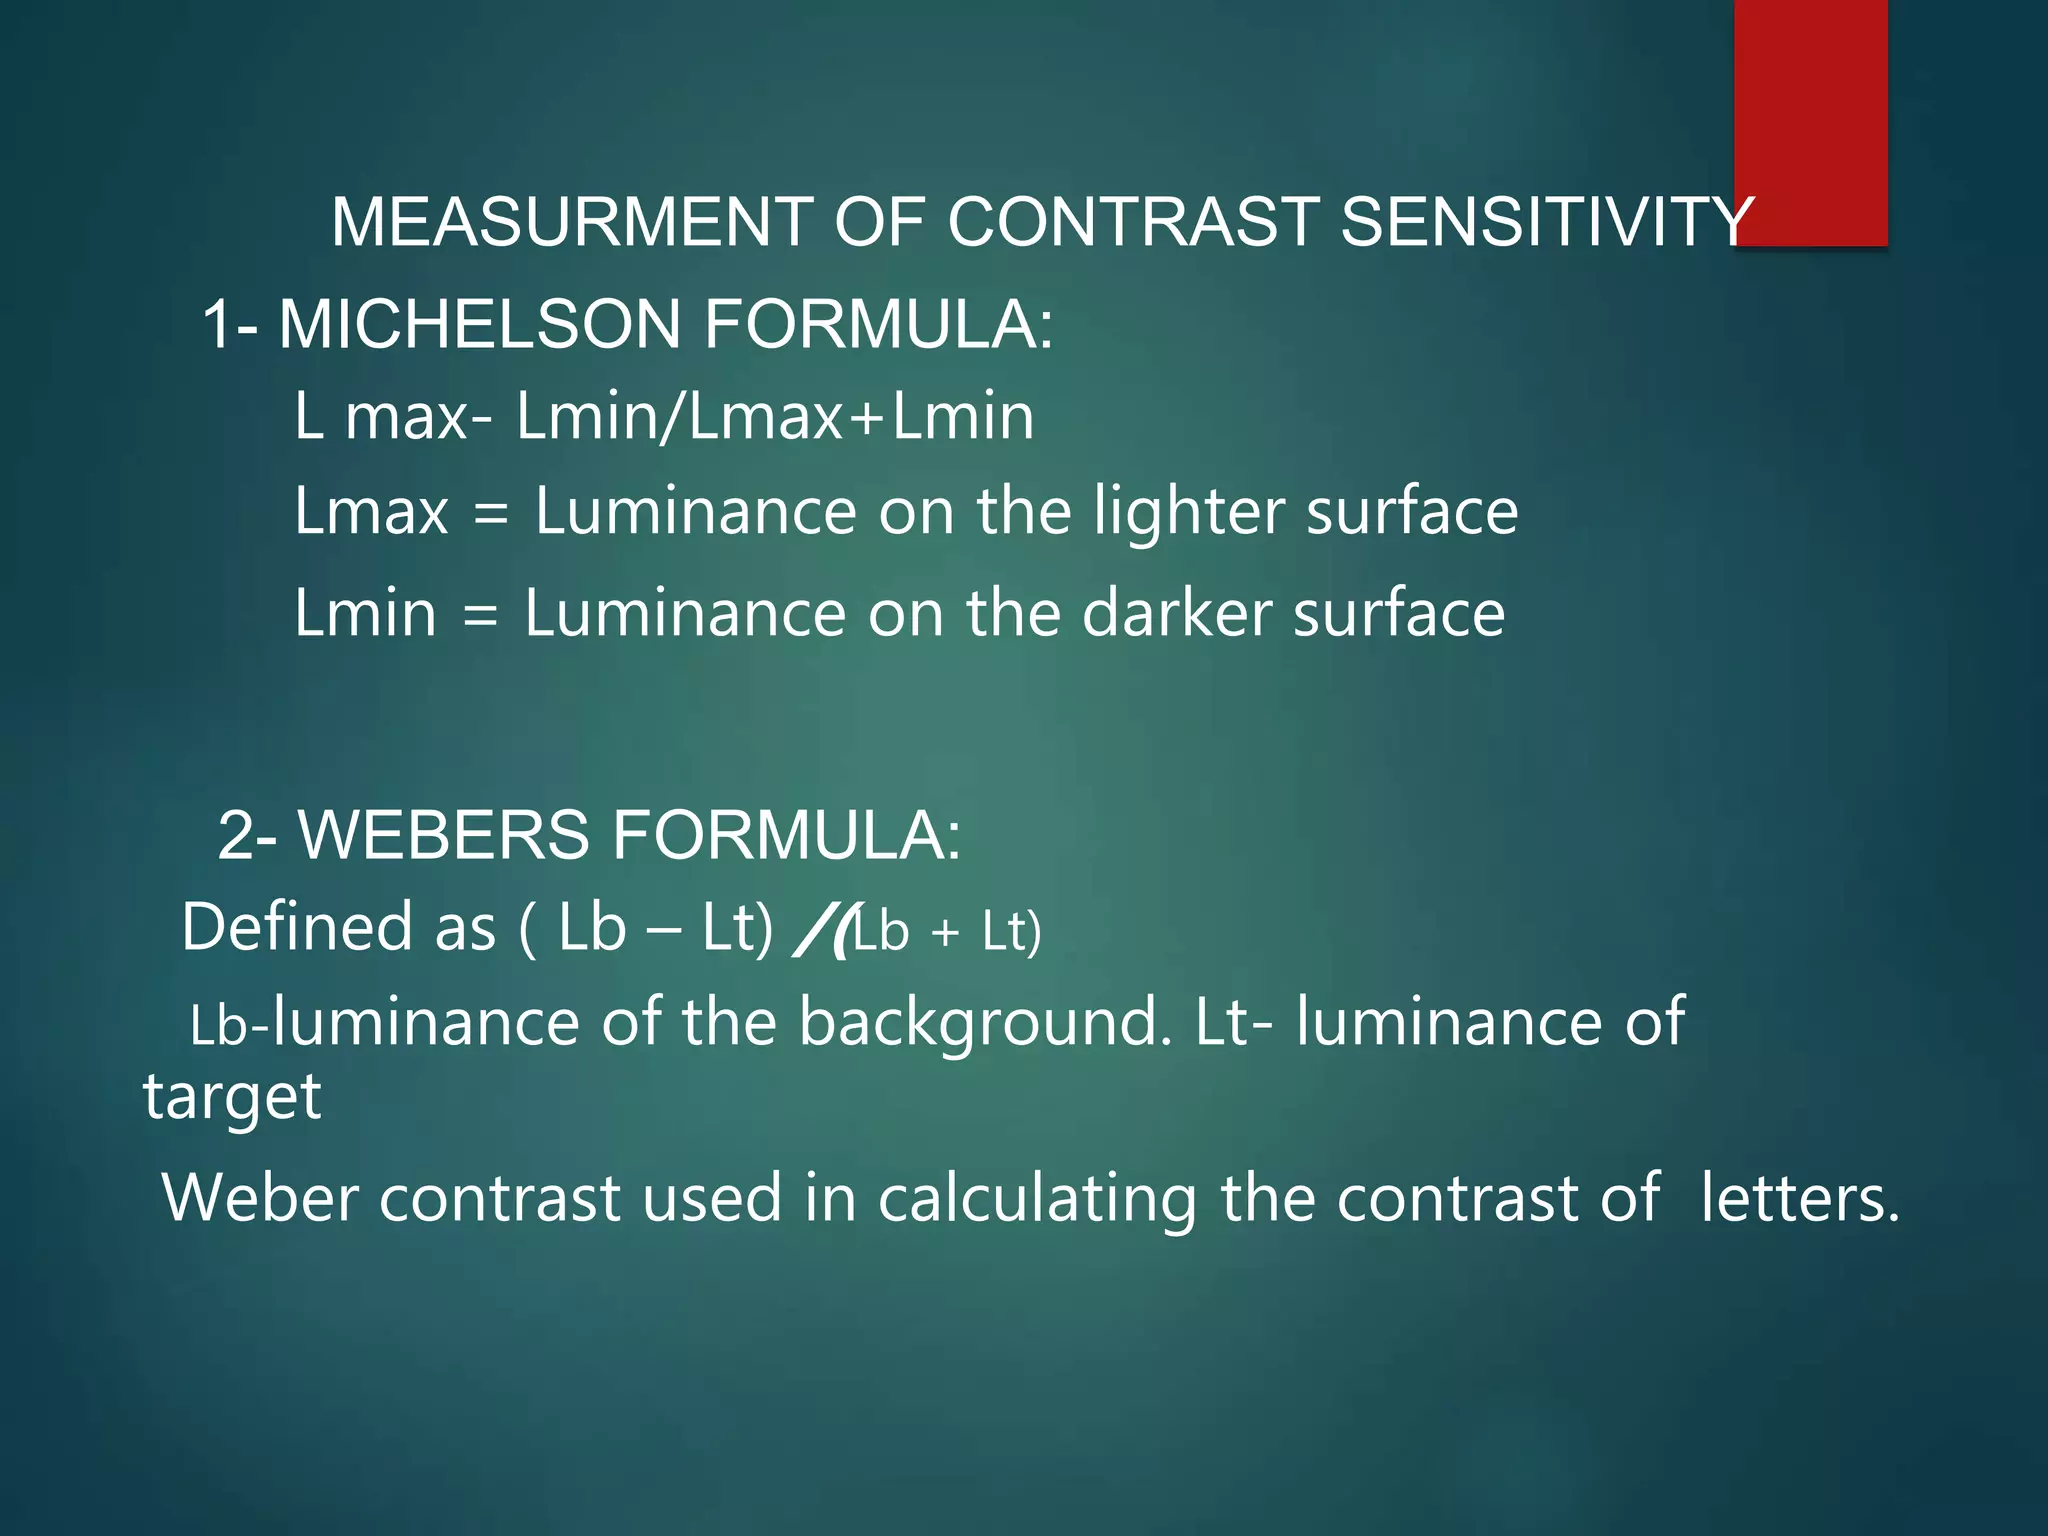
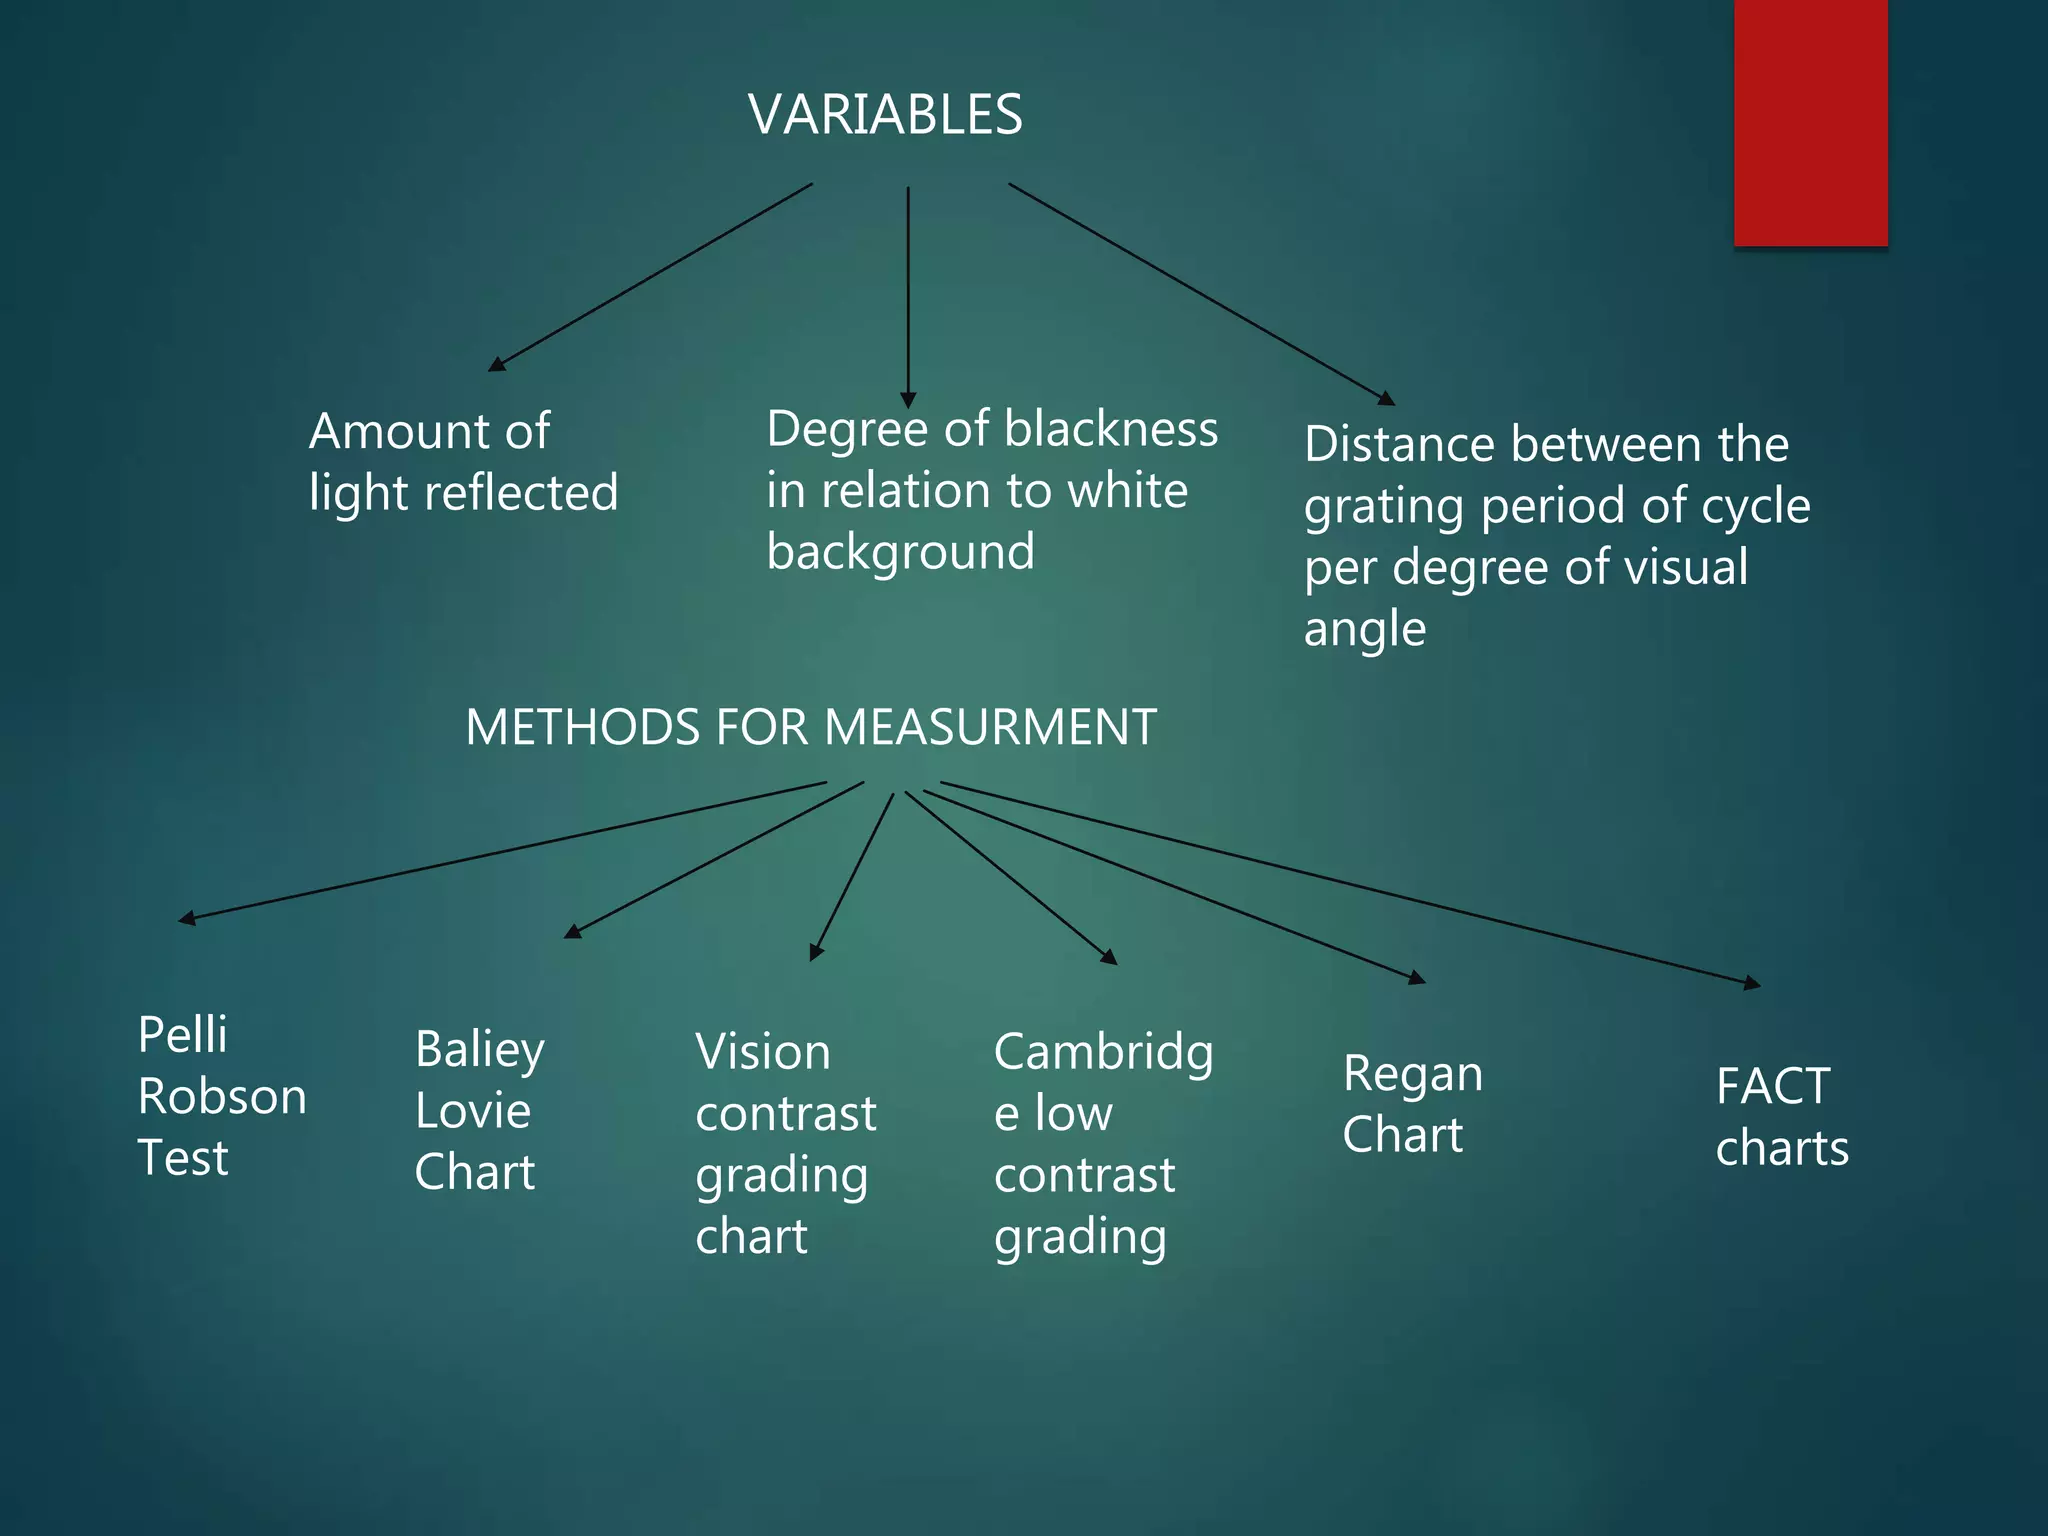
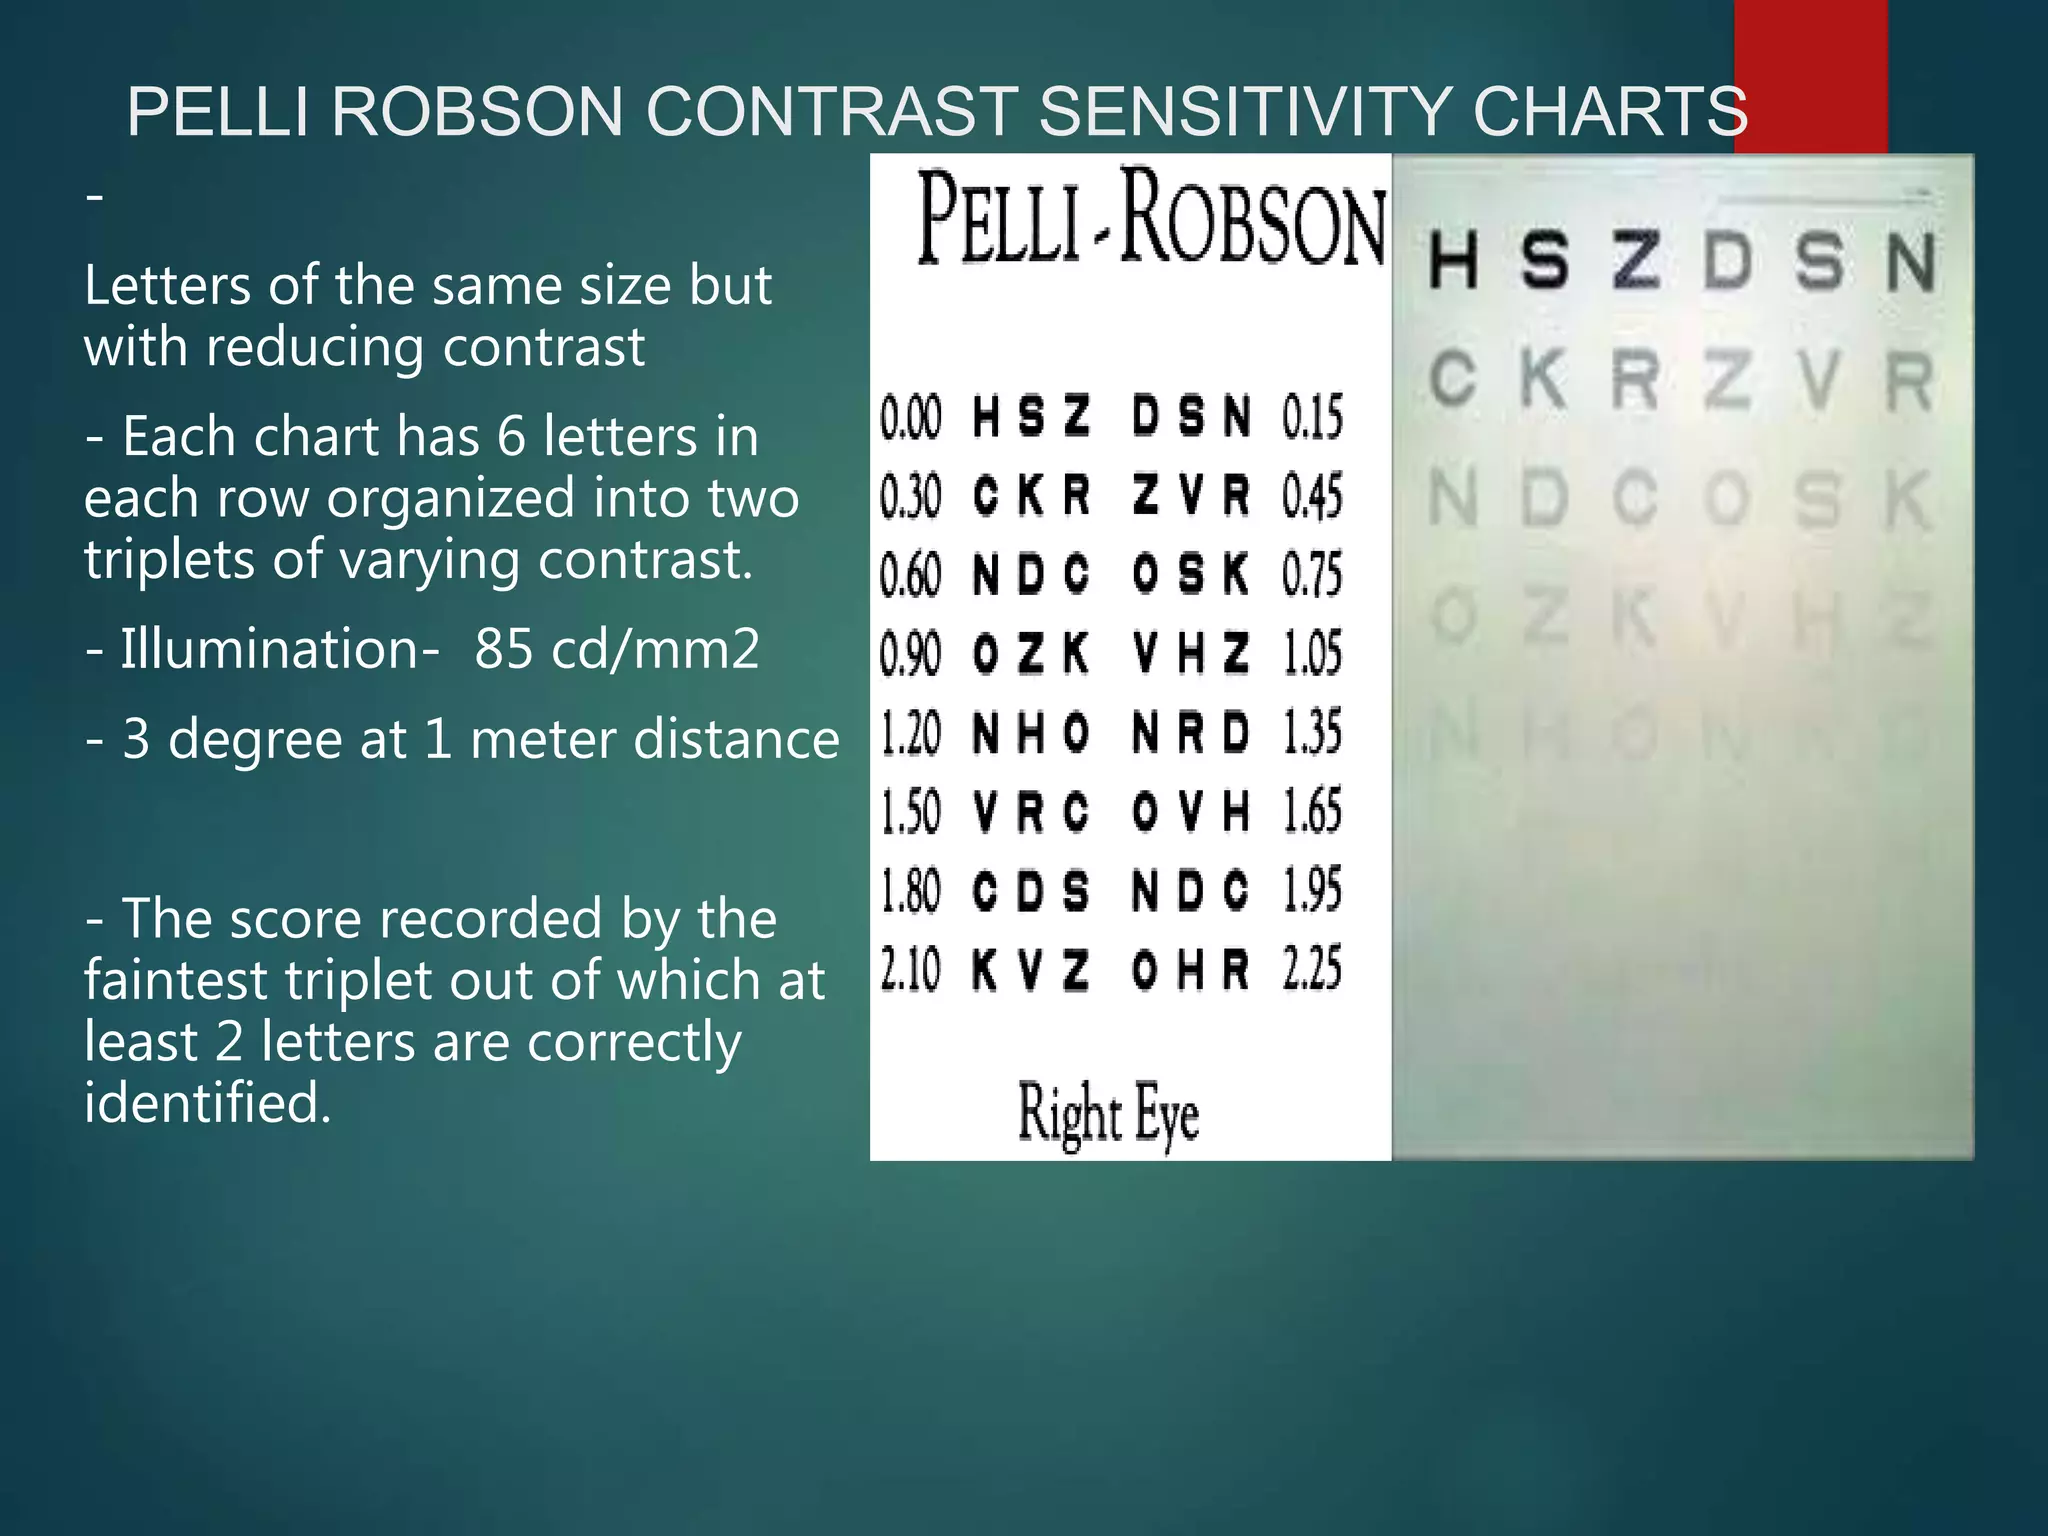
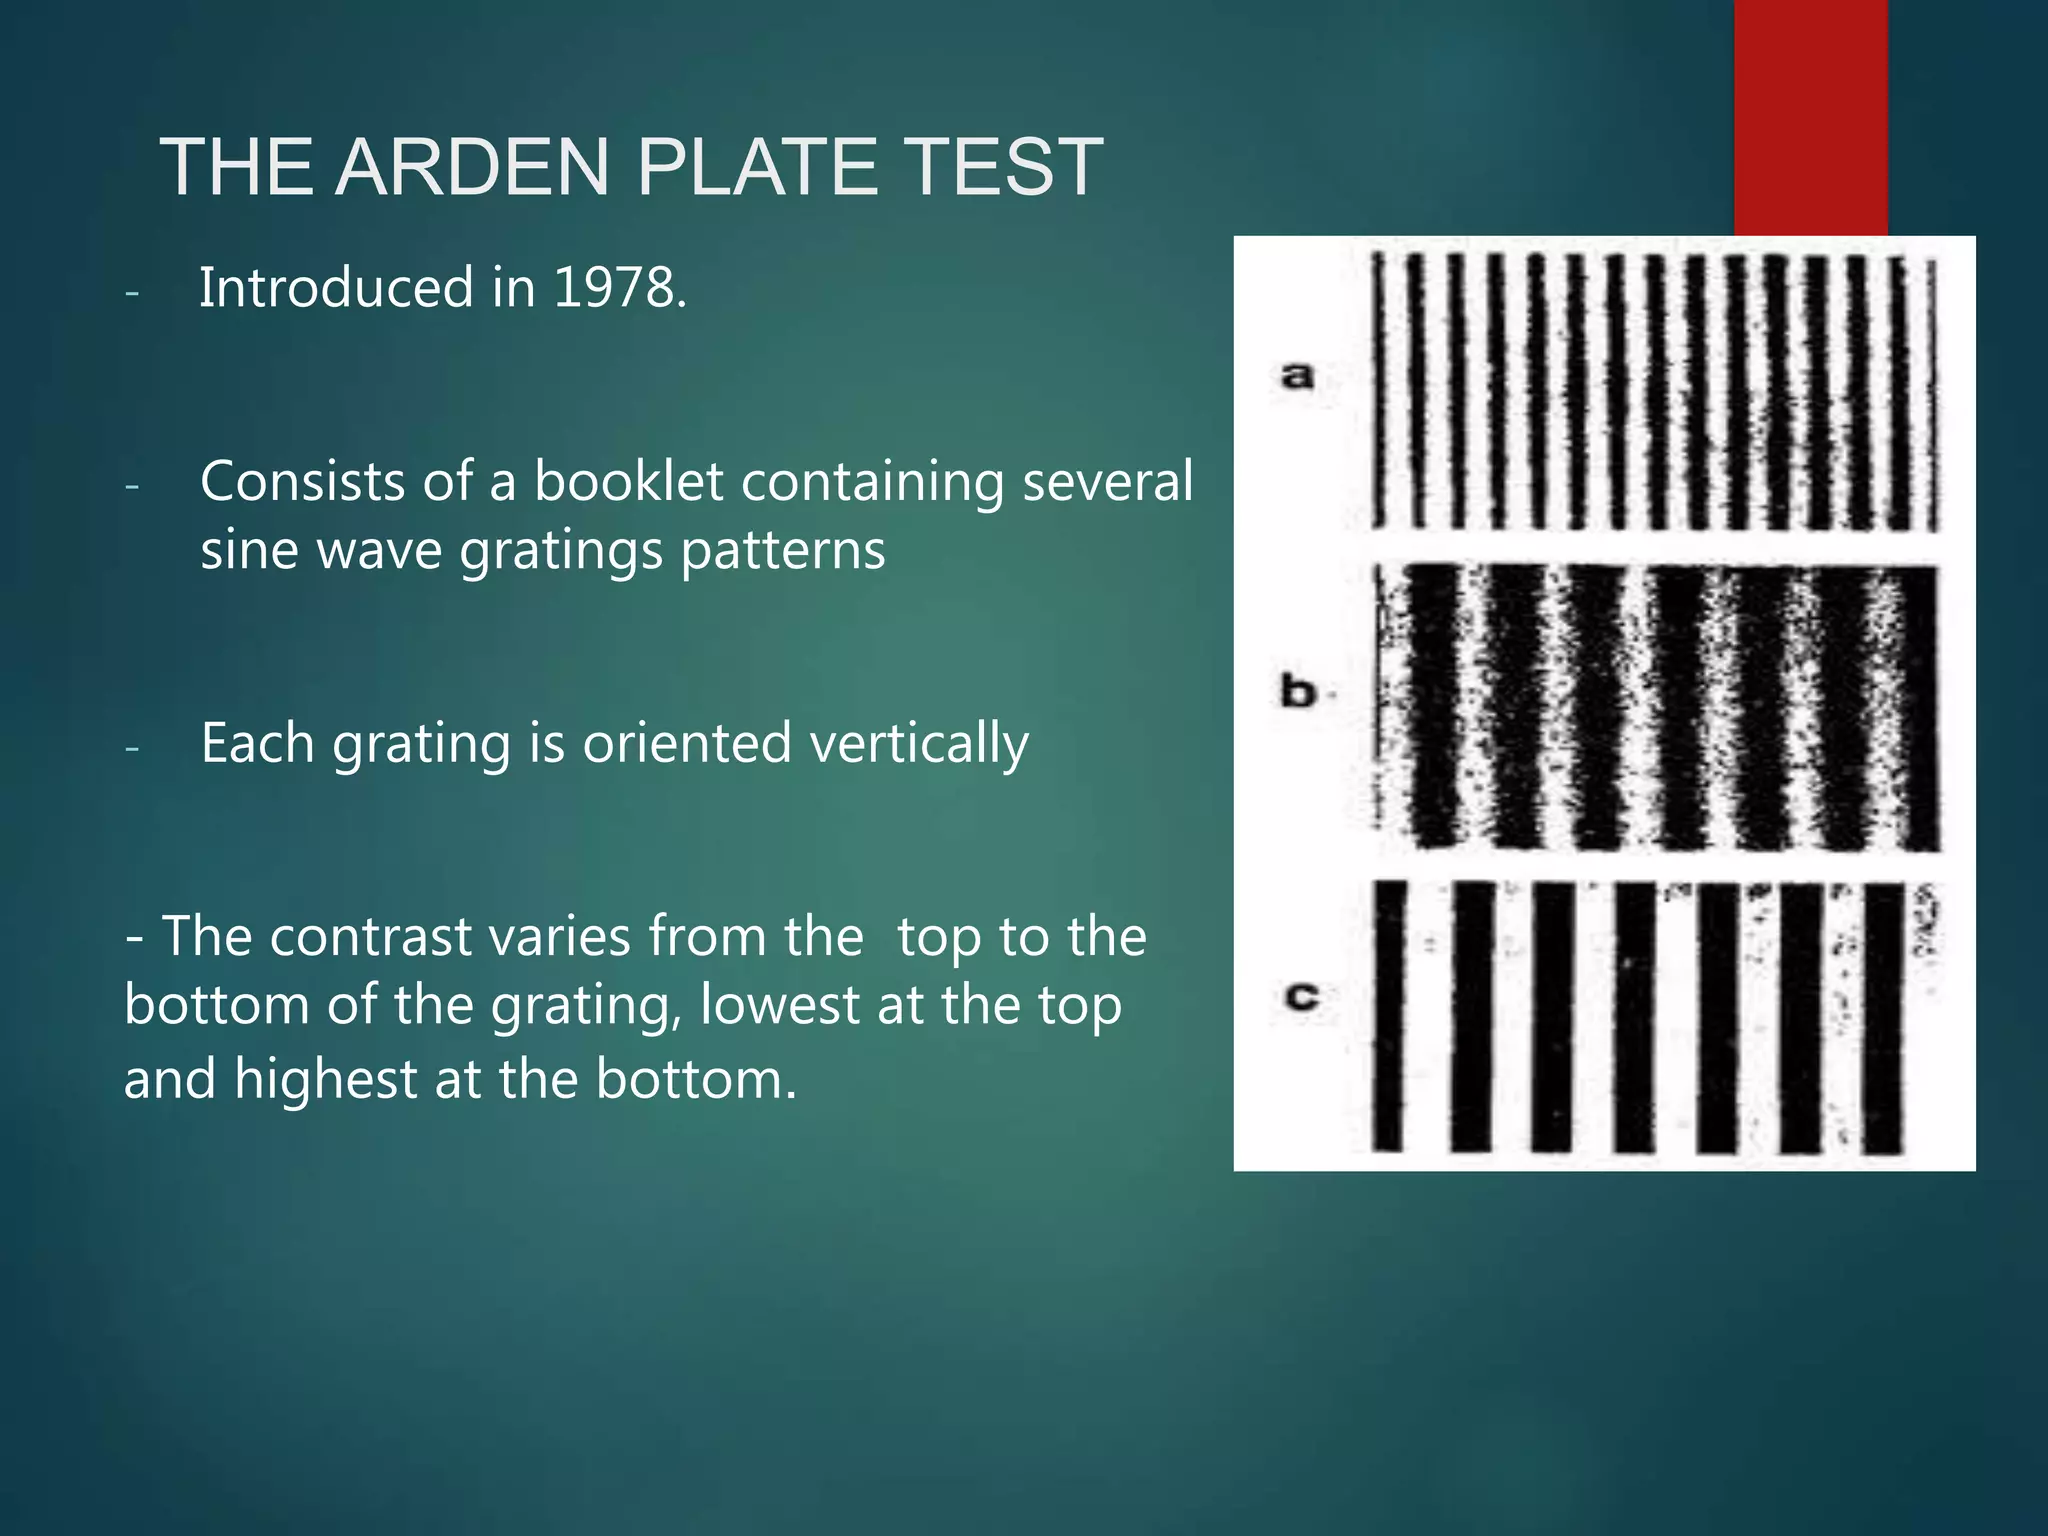
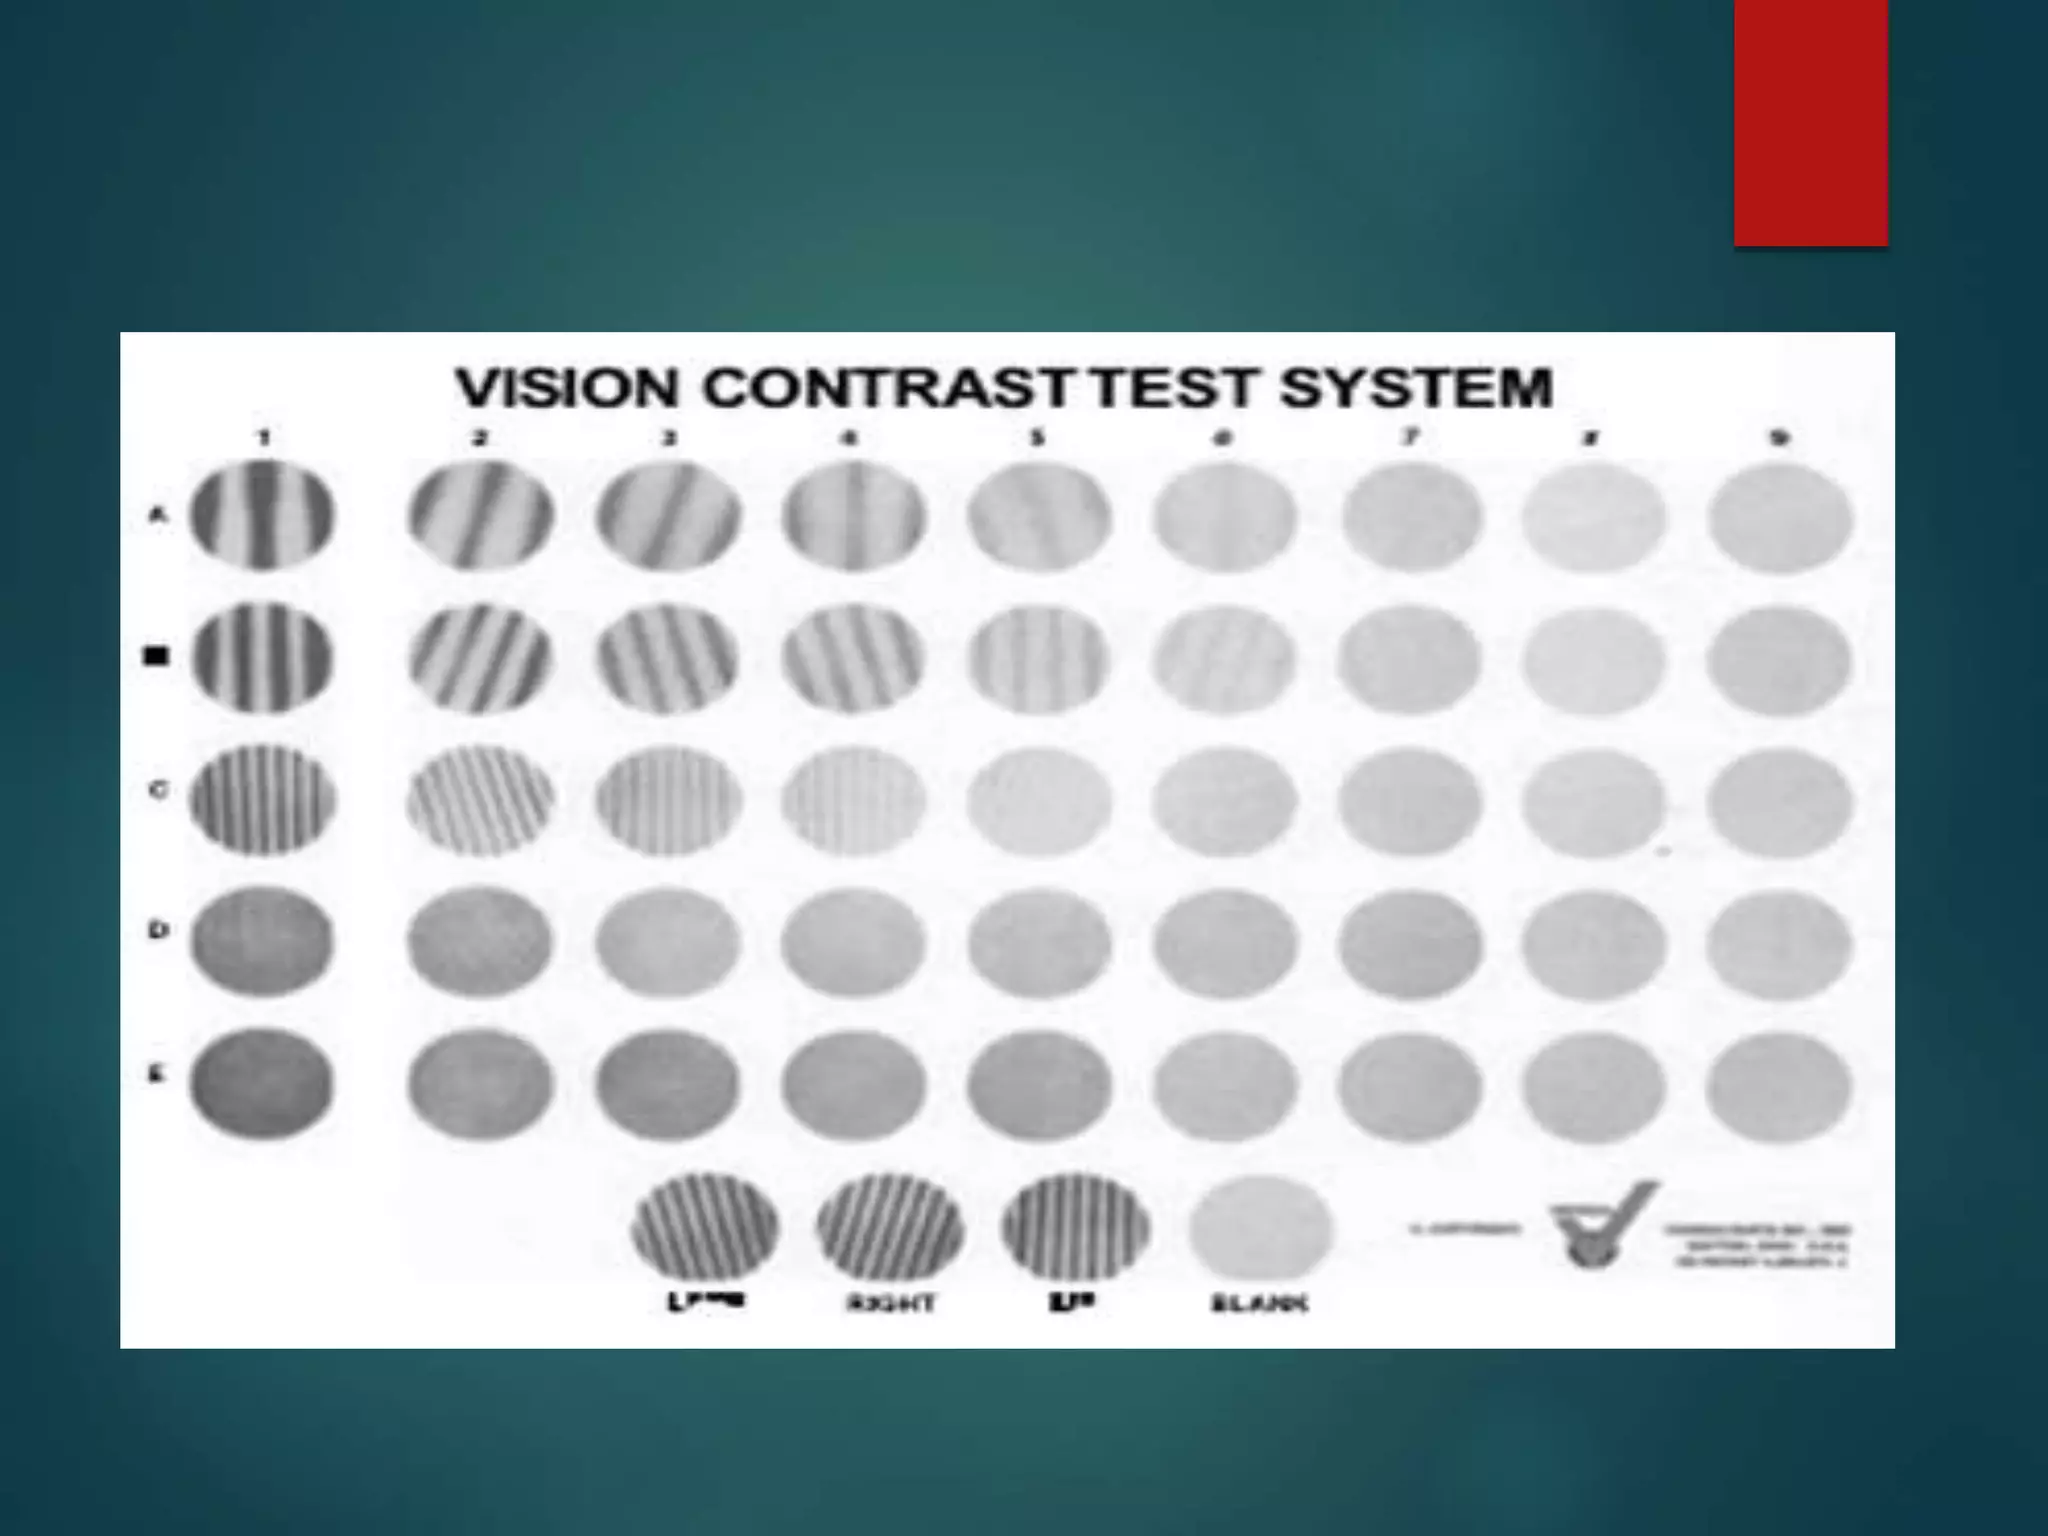
2. Contrast sensitivity testing methods including Pelli-Robson charts and Cambridge Low Contrast gradings.
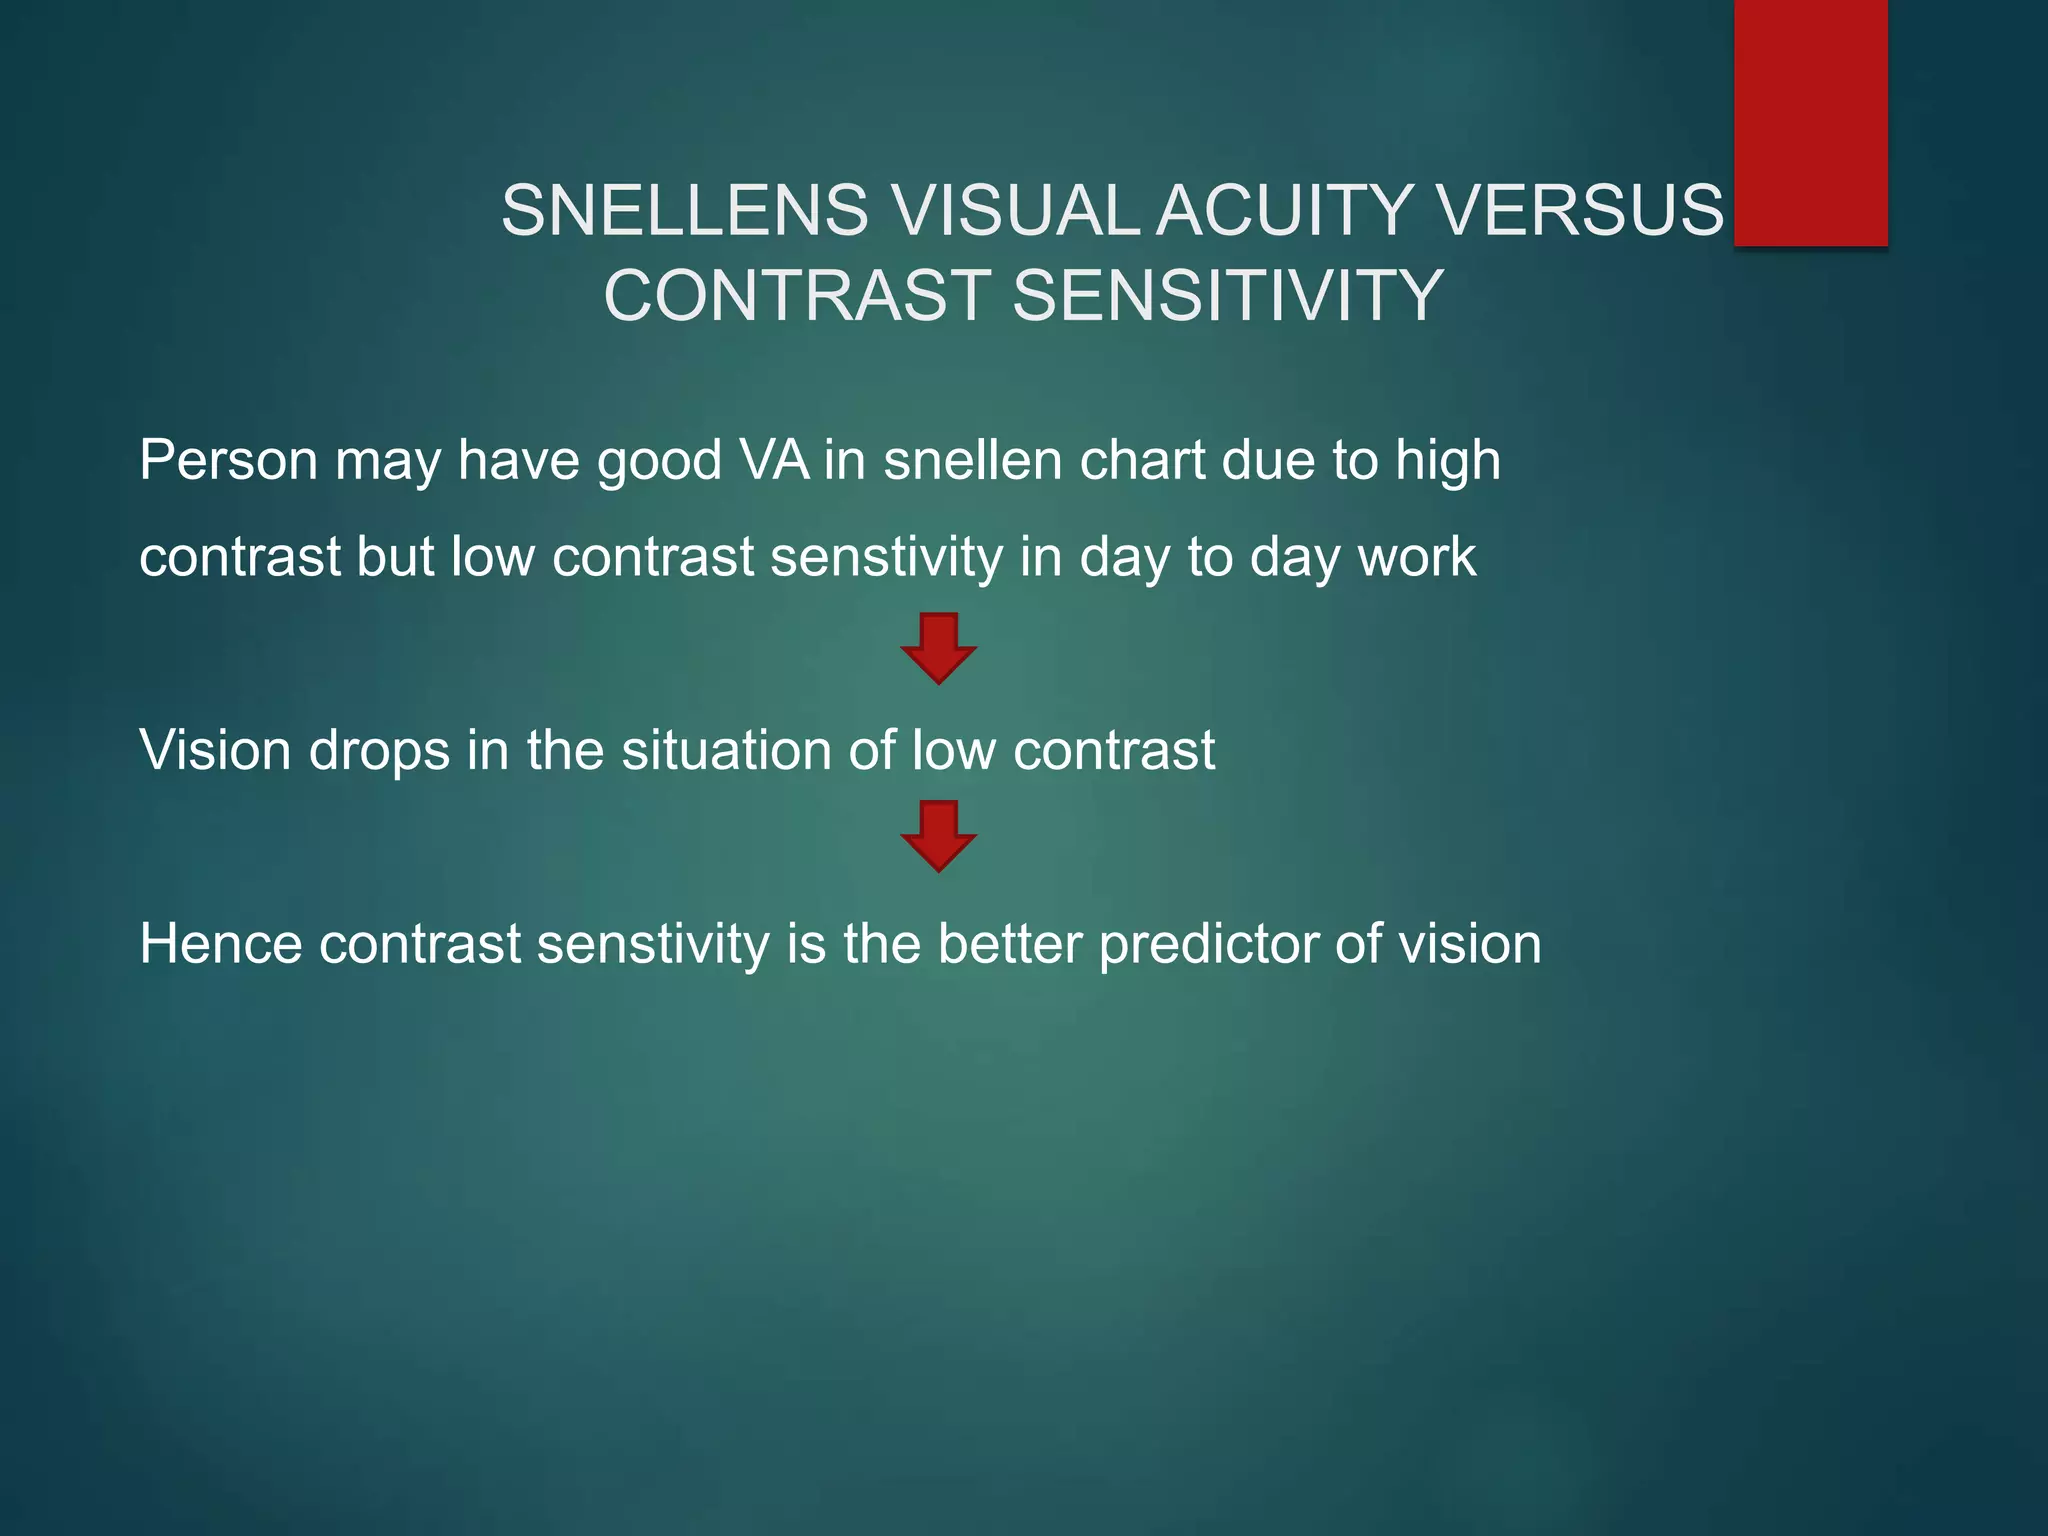
3. The importance of contrast sensitivity over visual acuity for assessing daily visual function, as visual acuity does not account for low contrast situations.