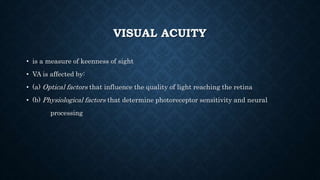
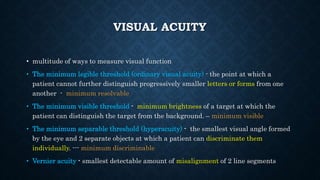
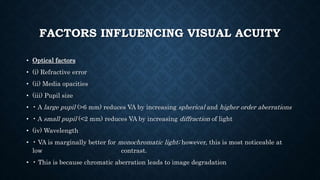
VISUAL ACUITY,
CONTRAST SENSITIVITY,
AMSLER GRID
VISUAL ACUITY
• is a measure of keenness of sight
• VA is affected by:
• (a) Optical factors that influence the quality of light reaching the retina
• (b) Physiological factors that determine photoreceptor sensitivity and neural
processing
VISUAL ACUITY
• multitude of ways to measure visual function
• The minimum legible threshold (ordinary visual acuity) - the point at which a
patient cannot further distinguish progressively smaller letters or forms from one
another - minimum resolvable
• The minimum visible threshold - minimum brightness of a target at which the
patient can distinguish the target from the background. – minimum visible
• The minimum separable threshold (hyperacuity) - the smallest visual angle formed
by the eye and 2 separate objects at which a patient can discriminate them
individually. --- minimum discriminable
• Vernier acuity - smallest detectable amount of misalignment of 2 line segments
FACTORS INFLUENCING VISUAL ACUITY
• Optical factors
• (i) Refractive error
• (ii) Media opacities
• (iii) Pupil size
• • A large pupil (>6 mm) reduces VA by increasing spherical and higher order aberrations
• • A small pupil (<2 mm) reduces VA by increasing diffraction of light
• (iv) Wavelength
• • VA is marginally better for monochromatic light; however, this is most noticeable at
low contrast.
• • This is because chromatic aberration leads to image degradation
• Physiologic factors
• (i) Foveal cone density
• • The density of foveal cone packing is a critical determinant of fine visual resolution .
• • Human foveal cones are separated by approximately 30 s of arc; hence, MAR is 1 min
• (ii) Cone to ganglion cell convergence
• • The fovea is characterized by 1:1:1 cone-bipolar-ganglion cell convergence
• (iii) Retinal illumination
• • At low ( scotopic ) luminance levels mediated by rods, VA is reduced; however, it
increases with increasing retinal illumination.
• • Under moderate photopic luminance conditions, VA remains fairly constant
CLINICAL MEASUREMENT OF VISUAL
ACUITY
• 1. Snellen chart
• 2. Bailey-Lovie and Early Treatment of Diabetic Retinopathy Study (ETDRS) charts
• 3. Snellen-like tests
• Illiterate E
• Landolt C tests
• 4. Other forms of VA testing (useful in young children)
• Visual evoked reflex
• Optokinetic nystagmus
• Preferential looking
SNELLEN VISUAL ACUITY
• letters constructed such that each letter as a whole subtends an angle of 5 minutes
of arc
• each stroke of the letter subtends 1 arcmin
• Letters of different sizes are designated by the distance at which the letter subtends
an angle of 5 arcmin
• Though widely accepted, the standard Snellen chart is not perfect
• The letters on different Snellen lines are not related by size in any geometric or
logarithmic sense
• For example, the increase in letter size from the 6/6 line to the 6/9 line differs from
the increase from the 6/9 line to the 6/12 line
• In addition, certain letters (such as C, D, O, and G) are inherently harder to
recognize than others (such as A and J)
ETDRS CHART
• each line has the same number of letters, so
crowding is standardized
• decrements in size are uniform: each line is
diminished in size by a factor of 0.1
CONTRAST SENSITIVITY
• Contrast is a measure of the lightness or darkness of an object compared to its
background.
RELEVANCE OF CONTRAST SENSITIVITY TO
DAILY FUNCTION
• • The object size influences how much contrast is needed to differentiate it from its
background
• Patients with normal visual acuity (VA) may complain of poor vision if CS is reduced
• Snellen visual acuity is approximate 100% contrast
• we are measuring, at approximately 100% contrast, the smallest optotype that the
visual system can resolve
• CS is determined by the:
• (a) Stimulus contrast: luminance of the stimulus compared with the background
• (b) Stimulus size: spatial extent of the stimulus against the background
CS MEASUREMENT
• Sunisoidal gratings
SPATIAL FREQUENCY
• Densely packed lines have high spatial frequency; sparsely packed have low spatial
frequency.
• • Spatial frequency is related to visual acuity
• For example, for a spatial frequency of 30 c/deg, there are 30 alternating black and
white stripes per degree (60 min), and each stripe subtends 1 min of arc.
• • Hence, 30 c/deg is equivalent to Snellen 6/6
FACTORS THAT INFLUENCE CONTRAST
SENSITIVITY
• Scotopic vs photopic conditions
• • CS is reduced for scotopic compared to photopic conditions
• • Peak photopic CS occurs at spatial frequency 5 c/deg (6/36); peak scotopic CS
occurs at 1 c/deg
• Retinal eccentricity
• CS is maximal using foveal vision.
• • It reduces with increasing retinal eccentricity
• Mean luminance
• • CS decreases with decreasing mean luminance
CLINICAL TESTING OF CONTRAST
SENSITIVITY
• Pelli-Robson chart - - Varying contrast at a fixed spatial frequency corresponding to
peak CS (5c/min)(6/36)
• Functional Acuity Contrast Test - - Varying contrast and several different
frequencies
AMSLER GRID
• The Amsler grid evaluates the 20° of the visual field centred on fixation
• useful in screening for and monitoring macular disease
• also demonstrate central visual field defects
• Patients with a risk of CNV be provided an Amsler grid for regular use at home
CHARTS
• Chart 1 consists of a white grid on a black background,
enclosing 400 smaller 5 mm squares. When
viewed at about one-third of a metre, each small square
subtends an angle of 1°
• Chart 2 is similar to chart 1 but has diagonal lines that aid
fixation for patients with a central scotoma
• Chart 3 is identical to chart 1 but has red squares
The red-on-black design aims to stimulate long
Wavelength foveal cones
It is used to detect subtle colour scotomas and
desaturation in toxic maculopathy, optic neuropathy
And chiasmal lesions
• Chart 4 consists only of random dots and is
used mainly to distinguish scotomas from
metamorphopsia, as there is no form to be
distorted
• Chart 5 consists of horizontal lines and is
designed to detect metamorphopsia along
specific meridians
• It is of particular use in the evaluation of
patients describing difficulty reading
• Chart 6 is similar to chart 5 but has a white
background and the central lines are closer
together, enabling more detailed evaluation
• Chart 7 includes a fine central grid, each square
subtending an angle of a half degree,
and is more sensitive

Visual acuity and contrast sensitivity

  • 1.
  • 2.
    VISUAL ACUITY • isa measure of keenness of sight • VA is affected by: • (a) Optical factors that influence the quality of light reaching the retina • (b) Physiological factors that determine photoreceptor sensitivity and neural processing
  • 3.
    VISUAL ACUITY • multitudeof ways to measure visual function • The minimum legible threshold (ordinary visual acuity) - the point at which a patient cannot further distinguish progressively smaller letters or forms from one another - minimum resolvable • The minimum visible threshold - minimum brightness of a target at which the patient can distinguish the target from the background. – minimum visible • The minimum separable threshold (hyperacuity) - the smallest visual angle formed by the eye and 2 separate objects at which a patient can discriminate them individually. --- minimum discriminable • Vernier acuity - smallest detectable amount of misalignment of 2 line segments
  • 6.
    FACTORS INFLUENCING VISUALACUITY • Optical factors • (i) Refractive error • (ii) Media opacities • (iii) Pupil size • • A large pupil (>6 mm) reduces VA by increasing spherical and higher order aberrations • • A small pupil (<2 mm) reduces VA by increasing diffraction of light • (iv) Wavelength • • VA is marginally better for monochromatic light; however, this is most noticeable at low contrast. • • This is because chromatic aberration leads to image degradation
  • 7.
    • Physiologic factors •(i) Foveal cone density • • The density of foveal cone packing is a critical determinant of fine visual resolution . • • Human foveal cones are separated by approximately 30 s of arc; hence, MAR is 1 min • (ii) Cone to ganglion cell convergence • • The fovea is characterized by 1:1:1 cone-bipolar-ganglion cell convergence • (iii) Retinal illumination • • At low ( scotopic ) luminance levels mediated by rods, VA is reduced; however, it increases with increasing retinal illumination. • • Under moderate photopic luminance conditions, VA remains fairly constant
  • 8.
    CLINICAL MEASUREMENT OFVISUAL ACUITY • 1. Snellen chart • 2. Bailey-Lovie and Early Treatment of Diabetic Retinopathy Study (ETDRS) charts • 3. Snellen-like tests • Illiterate E • Landolt C tests • 4. Other forms of VA testing (useful in young children) • Visual evoked reflex • Optokinetic nystagmus • Preferential looking
  • 9.
    SNELLEN VISUAL ACUITY •letters constructed such that each letter as a whole subtends an angle of 5 minutes of arc • each stroke of the letter subtends 1 arcmin • Letters of different sizes are designated by the distance at which the letter subtends an angle of 5 arcmin
  • 11.
    • Though widelyaccepted, the standard Snellen chart is not perfect • The letters on different Snellen lines are not related by size in any geometric or logarithmic sense • For example, the increase in letter size from the 6/6 line to the 6/9 line differs from the increase from the 6/9 line to the 6/12 line • In addition, certain letters (such as C, D, O, and G) are inherently harder to recognize than others (such as A and J)
  • 12.
    ETDRS CHART • eachline has the same number of letters, so crowding is standardized • decrements in size are uniform: each line is diminished in size by a factor of 0.1
  • 13.
    CONTRAST SENSITIVITY • Contrastis a measure of the lightness or darkness of an object compared to its background.
  • 14.
    RELEVANCE OF CONTRASTSENSITIVITY TO DAILY FUNCTION • • The object size influences how much contrast is needed to differentiate it from its background • Patients with normal visual acuity (VA) may complain of poor vision if CS is reduced • Snellen visual acuity is approximate 100% contrast • we are measuring, at approximately 100% contrast, the smallest optotype that the visual system can resolve
  • 15.
    • CS isdetermined by the: • (a) Stimulus contrast: luminance of the stimulus compared with the background • (b) Stimulus size: spatial extent of the stimulus against the background
  • 16.
  • 17.
    SPATIAL FREQUENCY • Denselypacked lines have high spatial frequency; sparsely packed have low spatial frequency. • • Spatial frequency is related to visual acuity • For example, for a spatial frequency of 30 c/deg, there are 30 alternating black and white stripes per degree (60 min), and each stripe subtends 1 min of arc. • • Hence, 30 c/deg is equivalent to Snellen 6/6
  • 18.
    FACTORS THAT INFLUENCECONTRAST SENSITIVITY • Scotopic vs photopic conditions • • CS is reduced for scotopic compared to photopic conditions • • Peak photopic CS occurs at spatial frequency 5 c/deg (6/36); peak scotopic CS occurs at 1 c/deg • Retinal eccentricity • CS is maximal using foveal vision. • • It reduces with increasing retinal eccentricity • Mean luminance • • CS decreases with decreasing mean luminance
  • 19.
    CLINICAL TESTING OFCONTRAST SENSITIVITY • Pelli-Robson chart - - Varying contrast at a fixed spatial frequency corresponding to peak CS (5c/min)(6/36) • Functional Acuity Contrast Test - - Varying contrast and several different frequencies
  • 21.
    AMSLER GRID • TheAmsler grid evaluates the 20° of the visual field centred on fixation
  • 22.
    • useful inscreening for and monitoring macular disease • also demonstrate central visual field defects • Patients with a risk of CNV be provided an Amsler grid for regular use at home
  • 23.
    CHARTS • Chart 1consists of a white grid on a black background, enclosing 400 smaller 5 mm squares. When viewed at about one-third of a metre, each small square subtends an angle of 1°
  • 24.
    • Chart 2is similar to chart 1 but has diagonal lines that aid fixation for patients with a central scotoma
  • 25.
    • Chart 3is identical to chart 1 but has red squares The red-on-black design aims to stimulate long Wavelength foveal cones It is used to detect subtle colour scotomas and desaturation in toxic maculopathy, optic neuropathy And chiasmal lesions
  • 26.
    • Chart 4consists only of random dots and is used mainly to distinguish scotomas from metamorphopsia, as there is no form to be distorted
  • 27.
    • Chart 5consists of horizontal lines and is designed to detect metamorphopsia along specific meridians • It is of particular use in the evaluation of patients describing difficulty reading
  • 28.
    • Chart 6is similar to chart 5 but has a white background and the central lines are closer together, enabling more detailed evaluation
  • 29.
    • Chart 7includes a fine central grid, each square subtending an angle of a half degree, and is more sensitive