Downloaded 387 times

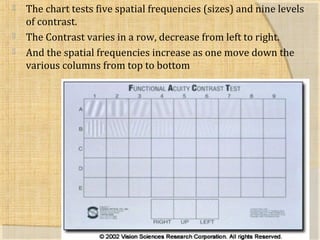
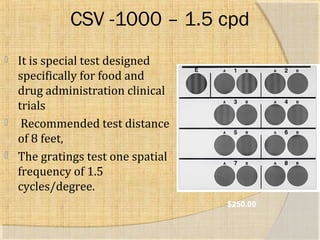
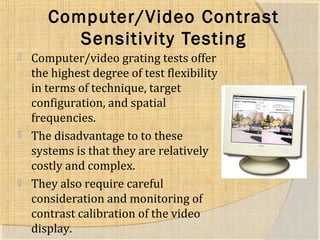
![ The two main types of CS charts are in use;
charts that show gratings, such as the
Functional Acuity Contrast Test (FACT)
charts (as it is used in the OPTEC Functional
Vision Analyzer, Stereo Optical, IL, USA),
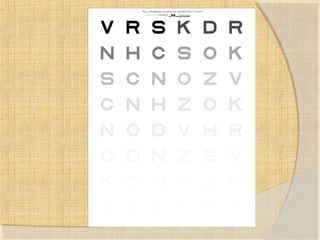
[8] and charts that show letters, either with
altering optotype size at constant contrast
settings (e.g., 5 or 10% contrast) or
optotypes that are always of the same size
but with decreasing contrast levels, such as
the Pelli Robson](https://image.slidesharecdn.com/contrastsensitivity2charts-140920083751-phpapp02/85/Contrast-sensitivity-2-charts-46-320.jpg)

This document discusses various contrast sensitivity tests used in vision testing. It describes several grating and letter-based contrast sensitivity charts, including the FACT chart, Pelli-Robson chart, Vistech tests, and Cambridge Low Contrast tests. It provides details on test administration and scoring for many of these assessments. The document also discusses computer-based contrast sensitivity testing and considerations for contrast calibration of video displays used for testing.


![Contrast sensitivity and glare discomfort [Autosaved].pptx](https://cdn.slidesharecdn.com/ss_thumbnails/contrastsensitivityandglarediscomfortautosaved-250419142217-06d6a009-thumbnail.jpg?width=640&height=640&fit=bounds)


