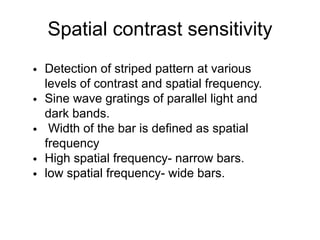
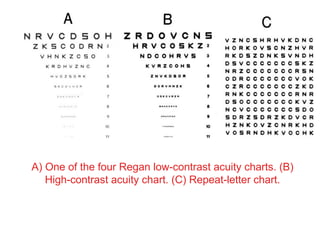
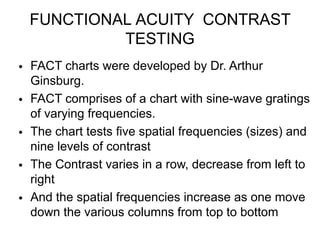
Contrast sensitivity is the ability to detect differences in luminance or contrast between areas. There are two main types: spatial contrast sensitivity, which involves detecting striped patterns of varying contrast and width, and temporal contrast sensitivity, which measures contrast sensitivity over time for a modulated target. Contrast sensitivity can be measured through tests using letters, gratings, or other patterns with decreasing contrast levels, such as the Pelli-Robson test, Bailey-Lovie chart, Cambridge Low Contrast Grating test, and FACT (Functional Acuity Contrast Testing) chart. These tests help evaluate contrast sensitivity for early detection of visual impairments.
Keratometer is an ophthalmic instruments and has a very important role in optometry field specially for IOL power calculation, Contact lens fitting, to rule out corneal pathology and its progression ie Keratoconus, PMCD.
How to protect your eye?
With sunglasses? Mirror glasses? Tinted or polarized glasses?
What is right tint colour for you?
What are antireflection coat glasses?
Presented By our respected teacher
Mohammad Siddique (Optometrist)
Thank You sir
Final Year Student Of Optometry at ISRA School Of Optometry
All Rights Reserved
Contrast sensitivity is defined as the Ability to perceive slight change in luminance between regions which are not separated by definite borders or Ability to perceive sharp outlines of relatively small objects or Ability to detect separation of the area of different contrast level
VISUAL ACUITY , Basics of vision assessmentssuserde6356
Visual acuity (VA) is a measure of the ability of the eye to distinguish shapes and the details of objects at a given distance. It is important to assess VA in a consistent way in order to detect any changes in vision. One eye is tested at a time.
Go to:
Indications
To provide a baseline recording of VA
To aid examination and diagnosis of eye disease or refractive error
To assess any changes in vision
To measure the outcomes of cataract or other surgery.
Go to:
Equipment
Multi-letter Snellen or E chart
Plain occluder, card or tissue
Pinhole occluder
Torch or flashlight
Patient's documentation.
Go to:
Procedure
Ensure good natural light or illumination on the chart. It is important to ensure that the person has the best possible chance of seeing and reading the test chart as treatment decisions are made based on the results of VA testing.
If the test is done outdoors, the chart should be in bright light and the patient in the shade, with enough light to illuminate the patient's face during the test.
Explain the procedure to the patient. Tell patients that it is not a test that they have to pass, but a test to help us know how their eyes are working. Tell them not to guess if they cannot see.
Ensure that any equipment that the patient touches is clean and is cleaned between patients. Infections can be passed between patients if equipment – or the testers' hands – are not clean.
Position the patient, sitting or standing, at a distance of 6 metres from the chart. The patient can hold one end of a cord or rope of 6 metres long to ensure that the distance is maintained
Test the eyes one at a time, at first without any spectacles (if worn).
Note: Some people prefer to always test the right eye first. Others prefer to test the ‘worse’ eye first (ask the patient out of which eye they see best). This ensures that the minimum is read with the ‘worse’ eye, and more will be read with the ‘good’ eye. This means that no letters are remembered, which could make the second visual acuity appear better than it is.
An external file that holds a picture, illustration, etc.
Object name is jceh_27_85_016_f04.jpg
Visual acuity should be measured from a standard distance, using a standard chart with a white background
Ask the patient to cover one eye with a plain occluder, card or tissue. They should not press on the eye; this is not good for an eye that has undergone surgery. It can also make any subsequent intraocular pressure reading inaccurate and it will distort vision when the occluded eye is tested.
Ask the patient to read from the top of the chart and from left to right. If the patient cannot read the letters due to language difficulties, use an E chart. The patient is asked to point in the direction the ‘legs’ of the E are facing.
Note: there is a one in four chance that the patient can guess the direction; therefore it is recommended that the patient should correctly indicate the orientation of most letters of the same size, e.g. four out of five or five out
The Indian economy is classified into different sectors to simplify the analysis and understanding of economic activities. For Class 10, it's essential to grasp the sectors of the Indian economy, understand their characteristics, and recognize their importance. This guide will provide detailed notes on the Sectors of the Indian Economy Class 10, using specific long-tail keywords to enhance comprehension.
For more information, visit-www.vavaclasses.com
Students, digital devices and success - Andreas Schleicher - 27 May 2024..pptxEduSkills OECD
Andreas Schleicher presents at the OECD webinar ‘Digital devices in schools: detrimental distraction or secret to success?’ on 27 May 2024. The presentation was based on findings from PISA 2022 results and the webinar helped launch the PISA in Focus ‘Managing screen time: How to protect and equip students against distraction’ https://www.oecd-ilibrary.org/education/managing-screen-time_7c225af4-en and the OECD Education Policy Perspective ‘Students, digital devices and success’ can be found here - https://oe.cd/il/5yV
How to Split Bills in the Odoo 17 POS ModuleCeline George
Bills have a main role in point of sale procedure. It will help to track sales, handling payments and giving receipts to customers. Bill splitting also has an important role in POS. For example, If some friends come together for dinner and if they want to divide the bill then it is possible by POS bill splitting. This slide will show how to split bills in odoo 17 POS.
The French Revolution, which began in 1789, was a period of radical social and political upheaval in France. It marked the decline of absolute monarchies, the rise of secular and democratic republics, and the eventual rise of Napoleon Bonaparte. This revolutionary period is crucial in understanding the transition from feudalism to modernity in Europe.
For more information, visit-www.vavaclasses.com
We all have good and bad thoughts from time to time and situation to situation. We are bombarded daily with spiraling thoughts(both negative and positive) creating all-consuming feel , making us difficult to manage with associated suffering. Good thoughts are like our Mob Signal (Positive thought) amidst noise(negative thought) in the atmosphere. Negative thoughts like noise outweigh positive thoughts. These thoughts often create unwanted confusion, trouble, stress and frustration in our mind as well as chaos in our physical world. Negative thoughts are also known as “distorted thinking”.
How to Create Map Views in the Odoo 17 ERPCeline George
The map views are useful for providing a geographical representation of data. They allow users to visualize and analyze the data in a more intuitive manner.
2. Definition
• The ability to perceive slight changes in
luminance between regions which are not
separated by definite borders and is just as
important as the ability to perceive sharp outlines
of relatively small objects.
• lt is the ability to detect separation of the area of
different contrast level.
4. Spatial contrast sensitivity
• Detection of striped pattern at various
levels of contrast and spatial frequency.
• Sine wave gratings of parallel light and
dark bands.
• Width of the bar is defined as spatial
frequency
• High spatial frequency- narrow bars.
• low spatial frequency- wide bars.
5. • The spatial frequency increases
exponentially from left to right. The contrast
also varies logarithmically from 100% at the
bottom to about 0.5% at the top
6. Temporal contrast sensitivity
• Contrast sensitivity function is generated
for the time related processing in the visual
system by presenting a uniform target field
modulated sinusoidal in time.
• The shape of the contrast sensitivity
function varies with factor
1. Luminance
2. Target size
3. Grating motion
4. Grating shap
9. • letters of the samesize but with reducing
contrast .
• Two charts and two scoring pads.
• Each chart has 6 letters in each row
organized into two triplets of varying contrast.
• illumination of the chart is 85 cd/mm21 meter
distance
• The score of the test is recorded by the
faintest triplet out of which at least 2 letters
are correctly identified.
• The log CS value for this triplet is given by the
number on the scoring pad.
10. BAILEY LOVIE CHART
• Low contrast acuity testing & acuity testing in
presence of glare.
• Each row has same no. of symbols & constant
spacing is used between rows & letters.
• Chart is logarithmic based & visual acuity is
based on log of minimum angle of resolution or
logMAR.
• Berkely Glare Test provides 10% of contrast & is
provided with glare source
11.
12. CAMBRIDGE LOW CONTRAST
GRATING
• It is a rapid and simple screening test for
contrast sensitivity.
• Performed at a distance of 6m.
• It comprises of 12 pair of plates consisting of
stripes of varying contrast.
• First one is for demonstration and rest are for
the proper testing and are numbered from 1-10.
• The plates are changed sequentially starting
from plate 1 till the patient fails to respond.
13. • Then a new series is begun starting 4 plates prior
to where the patient failed to respond.
• Four such series are completed and the score of
each series is noted (numbered as per the number
of plate read) and added.
• The final total value is converted into contrast
sensitivity fromthe provided table.
14. REGAN LOW CONTRAST
LETTER CHARTS
• Consists of three letter charts, printed on white
cardboard having contrast of 97%, 7% and 4%
• 3 meter with eight letters in each line
• Patients are instructed to start at the top and to
continue reading until they can correctly identify no
letters on a line.
• For one chart letter size goes on reducing and
contrast remains constant
• Regan in 1988 suggested there chief role in
detecting early visual loss in diabetes and glaucoma
15. A) One of the four Regan low-contrast acuity charts. (B)
High-contrast acuity chart. (C) Repeat-letter chart.
16. FUNCTIONAL ACUITY CONTRAST
TESTING
• FACT charts were developed by Dr. Arthur
Ginsburg.
• FACT comprises of a chart with sine-wave gratings
of varying frequencies.
• The chart tests five spatial frequencies (sizes) and
nine levels of contrast
• The Contrast varies in a row, decrease from left to
right
• And the spatial frequencies increase as one move
down the various columns from top to bottom
17. • This test is performed at a distance of 10 feet.
• The patient determines the last grating seen for
each row (A, B, C, D and E) and reports the
orientation of the grating: right, up or left.
• The last correct grating seen for each spatial
frequency is plotted on a contrast sensitivity
curve.
18.
19. THE ARDEN PLATE TEST
• Introduced in 1978.
• Consists of a booklet containing several sine
wave gratings patterns
• Each grating is oriented vertically
• The contrast varies from the top to the bottom
of the grating, lowest at the top and highest at
the bottom.