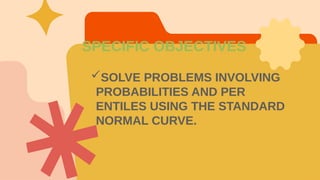
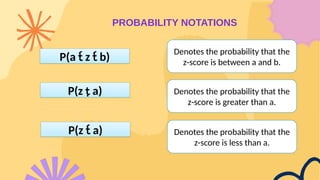
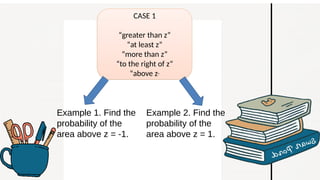
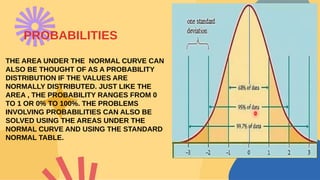
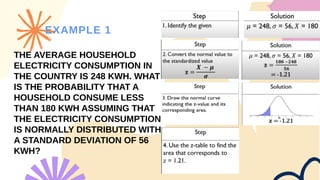
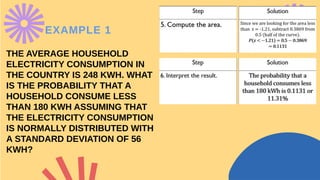
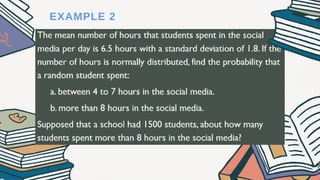
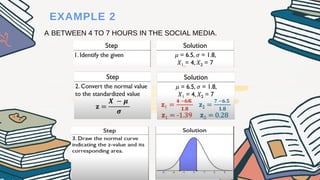
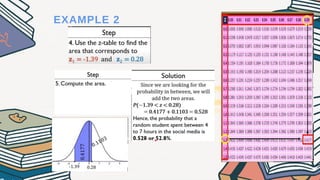
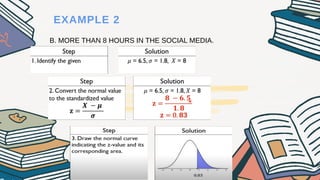
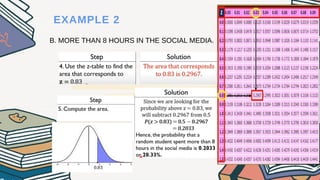
The document explains how to compute probabilities and percentiles using the standard normal table, detailing various cases such as finding probabilities greater than, less than, and between certain z-scores. It includes several examples related to normal distributions, such as household electricity consumption and social media usage among students. The content emphasizes that the area under the normal curve represents probability, ranging from 0 to 1.