Downloaded 143 times

![Piecewise Function – Domain and Range
Domain
Range
(-6, 7)
(-1,5)
Domain
Range
[-7, 7]
(- 4.5,-1] ∪ [0, 4)](https://image.slidesharecdn.com/piecewisefunctions-191203182616/85/Piecewise-functions-18-320.jpg)
![Domain
Range
(-7, -1)∪ (-1, 7]
[-1, 5) ∪ {6}
Domain
Range
(-7, 4) ∪ [5, 7)
[-7, -5) ∪ (-2, 7)](https://image.slidesharecdn.com/piecewisefunctions-191203182616/85/Piecewise-functions-19-320.jpg)
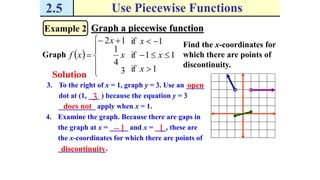
![
3 7 x 4
1
x 2 4 x 0
2
1
x 4
x
0 x 5
5 x 7
g
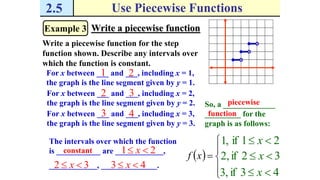
Domain
Range
(-7, 7]
(-4, -2) ∪ [-1, 4]](https://image.slidesharecdn.com/piecewisefunctions-191203182616/85/Piecewise-functions-21-320.jpg)
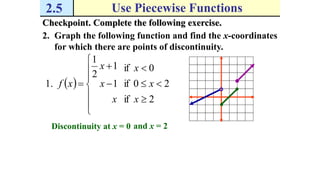
![
1
x 6 x 3
3
x 1 3 x 0h x
x 4 0 x 3
x 3 3 x 7
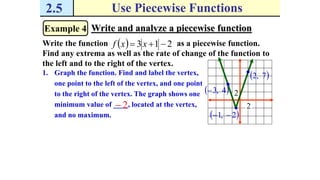
Domain
Range
[-6, 7]
[-4, 2] ∪ (4, 7)](https://image.slidesharecdn.com/piecewisefunctions-191203182616/85/Piecewise-functions-22-320.jpg)

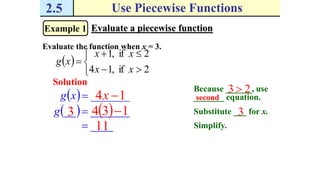
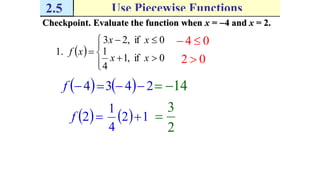
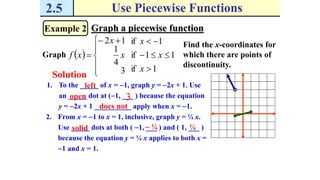
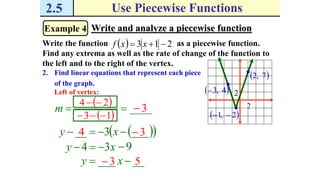
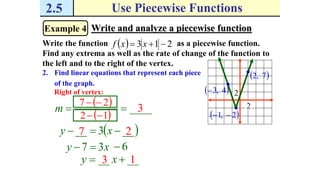
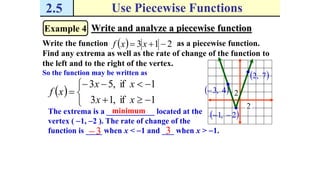
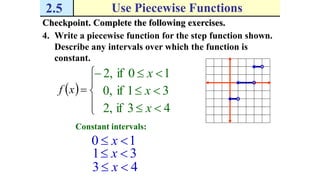
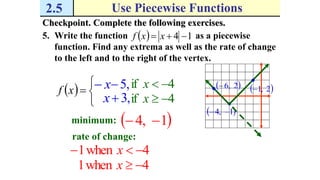

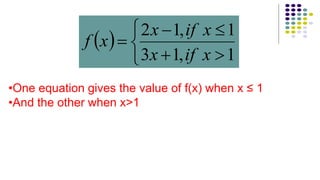
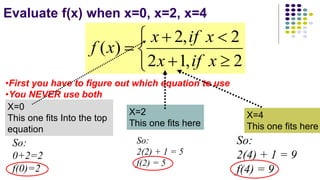
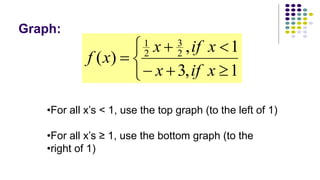
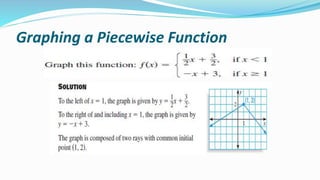
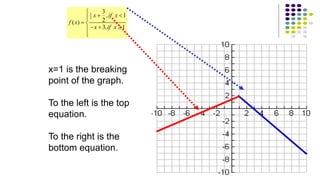
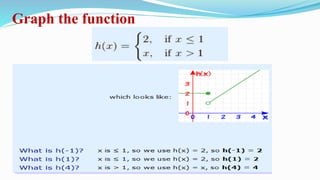
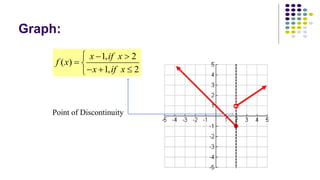
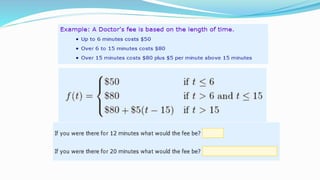
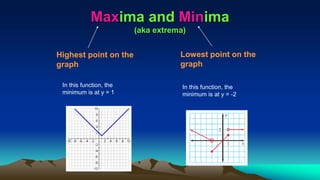
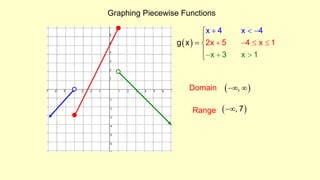
The document discusses piecewise functions, which are functions defined by multiple rules over different parts of the domain. It provides examples of piecewise functions, including how to graph them by applying each rule over the appropriate portion of the domain. It also discusses evaluating piecewise functions at given values, writing piecewise functions based on graphs, and analyzing properties like extrema. Piecewise functions allow modeling of real-world situations using multiple equations each corresponding to a part of the input range.