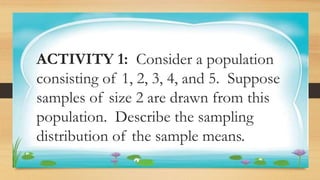
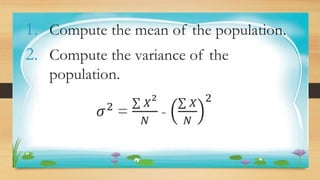
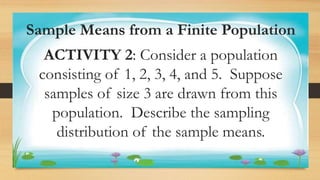
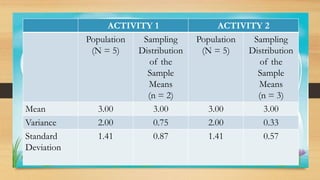
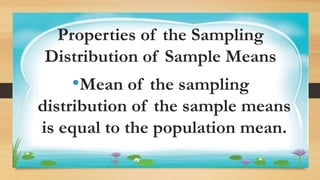
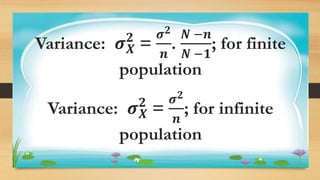
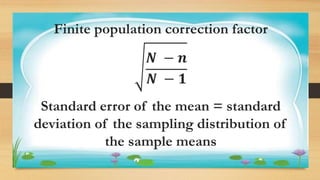
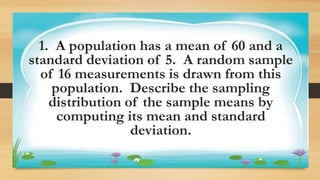
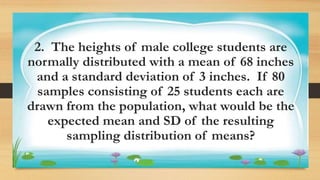
Finding the
Mean and
Variance of the
Sampling
Distribution of
the Sample
Means
Activity 1
ACTIVITY 1: Consider a population
consisting of 1, 2, 3, 4, and 5. Suppose
samples of size 2 are drawn from this
population. Describe the sampling
distribution of the sample means.
Activity 1
1. Compute the mean of the population.
2. Compute the variance of the
population.
𝜎2 =
𝑋
2
𝑁
-
𝑋
𝑁
2
Activity 1
3. Determine the number of possible
samples of size n = 2.
4. List all possible samples and their
corresponding means.
5. Construct the sampling distribution of
the sample means.
Activity 1
6. Compute the mean of the sampling
distribution of the sample means.
7. Compute the variance of the sampling
distribution of the sample means.
Activity 1
Sample Means from a Finite Population
ACTIVITY 2: Consider a population
consisting of 1, 2, 3, 4, and 5. Suppose
samples of size 3 are drawn from this
population. Describe the sampling
distribution of the sample means.
Activity 1
ACTIVITY 1 ACTIVITY 2
Population
(N = 5)
Sampling
Distribution
of the
Sample
Means
(n = 2)
Population
(N = 5)
Sampling
Distribution
of the
Sample
Means
(n = 3)
Mean 3.00 3.00 3.00 3.00
Variance 2.00 0.75 2.00 0.33
Standard
Deviation
1.41 0.87 1.41 0.57
Activity 1
Properties of the Sampling
Distribution of Sample Means
•Mean of the sampling
distribution of the sample means
is equal to the population mean.
Activity 1
Variance: 𝝈𝑿
𝟐
=
𝝈𝟐
𝒏
.
𝑵 −𝒏
𝑵 −𝟏
; for finite
population
Variance: 𝝈𝑿
𝟐
=
𝝈𝟐
𝒏
; for infinite
population
Activity 1
Finite population – consists of a finite
or fixed number of elements,
measurements, or observations.
Infinite Population – contains,
hypothetically at least, infinitely
elements.
Activity 1
Finite population correction factor
𝑵 − 𝒏
𝑵 − 𝟏
Standard error of the mean = standard
deviation of the sampling distribution of
the sample means
Activity 1
Standard error of the mean = measures
the degree of accuracy of the sample
mean as an estimate of the population
mean.
Activity 1
The Central Limit Theorem
If random samples of size n are drawn
from a population, then as n becomes
larger, the sampling distribution of the
mean approaches the normal distribution,
regardless of the shape of the population
distribution.
Activity 1
Describing the Sampling Distribution
of the Sample Means from an Infinite
Population
Activity 1
1. A population has a mean of 60 and a
standard deviation of 5. A random sample
of 16 measurements is drawn from this
population. Describe the sampling
distribution of the sample means by
computing its mean and standard
deviation.
Activity 1
2. The heights of male college students are
normally distributed with a mean of 68 inches
and a standard deviation of 3 inches. If 80
samples consisting of 25 students each are
drawn from the population, what would be the
expected mean and SD of the resulting
sampling distribution of means?

Mean-and-Variance-of-the-Sample-Means (2).pptx

  • 1.
    Finding the Mean and Varianceof the Sampling Distribution of the Sample Means
  • 2.
    Activity 1 ACTIVITY 1:Consider a population consisting of 1, 2, 3, 4, and 5. Suppose samples of size 2 are drawn from this population. Describe the sampling distribution of the sample means.
  • 3.
    Activity 1 1. Computethe mean of the population. 2. Compute the variance of the population. 𝜎2 = 𝑋 2 𝑁 - 𝑋 𝑁 2
  • 4.
    Activity 1 3. Determinethe number of possible samples of size n = 2. 4. List all possible samples and their corresponding means. 5. Construct the sampling distribution of the sample means.
  • 5.
    Activity 1 6. Computethe mean of the sampling distribution of the sample means. 7. Compute the variance of the sampling distribution of the sample means.
  • 6.
    Activity 1 Sample Meansfrom a Finite Population ACTIVITY 2: Consider a population consisting of 1, 2, 3, 4, and 5. Suppose samples of size 3 are drawn from this population. Describe the sampling distribution of the sample means.
  • 7.
    Activity 1 ACTIVITY 1ACTIVITY 2 Population (N = 5) Sampling Distribution of the Sample Means (n = 2) Population (N = 5) Sampling Distribution of the Sample Means (n = 3) Mean 3.00 3.00 3.00 3.00 Variance 2.00 0.75 2.00 0.33 Standard Deviation 1.41 0.87 1.41 0.57
  • 8.
    Activity 1 Properties ofthe Sampling Distribution of Sample Means •Mean of the sampling distribution of the sample means is equal to the population mean.
  • 9.
    Activity 1 Variance: 𝝈𝑿 𝟐 = 𝝈𝟐 𝒏 . 𝑵−𝒏 𝑵 −𝟏 ; for finite population Variance: 𝝈𝑿 𝟐 = 𝝈𝟐 𝒏 ; for infinite population
  • 10.
    Activity 1 Finite population– consists of a finite or fixed number of elements, measurements, or observations. Infinite Population – contains, hypothetically at least, infinitely elements.
  • 11.
    Activity 1 Finite populationcorrection factor 𝑵 − 𝒏 𝑵 − 𝟏 Standard error of the mean = standard deviation of the sampling distribution of the sample means
  • 12.
    Activity 1 Standard errorof the mean = measures the degree of accuracy of the sample mean as an estimate of the population mean.
  • 13.
    Activity 1 The CentralLimit Theorem If random samples of size n are drawn from a population, then as n becomes larger, the sampling distribution of the mean approaches the normal distribution, regardless of the shape of the population distribution.
  • 14.
    Activity 1 Describing theSampling Distribution of the Sample Means from an Infinite Population
  • 15.
    Activity 1 1. Apopulation has a mean of 60 and a standard deviation of 5. A random sample of 16 measurements is drawn from this population. Describe the sampling distribution of the sample means by computing its mean and standard deviation.
  • 16.
    Activity 1 2. Theheights of male college students are normally distributed with a mean of 68 inches and a standard deviation of 3 inches. If 80 samples consisting of 25 students each are drawn from the population, what would be the expected mean and SD of the resulting sampling distribution of means?