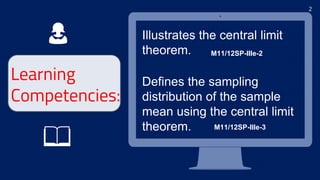
Statistics and Probability
Central Limit Theorem
Illustrates the central limit
theorem.
2
Defines the sampling
distribution of the sample
mean using the central limit
theorem.
Learning
Competencies:
👩
📖
M11/12SP-IIIe-2
M11/12SP-IIIe-3
The mean of the sampling distribution of
the sample mean is equal to the population
mean.
3
Theorem 3-1
𝝁𝒙 - mean of the sampling distribution of sample means
𝝁 – population mean
𝝁𝒙 = 𝝁
The variance and standard deviation of a
sampling distribution of the sample means are
as follows:
4
Theorem 3-2
𝑣𝑎𝑟𝑖𝑎𝑛𝑐𝑒
𝑠𝑡𝑎𝑛𝑑𝑎𝑟𝑑 𝑑𝑒𝑣𝑖𝑎𝑡𝑖𝑜𝑛
(𝝈𝒙)𝟐 =
𝝈𝟐
𝒏
𝝈𝒙 =
𝝈
𝒏
EXAMPLE
Find the sample variance and the sample
standard deviation of a population, given 𝜎 = 5 and
𝑛 = 10
5
Given:
=
52
10
𝝈 = 𝟓 𝒏 = 𝟏𝟎
(𝝈𝒙)𝟐
=
𝝈𝟐
𝒏
= 𝟐. 𝟓
Solution:
=
25
10
𝝈𝒙 =
𝝈
𝒏
=
5
10
=
5
3.162
≈ 𝟏. 𝟓𝟖
If random samples of size n are drawn
from a population, then as n becomes
larger, the sampling distribution of the
mean approaches the normal
distribution, regardless of the shape of
the population distribution.
6
Central Limit Theorem
The standard error of the mean measures the
degree of accuracy of the sample mean as an
estimate of the population mean. It is also
known as the standard deviation of the
sampling distribution of the sample mean,
denoted by sample mean.
7
Standard Error of the Mean
Given a die, it has 6 faces in which each
faces have either dot/s of x = 1, 2, 3, 4, 5, and 6.
8
Example:
1. Compute the population mean
2. Compute the population variance
3. Compute the population standard deviation
4. Illustrate the probability histogram of the
sampling distribution of the mean.
9
1. Compute the population mean.
µ =
∑x
N
where:
𝜇 − population mean
𝛴 x − sum of all data in terms of x
N − population size
µ =
∑𝒙
𝑵
=
1+2+3+4+5+6
6
=
21
6
= 3.5
10
2. Compute the population variance.
X (X-𝜇)
1
2
3
4
5
6
N=6
1-3.5 = -2.5
2-3.5 = -1.5
5-3.5 = 1.5
4-3.5 = 0.5
6-3.5 = 2.5
3-3.5 = -0.5
11
3. Compute the population standard deviation
X (X-𝜇) (X- 𝜇)²
1 1-3.5 = -2.5
2 2-3.5 = -1.5
3 3-3.5 = -0.5
4 4-3.5 = 0.5
5 5-3.5 = 1.5
6 6-3.5 = 2.5
N=6
(2.5)² = 6.25
(0.5)² = 0.25
(1.5)² = 2.25
(2.5)² = 6.25
(-1.5)² = 2.25
(-0.5)² = 0.25
𝛴 (x -𝜇)² = 17.5
12
X (X-𝜇) (X- 𝜇)² P(X)
1 1-3.5 = -2.5 (2.5)² = 6.25
2 2-3.5 = -1.5 (-1.5)² = 2.25
3 3-3.5 = -0.5 (-0.5)²= 0.25
4 4-3.5 = 0.5 (0.5)² = 0.25
5 5-3.5 = 1.5 (1.5)² = 2.25
6 6-3.5 = 2.5 (2.5)²= 6.25
N=6 𝛴 (x -𝜇)² = 17.5
1/6
1/6
1/6
1/6
1/6
1/6
13
𝛔𝟐
=
∑ 𝐗 − µ 𝟐
𝒏
Population variance
=
17.5
6
≈ 𝟐. 𝟗𝟐
𝛔 = 𝛔𝟐
Population standard deviation
= 2.92 ≈ 𝟏. 𝟕𝟏
14
The population mean and
sampling distribution
means are both equal
which is 3.5. It has a
variance of approximately
2.92 and a standard
deviation of approximately
1.71. Since all samples
have the same probability
of 1/6. The trend of the
histogram is like a flat line
horizontally.
Consider a population of Senior High School
consisting of the values 2, 4, 6, 8, 10 and 12.
15
Problem:
1. Compute the population mean
2. Compute the population variance
3. Compute the population standard deviation
4. Illustrate the probability histogram of the
sampling distribution of the mean.
16
1. Compute the population mean.
µ =
∑x
N
where:
𝜇 − population mean
𝛴 x − sum of all data in terms of x
N − population size
µ =
∑𝒙
𝑵
=
2+3+6+9+10+12
6
=
42
6
= 7
17
2. Compute the population variance.
X (X-𝜇)
2 2 - 7 = - 5
4 4 - 7 = - 3
6 6 - 7 = - 1
8 8 - 7 = 1
10 10 - 7= 3
12 12 - 7 = 5
N=42
18
3. Compute the population standard deviation
X (X-𝜇) (X- 𝜇)²
2 2 - 7 = - 5 (-5)² = 25
4 4 - 7 = - 3 (-3)² = 9
6 6 - 7 = - 1 (- 1)²= 1
8 8 - 7 = 1 (1)² = 1
10 10 - 7= 3 (3)² = 9
12 12 - 7 = 5 (5)²= 25
N=42 𝛴 (x -𝜇)² = 70
19
X (X-𝜇) (X- 𝜇)² P(X)
2 2 - 7 = - 5 (-5)² = 25
4 4 - 7 = - 3 (-3)² = 9
6 6 - 7 = - 1 (- 1)²= 1
8 8 - 7 = 1 (1)² = 1
10 10 - 7= 3 (3)² = 9
12 12 - 7 = 5 (5)²= 25
N=42 𝛴 (x -𝜇)² = 70
1/6
1/6
1/6
1/6
1/6
1/6
20
𝛔𝟐
=
∑ 𝐗 − µ 𝟐
𝒏
Population variance
=
70
6
≈ 𝟏𝟏. 𝟔𝟕
𝛔 = 𝛔𝟐
Population standard deviation
= 11.67 ≈ 𝟑. 𝟒𝟐
21
The population mean and
sampling distribution
means are both equal
which is 7. It has a
variance of approximately
11.67 and a standard
deviation of approximately
3.42. Since all samples
have the same probability
of 1/6. The trend of the
histogram is like a flat line
horizontally.
Consider a population of Delfin Albano consisting of
the values 5, 10, 15, 20, 25, 30, 35 and 40.
22
Problem:
1. Compute the population mean
2. Compute the population variance
3. Compute the population standard deviation
4. Illustrate the probability histogram of the
sampling distribution of the mean.
23
1. Compute the population mean.
µ =
∑x
N
where:
𝜇 − population mean
𝛴 x − sum of all data in terms of x
N − population size
µ =
∑𝒙
𝑵
=
5+10+15+20+25+30+35+40
6
=
180
10
= 18
24
X (X-𝜇) (X- 𝜇)² P(X)
5 5 - 8 = - 3 (-3)² = 9
10 10 - 8 = 2 (2)² = 4
15 15 - 8 = 7 (-7)²= 49
20 20 - 8 = 12 (12)² = 144
25 25 - 8= 17 (17)² = 289
30 30 - 8 = 22 (22)²= 484
35 35 – 8 = 27 (27)² = 729
40 40 – 8 =32 (32)² =1,024
N=180
𝛴 (x -𝜇)² = 2732
1/8
1/8
1/8
1/8
1/8
1/8
1/8
1/8
25
𝛔𝟐
=
∑ 𝐗 − µ 𝟐
𝒏
Population variance
=
2732
8
≈ 𝟑𝟒𝟏. 𝟓
𝛔 = 𝛔𝟐
Population standard deviation
= 341.5 ≈ 𝟏𝟖. 𝟒𝟖
26
X (X-𝜇) (X- 𝜇)² P(X)
10
15
25
34
43
56
ASSIGNMENT:
27
Statistics and Probability
Central Limit Theorem
If the standard deviation is used as an
estimator of population parameter instead of
the mean, then the standard error (SE) is:
29
Standard Error
𝑺𝑬 = 𝝈𝒙
𝟐 =
𝝈
𝒏
The transformation of the z – score
considering the standard error is:
30
z – transformation
𝒛 =
𝒙 − 𝝁
𝝈
𝒏
The formula for the z – score when
working with the sample mean is given by
31
𝒛 =
𝒙 − 𝝁
𝝈
𝒏
Theorem 3-3
𝒏 = sample size
𝒙 = sample mean
𝝁= population mean
𝝈 = population standard deviation
32
REMEMBER
The distribution is approximately normal if
𝒏 ≥ 𝟑𝟎 regardless of the shape of distribution.
If 𝐧 ≤ 𝟑𝟎 , the sample mean 𝒙 is also
approximately normal as long as the
population is normally distributed.
Population Variance is given
The formula for the sampling
distribution of a normal population if the
population variance is given is
𝒛 =
𝒙 − 𝝁
𝝈
𝒏
33
EXAMPLE 1: The average time it takes a group
of CCSASHS students to complete a Statistics
test is 54.8 minutes. The standard deviation is
5 minutes. We shall assume that the data are
normally distributed.
If there are 50 randomly selected students.
What is the probability that the mean time it
takes the group to finish the test will be less
than 53 minutes?
35
𝑛 = 50 𝒙 = 53
𝝁 = 54.8 𝝈 = 5
1. Identify the given
36
2. Identify what is asked
P( 𝑥˂ 53)
37
3. Identify the formula
𝒛 =
𝒙 − 𝝁
𝝈
𝒏
38
4. Solution to the problem
𝒛 =
𝒙 − 𝝁
𝝈
𝒏
=
53 − 54.8
5
50
= −𝟐. 𝟓𝟓
=
−1.8
0.707
or
.0054 or 54%
39
.0054
-2.5
.05
40
5. Illustrate
41
6. State your final answer
The probability that 50
randomly selected students will
finish the test in less than 53
minutes is 0.54%
EXAMPLE 2: Suppose the average age of
the family members is 34 with a standard
deviation of 4. If 100 members of the
community decided to have a summer
outing bonding and relaxation. Find the
probability that the average of these
member/s is less than 35?
43
𝑛 = 100 𝒙 = 35
𝝁 = 34 𝝈 = 4
1. Identify the given
44
2. Identify what is asked
P( 𝑥˂ 35)
45
3. Identify the formula
𝒛 =
𝒙 − 𝝁
𝝈
𝒏
46
4. Solution to the problem
𝒛 =
𝒙 − 𝝁
𝝈
𝒏
=
35 − 34
4
100
=
1
0.4
= 2.5
or
0.9938 or 99.38 %
47
2.5
.00
.9938
48
5. Illustrate
49
6. State your final answer
The probability that the random
sample of 100 persons has an
average of fewer than 35 years
old is 0.9938 0r 99.38%
EXAMPLE 3: The mean time it takes a group of
senior high students to complete a
certain examination is 50.6 minutes. The
standard deviation is 6 minutes.
Assume that the variable is normally distributed.
If 49 randomly selected senior high school
students take the examination, what is the
probability that the mean time it takes the group
to complete the test is between 47.8 and 53
51
𝒏 = 49 𝒙 = 47.8 𝑎𝑛𝑑 53
𝝁 = 50.6 𝝈 = 6
1. Identify the given
52
2. Identify what is asked
P( 47.8 < 𝑥 < 53)
53
3. Identify the formula
𝒛 =
𝒙 − 𝝁
𝝈
𝒏
54
4. Solution to the problem
𝒛 =
𝒙 − 𝝁
𝝈
𝒏
=
47.8 − 50.6
6
49
= -3.27
=
−2.8
0.857
P(𝑥 >47.8) = P(𝑧 > - 3.27)
=0.0005
4.a
55
4. Solution to the problem
𝒛 =
𝒙 − 𝝁
𝝈
𝒏
=
53 − 50.6
6
49
= 2.8
=
2.4
0.857
P(𝑥 <53) = P(z > 2.8)
=0.9974
4.b
56
3.2
.07
.0005
2.8
.00
.9974
0.9974-0.0005=0.9969 or 99.69%
57
5. Illustrate
58
6. State your final answer
The probability that 49 randomly
selected senior high school
students will complete the test
between 47.8 and 53 minutes is
99.69%
PROBLEM: The average time it takes a group of
Senior High School students to complete a
certain examination is 48.2 minutes. The
standard deviation is 7 minutes. Assume that
the variable is normally distributed.
1. If 40 randomly selected SHS student take the
examination, what is the probability that the mean it
takes the group to complete the test will be less than
45 minutes??
60
𝒏 = 40, 𝒙 = 45, 𝝁 = 48.2,𝝈 = 7
1. Identify the given
2. Identify what is asked P( 𝑥˂ 45)
3. Identify the formula
𝒛 =
𝒙 − 𝝁
𝝈
𝒏
𝒛 =
𝒙 − 𝝁
𝝈
𝒏
61
4. Solution to the problem
=
45 − 48.2
7
40
= - 2.89
=
−3.2
7
40
2.9 .0019
.00
.0019 or
19% |
62
5. Illustrate
6. State your final answer
The probability that 40 randomly selected SHS
students will complete the test in less than 45
minutes is 0.0019 or 0.19%
PROBLEM: An investigator of a case of food
poisoning found that the amount of salmonella
in every serving of food is normally distributed
with an average of 3.7 colony forming units per
(cfu/g) and a standard deviation of 1.19 cfu/g.
1. What is the probability that a selected
serving has at least 4.2 cfu/g of
salmonella?
64
𝒏 = 1,
𝒙 = 42
𝑐𝑓𝑢
𝑔
, 𝝁 = 3.7
𝑐𝑓𝑢
𝑔
𝝈 = 1.19
𝑐𝑓𝑢
𝑔
1. Identify the given
2. Identify what is asked P( 𝑥 ≥ 4.2)
3. Identify the formula
𝒛 =
𝒙 − 𝝁
𝝈
𝒏
𝒛 =
𝒙 − 𝝁
𝝈
𝒏
65
4. Solution to the problem
=
4.2 − 3.7
1.19
1
= 𝟎. 𝟒𝟐
=
0.5
1.19
1
0.4
.02
.6628
.6628 or
66.28%
66
5. Illustrate
6. State your final answer
The probability that a selected serving has at least
4.2 cfu/g of salmonella is 33.72%.
PROBLEM: An investigator of a case of food poisoning
found that the amount of salmonella in every serving of
food is normally distributed with an average of 3.7
colony forming units per (cfu/g) and a standard
deviation of 1.19 cfu/g.
1. What is the probability that a selected serving
has at least 4.2 cfu/g of salmonella?
2. What is the probability that the mean of 10
randomly selected servings is at least 4.2 cfu/g?
ASSIGNMENT:
𝝁 = 3.7
𝑐𝑓𝑢
𝑔
68
Given: 𝒙 = 4.2
𝑐𝑓𝑢
𝑔 𝝈 = 1.19
𝑐𝑓𝑢
𝑔
𝒛 =
𝒙 − 𝝁
𝝈
𝒏
=
4.2 − 3.7
1.19
10
= 1.33
= 𝟎. 𝟎𝟗𝟏𝟖 𝒐𝒓 𝟗. 𝟏𝟖%
𝑛 = 10,
=
0.5
0.3763
𝐴1.33 = 0.9082
∴ 𝑃 𝑋 ≥ 1.33 = 1 − 0.9082
The probability that ten serving has at least 4.2 cfu/g of salmonella is 9.18%
𝟏. 𝟑𝟑
1.3
.03
.9082
69
𝝈𝒙 =
𝝈
𝒏 𝝈𝒙 =
𝟏. 𝟏𝟗
𝟏𝟎 = 0.376
𝝈𝒙 =
𝟏. 𝟏𝟗
𝟏
= 1.19
Lower standard deviation
Higher standard
deviation
70
Urphone Company claims that the life of their battery products
is approximately normally distributed with a mean length of 8
hours of battery life when used in DC motors, with a standard
deviation of 3.8 hours. What is the probability that a 10 batteries
will have a mean lifespan of less than 6 hours in DC motors?
8
3.8 10
6
The probability that the sample of 10 batteries will have a mean lifespan of
less than 6 hours is 4.85%
71
Given: 𝑛 = 10, 𝝈 = 3.8
𝝁 =8,
𝒙 = 𝟔,
𝒛 =
𝒙 − 𝝁
𝝈
𝒏
=
6 − 8
3.8
10
=
−2
1.2017
= −1.66
.0485
=.0485
-1.6
.06
0.0485 𝑜𝑟 4.85%
−𝟏. 𝟔𝟔
72
Activity 1 Solve the following problems
1. The average
production of all the
machines in a fabrication
is 15 finished materials in
one hour with a standard
deviation of 3 materials
per hour. What is the
probability that the
sample of 5 machines will
produce more than 17
materials per hour?
1. Identify the given
2. Identify what is asked
4. Solution to the problem
3. Identify the formula
5. Illustrate
6. State your final answer
73
2. The average
rating of a public
high school
students in a
certain division of
region II is 85%
with a standard
deviation of 3.
a) If a student is
selected, what is the
probability that his
average rating is
greater than 80%
b) If a random sample
of 20 senior high
school students is
selected, what is the
probability that the
average rating is less
than 80%?
1. Identify the given
2. Identify what
is asked
4. Solution to the
problem
3. Identify the
formula
5. Illustrate
6. State your final
answer
74
Source: Statistics & Probability Book
DepEd Module
Thank you!
Disclaimer:
This video lesson is created for educational
purposes only.
No copyright claim
Keep safe everyone!
75
Z - Table
( Negative )
Z - Table
( Positive )

CENTRAL LIMIT THEOREM- STATISTICS AND PROBABILITY

  • 1.
  • 2.
    Illustrates the centrallimit theorem. 2 Defines the sampling distribution of the sample mean using the central limit theorem. Learning Competencies: 👩 📖 M11/12SP-IIIe-2 M11/12SP-IIIe-3
  • 3.
    The mean ofthe sampling distribution of the sample mean is equal to the population mean. 3 Theorem 3-1 𝝁𝒙 - mean of the sampling distribution of sample means 𝝁 – population mean 𝝁𝒙 = 𝝁
  • 4.
    The variance andstandard deviation of a sampling distribution of the sample means are as follows: 4 Theorem 3-2 𝑣𝑎𝑟𝑖𝑎𝑛𝑐𝑒 𝑠𝑡𝑎𝑛𝑑𝑎𝑟𝑑 𝑑𝑒𝑣𝑖𝑎𝑡𝑖𝑜𝑛 (𝝈𝒙)𝟐 = 𝝈𝟐 𝒏 𝝈𝒙 = 𝝈 𝒏
  • 5.
    EXAMPLE Find the samplevariance and the sample standard deviation of a population, given 𝜎 = 5 and 𝑛 = 10 5 Given: = 52 10 𝝈 = 𝟓 𝒏 = 𝟏𝟎 (𝝈𝒙)𝟐 = 𝝈𝟐 𝒏 = 𝟐. 𝟓 Solution: = 25 10 𝝈𝒙 = 𝝈 𝒏 = 5 10 = 5 3.162 ≈ 𝟏. 𝟓𝟖
  • 6.
    If random samplesof size n are drawn from a population, then as n becomes larger, the sampling distribution of the mean approaches the normal distribution, regardless of the shape of the population distribution. 6 Central Limit Theorem
  • 7.
    The standard errorof the mean measures the degree of accuracy of the sample mean as an estimate of the population mean. It is also known as the standard deviation of the sampling distribution of the sample mean, denoted by sample mean. 7 Standard Error of the Mean
  • 8.
    Given a die,it has 6 faces in which each faces have either dot/s of x = 1, 2, 3, 4, 5, and 6. 8 Example: 1. Compute the population mean 2. Compute the population variance 3. Compute the population standard deviation 4. Illustrate the probability histogram of the sampling distribution of the mean.
  • 9.
    9 1. Compute thepopulation mean. µ = ∑x N where: 𝜇 − population mean 𝛴 x − sum of all data in terms of x N − population size µ = ∑𝒙 𝑵 = 1+2+3+4+5+6 6 = 21 6 = 3.5
  • 10.
    10 2. Compute thepopulation variance. X (X-𝜇) 1 2 3 4 5 6 N=6 1-3.5 = -2.5 2-3.5 = -1.5 5-3.5 = 1.5 4-3.5 = 0.5 6-3.5 = 2.5 3-3.5 = -0.5
  • 11.
    11 3. Compute thepopulation standard deviation X (X-𝜇) (X- 𝜇)² 1 1-3.5 = -2.5 2 2-3.5 = -1.5 3 3-3.5 = -0.5 4 4-3.5 = 0.5 5 5-3.5 = 1.5 6 6-3.5 = 2.5 N=6 (2.5)² = 6.25 (0.5)² = 0.25 (1.5)² = 2.25 (2.5)² = 6.25 (-1.5)² = 2.25 (-0.5)² = 0.25 𝛴 (x -𝜇)² = 17.5
  • 12.
    12 X (X-𝜇) (X-𝜇)² P(X) 1 1-3.5 = -2.5 (2.5)² = 6.25 2 2-3.5 = -1.5 (-1.5)² = 2.25 3 3-3.5 = -0.5 (-0.5)²= 0.25 4 4-3.5 = 0.5 (0.5)² = 0.25 5 5-3.5 = 1.5 (1.5)² = 2.25 6 6-3.5 = 2.5 (2.5)²= 6.25 N=6 𝛴 (x -𝜇)² = 17.5 1/6 1/6 1/6 1/6 1/6 1/6
  • 13.
    13 𝛔𝟐 = ∑ 𝐗 −µ 𝟐 𝒏 Population variance = 17.5 6 ≈ 𝟐. 𝟗𝟐 𝛔 = 𝛔𝟐 Population standard deviation = 2.92 ≈ 𝟏. 𝟕𝟏
  • 14.
    14 The population meanand sampling distribution means are both equal which is 3.5. It has a variance of approximately 2.92 and a standard deviation of approximately 1.71. Since all samples have the same probability of 1/6. The trend of the histogram is like a flat line horizontally.
  • 15.
    Consider a populationof Senior High School consisting of the values 2, 4, 6, 8, 10 and 12. 15 Problem: 1. Compute the population mean 2. Compute the population variance 3. Compute the population standard deviation 4. Illustrate the probability histogram of the sampling distribution of the mean.
  • 16.
    16 1. Compute thepopulation mean. µ = ∑x N where: 𝜇 − population mean 𝛴 x − sum of all data in terms of x N − population size µ = ∑𝒙 𝑵 = 2+3+6+9+10+12 6 = 42 6 = 7
  • 17.
    17 2. Compute thepopulation variance. X (X-𝜇) 2 2 - 7 = - 5 4 4 - 7 = - 3 6 6 - 7 = - 1 8 8 - 7 = 1 10 10 - 7= 3 12 12 - 7 = 5 N=42
  • 18.
    18 3. Compute thepopulation standard deviation X (X-𝜇) (X- 𝜇)² 2 2 - 7 = - 5 (-5)² = 25 4 4 - 7 = - 3 (-3)² = 9 6 6 - 7 = - 1 (- 1)²= 1 8 8 - 7 = 1 (1)² = 1 10 10 - 7= 3 (3)² = 9 12 12 - 7 = 5 (5)²= 25 N=42 𝛴 (x -𝜇)² = 70
  • 19.
    19 X (X-𝜇) (X-𝜇)² P(X) 2 2 - 7 = - 5 (-5)² = 25 4 4 - 7 = - 3 (-3)² = 9 6 6 - 7 = - 1 (- 1)²= 1 8 8 - 7 = 1 (1)² = 1 10 10 - 7= 3 (3)² = 9 12 12 - 7 = 5 (5)²= 25 N=42 𝛴 (x -𝜇)² = 70 1/6 1/6 1/6 1/6 1/6 1/6
  • 20.
    20 𝛔𝟐 = ∑ 𝐗 −µ 𝟐 𝒏 Population variance = 70 6 ≈ 𝟏𝟏. 𝟔𝟕 𝛔 = 𝛔𝟐 Population standard deviation = 11.67 ≈ 𝟑. 𝟒𝟐
  • 21.
    21 The population meanand sampling distribution means are both equal which is 7. It has a variance of approximately 11.67 and a standard deviation of approximately 3.42. Since all samples have the same probability of 1/6. The trend of the histogram is like a flat line horizontally.
  • 22.
    Consider a populationof Delfin Albano consisting of the values 5, 10, 15, 20, 25, 30, 35 and 40. 22 Problem: 1. Compute the population mean 2. Compute the population variance 3. Compute the population standard deviation 4. Illustrate the probability histogram of the sampling distribution of the mean.
  • 23.
    23 1. Compute thepopulation mean. µ = ∑x N where: 𝜇 − population mean 𝛴 x − sum of all data in terms of x N − population size µ = ∑𝒙 𝑵 = 5+10+15+20+25+30+35+40 6 = 180 10 = 18
  • 24.
    24 X (X-𝜇) (X-𝜇)² P(X) 5 5 - 8 = - 3 (-3)² = 9 10 10 - 8 = 2 (2)² = 4 15 15 - 8 = 7 (-7)²= 49 20 20 - 8 = 12 (12)² = 144 25 25 - 8= 17 (17)² = 289 30 30 - 8 = 22 (22)²= 484 35 35 – 8 = 27 (27)² = 729 40 40 – 8 =32 (32)² =1,024 N=180 𝛴 (x -𝜇)² = 2732 1/8 1/8 1/8 1/8 1/8 1/8 1/8 1/8
  • 25.
    25 𝛔𝟐 = ∑ 𝐗 −µ 𝟐 𝒏 Population variance = 2732 8 ≈ 𝟑𝟒𝟏. 𝟓 𝛔 = 𝛔𝟐 Population standard deviation = 341.5 ≈ 𝟏𝟖. 𝟒𝟖
  • 26.
    26 X (X-𝜇) (X-𝜇)² P(X) 10 15 25 34 43 56 ASSIGNMENT:
  • 27.
  • 28.
  • 29.
    If the standarddeviation is used as an estimator of population parameter instead of the mean, then the standard error (SE) is: 29 Standard Error 𝑺𝑬 = 𝝈𝒙 𝟐 = 𝝈 𝒏
  • 30.
    The transformation ofthe z – score considering the standard error is: 30 z – transformation 𝒛 = 𝒙 − 𝝁 𝝈 𝒏
  • 31.
    The formula forthe z – score when working with the sample mean is given by 31 𝒛 = 𝒙 − 𝝁 𝝈 𝒏 Theorem 3-3 𝒏 = sample size 𝒙 = sample mean 𝝁= population mean 𝝈 = population standard deviation
  • 32.
    32 REMEMBER The distribution isapproximately normal if 𝒏 ≥ 𝟑𝟎 regardless of the shape of distribution. If 𝐧 ≤ 𝟑𝟎 , the sample mean 𝒙 is also approximately normal as long as the population is normally distributed.
  • 33.
    Population Variance isgiven The formula for the sampling distribution of a normal population if the population variance is given is 𝒛 = 𝒙 − 𝝁 𝝈 𝒏 33
  • 34.
    EXAMPLE 1: Theaverage time it takes a group of CCSASHS students to complete a Statistics test is 54.8 minutes. The standard deviation is 5 minutes. We shall assume that the data are normally distributed. If there are 50 randomly selected students. What is the probability that the mean time it takes the group to finish the test will be less than 53 minutes?
  • 35.
    35 𝑛 = 50𝒙 = 53 𝝁 = 54.8 𝝈 = 5 1. Identify the given
  • 36.
    36 2. Identify whatis asked P( 𝑥˂ 53)
  • 37.
    37 3. Identify theformula 𝒛 = 𝒙 − 𝝁 𝝈 𝒏
  • 38.
    38 4. Solution tothe problem 𝒛 = 𝒙 − 𝝁 𝝈 𝒏 = 53 − 54.8 5 50 = −𝟐. 𝟓𝟓 = −1.8 0.707 or .0054 or 54%
  • 39.
  • 40.
  • 41.
    41 6. State yourfinal answer The probability that 50 randomly selected students will finish the test in less than 53 minutes is 0.54%
  • 42.
    EXAMPLE 2: Supposethe average age of the family members is 34 with a standard deviation of 4. If 100 members of the community decided to have a summer outing bonding and relaxation. Find the probability that the average of these member/s is less than 35?
  • 43.
    43 𝑛 = 100𝒙 = 35 𝝁 = 34 𝝈 = 4 1. Identify the given
  • 44.
    44 2. Identify whatis asked P( 𝑥˂ 35)
  • 45.
    45 3. Identify theformula 𝒛 = 𝒙 − 𝝁 𝝈 𝒏
  • 46.
    46 4. Solution tothe problem 𝒛 = 𝒙 − 𝝁 𝝈 𝒏 = 35 − 34 4 100 = 1 0.4 = 2.5 or 0.9938 or 99.38 %
  • 47.
  • 48.
  • 49.
    49 6. State yourfinal answer The probability that the random sample of 100 persons has an average of fewer than 35 years old is 0.9938 0r 99.38%
  • 50.
    EXAMPLE 3: Themean time it takes a group of senior high students to complete a certain examination is 50.6 minutes. The standard deviation is 6 minutes. Assume that the variable is normally distributed. If 49 randomly selected senior high school students take the examination, what is the probability that the mean time it takes the group to complete the test is between 47.8 and 53
  • 51.
    51 𝒏 = 49𝒙 = 47.8 𝑎𝑛𝑑 53 𝝁 = 50.6 𝝈 = 6 1. Identify the given
  • 52.
    52 2. Identify whatis asked P( 47.8 < 𝑥 < 53)
  • 53.
    53 3. Identify theformula 𝒛 = 𝒙 − 𝝁 𝝈 𝒏
  • 54.
    54 4. Solution tothe problem 𝒛 = 𝒙 − 𝝁 𝝈 𝒏 = 47.8 − 50.6 6 49 = -3.27 = −2.8 0.857 P(𝑥 >47.8) = P(𝑧 > - 3.27) =0.0005 4.a
  • 55.
    55 4. Solution tothe problem 𝒛 = 𝒙 − 𝝁 𝝈 𝒏 = 53 − 50.6 6 49 = 2.8 = 2.4 0.857 P(𝑥 <53) = P(z > 2.8) =0.9974 4.b
  • 56.
  • 57.
  • 58.
    58 6. State yourfinal answer The probability that 49 randomly selected senior high school students will complete the test between 47.8 and 53 minutes is 99.69%
  • 59.
    PROBLEM: The averagetime it takes a group of Senior High School students to complete a certain examination is 48.2 minutes. The standard deviation is 7 minutes. Assume that the variable is normally distributed. 1. If 40 randomly selected SHS student take the examination, what is the probability that the mean it takes the group to complete the test will be less than 45 minutes??
  • 60.
    60 𝒏 = 40,𝒙 = 45, 𝝁 = 48.2,𝝈 = 7 1. Identify the given 2. Identify what is asked P( 𝑥˂ 45) 3. Identify the formula 𝒛 = 𝒙 − 𝝁 𝝈 𝒏
  • 61.
    𝒛 = 𝒙 −𝝁 𝝈 𝒏 61 4. Solution to the problem = 45 − 48.2 7 40 = - 2.89 = −3.2 7 40 2.9 .0019 .00 .0019 or 19% |
  • 62.
    62 5. Illustrate 6. Stateyour final answer The probability that 40 randomly selected SHS students will complete the test in less than 45 minutes is 0.0019 or 0.19%
  • 63.
    PROBLEM: An investigatorof a case of food poisoning found that the amount of salmonella in every serving of food is normally distributed with an average of 3.7 colony forming units per (cfu/g) and a standard deviation of 1.19 cfu/g. 1. What is the probability that a selected serving has at least 4.2 cfu/g of salmonella?
  • 64.
    64 𝒏 = 1, 𝒙= 42 𝑐𝑓𝑢 𝑔 , 𝝁 = 3.7 𝑐𝑓𝑢 𝑔 𝝈 = 1.19 𝑐𝑓𝑢 𝑔 1. Identify the given 2. Identify what is asked P( 𝑥 ≥ 4.2) 3. Identify the formula 𝒛 = 𝒙 − 𝝁 𝝈 𝒏
  • 65.
    𝒛 = 𝒙 −𝝁 𝝈 𝒏 65 4. Solution to the problem = 4.2 − 3.7 1.19 1 = 𝟎. 𝟒𝟐 = 0.5 1.19 1 0.4 .02 .6628 .6628 or 66.28%
  • 66.
    66 5. Illustrate 6. Stateyour final answer The probability that a selected serving has at least 4.2 cfu/g of salmonella is 33.72%.
  • 67.
    PROBLEM: An investigatorof a case of food poisoning found that the amount of salmonella in every serving of food is normally distributed with an average of 3.7 colony forming units per (cfu/g) and a standard deviation of 1.19 cfu/g. 1. What is the probability that a selected serving has at least 4.2 cfu/g of salmonella? 2. What is the probability that the mean of 10 randomly selected servings is at least 4.2 cfu/g? ASSIGNMENT:
  • 68.
    𝝁 = 3.7 𝑐𝑓𝑢 𝑔 68 Given:𝒙 = 4.2 𝑐𝑓𝑢 𝑔 𝝈 = 1.19 𝑐𝑓𝑢 𝑔 𝒛 = 𝒙 − 𝝁 𝝈 𝒏 = 4.2 − 3.7 1.19 10 = 1.33 = 𝟎. 𝟎𝟗𝟏𝟖 𝒐𝒓 𝟗. 𝟏𝟖% 𝑛 = 10, = 0.5 0.3763 𝐴1.33 = 0.9082 ∴ 𝑃 𝑋 ≥ 1.33 = 1 − 0.9082 The probability that ten serving has at least 4.2 cfu/g of salmonella is 9.18% 𝟏. 𝟑𝟑 1.3 .03 .9082
  • 69.
    69 𝝈𝒙 = 𝝈 𝒏 𝝈𝒙= 𝟏. 𝟏𝟗 𝟏𝟎 = 0.376 𝝈𝒙 = 𝟏. 𝟏𝟗 𝟏 = 1.19 Lower standard deviation Higher standard deviation
  • 70.
    70 Urphone Company claimsthat the life of their battery products is approximately normally distributed with a mean length of 8 hours of battery life when used in DC motors, with a standard deviation of 3.8 hours. What is the probability that a 10 batteries will have a mean lifespan of less than 6 hours in DC motors? 8 3.8 10 6
  • 71.
    The probability thatthe sample of 10 batteries will have a mean lifespan of less than 6 hours is 4.85% 71 Given: 𝑛 = 10, 𝝈 = 3.8 𝝁 =8, 𝒙 = 𝟔, 𝒛 = 𝒙 − 𝝁 𝝈 𝒏 = 6 − 8 3.8 10 = −2 1.2017 = −1.66 .0485 =.0485 -1.6 .06 0.0485 𝑜𝑟 4.85% −𝟏. 𝟔𝟔
  • 72.
    72 Activity 1 Solvethe following problems 1. The average production of all the machines in a fabrication is 15 finished materials in one hour with a standard deviation of 3 materials per hour. What is the probability that the sample of 5 machines will produce more than 17 materials per hour? 1. Identify the given 2. Identify what is asked 4. Solution to the problem 3. Identify the formula 5. Illustrate 6. State your final answer
  • 73.
    73 2. The average ratingof a public high school students in a certain division of region II is 85% with a standard deviation of 3. a) If a student is selected, what is the probability that his average rating is greater than 80% b) If a random sample of 20 senior high school students is selected, what is the probability that the average rating is less than 80%? 1. Identify the given 2. Identify what is asked 4. Solution to the problem 3. Identify the formula 5. Illustrate 6. State your final answer
  • 74.
    74 Source: Statistics &Probability Book DepEd Module Thank you! Disclaimer: This video lesson is created for educational purposes only. No copyright claim Keep safe everyone!
  • 75.
  • 76.
    Z - Table (Negative )
  • 77.
    Z - Table (Positive )

Editor's Notes

  • #5 This theorem is called the Central Limit Theorem which will be formally stated later For the variance of sampling distribution of a sample we use this formula, And for the standard deviation of sampling distribution of the sample mean is:
  • #6 Using the formula of variance of sampling distribution of a sample and standard deviation of sampling distribution of the sample mean, substitute the given values for the appropriate variables in the formula. Then, we solve for sample variance and sample standard deviation. Therefore, the variance is 2.5 and the standard deviation is 1.58.
  • #10 We get the population mean using the formula Therefore, we have: = 1+2+3+4+5+6 6 = 21 6 = 3.5
  • #11 To solve for the population variance, subtract each data to the population mean
  • #12 Just square the data of population mean.
  • #13 what is the probability of each data?
  • #15 For further understanding, slide
  • #16 To test if you really understand the lesson, let’s have an activity. Now, I want you to form a group. Okay class, go to your groups. Please take note! You’ll be given 5 minutes to answer the given task. Points will be given to the group that correctly answer the question. Are you all set? I will group you into 6 groups. You can 1-6 repeatedly.
  • #23 To test if you really understand the lesson, let’s have an activity. Now, I want you to form a group. Okay class, go to your groups. Please take note! You’ll be given 5 minutes to answer the given task. Points will be given to the group that correctly answer the question. Are you all set? I will group you into 6 groups. You can 1-6 repeatedly.
  • #29 This is the continuation of our lesson yesterday.
  • #30 The concept of the standard error of the mean is very significant, since it measures the degree of accuracy of the sample mean as an estimate of population mean. There is a good estimate if the standard error is small or close to zero and a poor estimate if it is large. The value of the standard error depends mainly on the sample size n. Specifically, as n increases, 𝜎𝑥̅ decreases. The most remarkable theorem in statistical inference is the Central Limit Theorem which assures that no matter what the shape of the population distribution is, the sampling distribution of the mean is closely normally distributed whenever n is large. This fact holds true for sample sizes greater than or equal to 30
  • #34 The formula for the sampling distribution of a normal population if the population variance is given is the same as finding for the value of Z under the central limit theorem.
  • #36 n= sample size X= sample mean U= population mean 0= population standard deviation
  • #37 Since we are finding the probability for 50 students to finish the test at 53 minutes, so therefore what is asked in the problem is the Probability of x less than 53
  • #38 X= sample mean U= population mean O= population standard deviation n = sample size
  • #39 0.7071067811865
  • #40 Using the z-table, the corresponding are of -2.55 is .0054
  • #44 n= sample size X= sample mean U= population mean 0= population standard deviation
  • #45 Since we are finding the probability for 100 members of the community decided to have a summer outing bonding and relaxation with average of less than 35. so therefore what is asked in the problem is the Probability of x less than 35
  • #46 X= sample mean U= population mean O= population standard deviation n = sample size
  • #48 Using the z-table, the corresponding area of 2.5 is .9938
  • #50 Since we are finding the probability for 50 students to finish the test at 53 minutes, so therefore what is asked in the problem is the Probability of x less than 53
  • #52 Since we are finding the probability for 50 students to finish the test at 53 minutes, so therefore what is asked in the problem is the Probability of x less than 53
  • #53 Since we are finding the probability fo r49 randomly selected senior high school students to complete the test is between 47.8 and 53 minutes?, so therefore what is asked in the problem is the probability that the sample mean (𝑥̅) falls between 47.8 and 53. the probability that the sample mean (𝑥̅) is between 47.8 and 53."
  • #54 X= sample mean U= population mean O= population standard deviation n = sample size
  • #55 Find P(𝑋̅ > 47.8) by getting the area under the normal curve. P(𝑥̅> 47.8) = P(z > - 3.27) = 0.0005
  • #56 Find P(𝑋̅ > 47.8) by getting the area under the normal curve. P(𝑥̅> 47.8) = P(z > - 3.27) = 0.0005
  • #57 Using the z-table, the corresponding area of 2.5 is .9938
  • #59 Since we are finding the probability for 50 students to finish the test at 53 minutes, so therefore what is asked in the problem is the Probability of x less than 53
  • #62 1.106797181
  • #69 ASSIGNMENT NILA
  • #71 QUIZ NILA