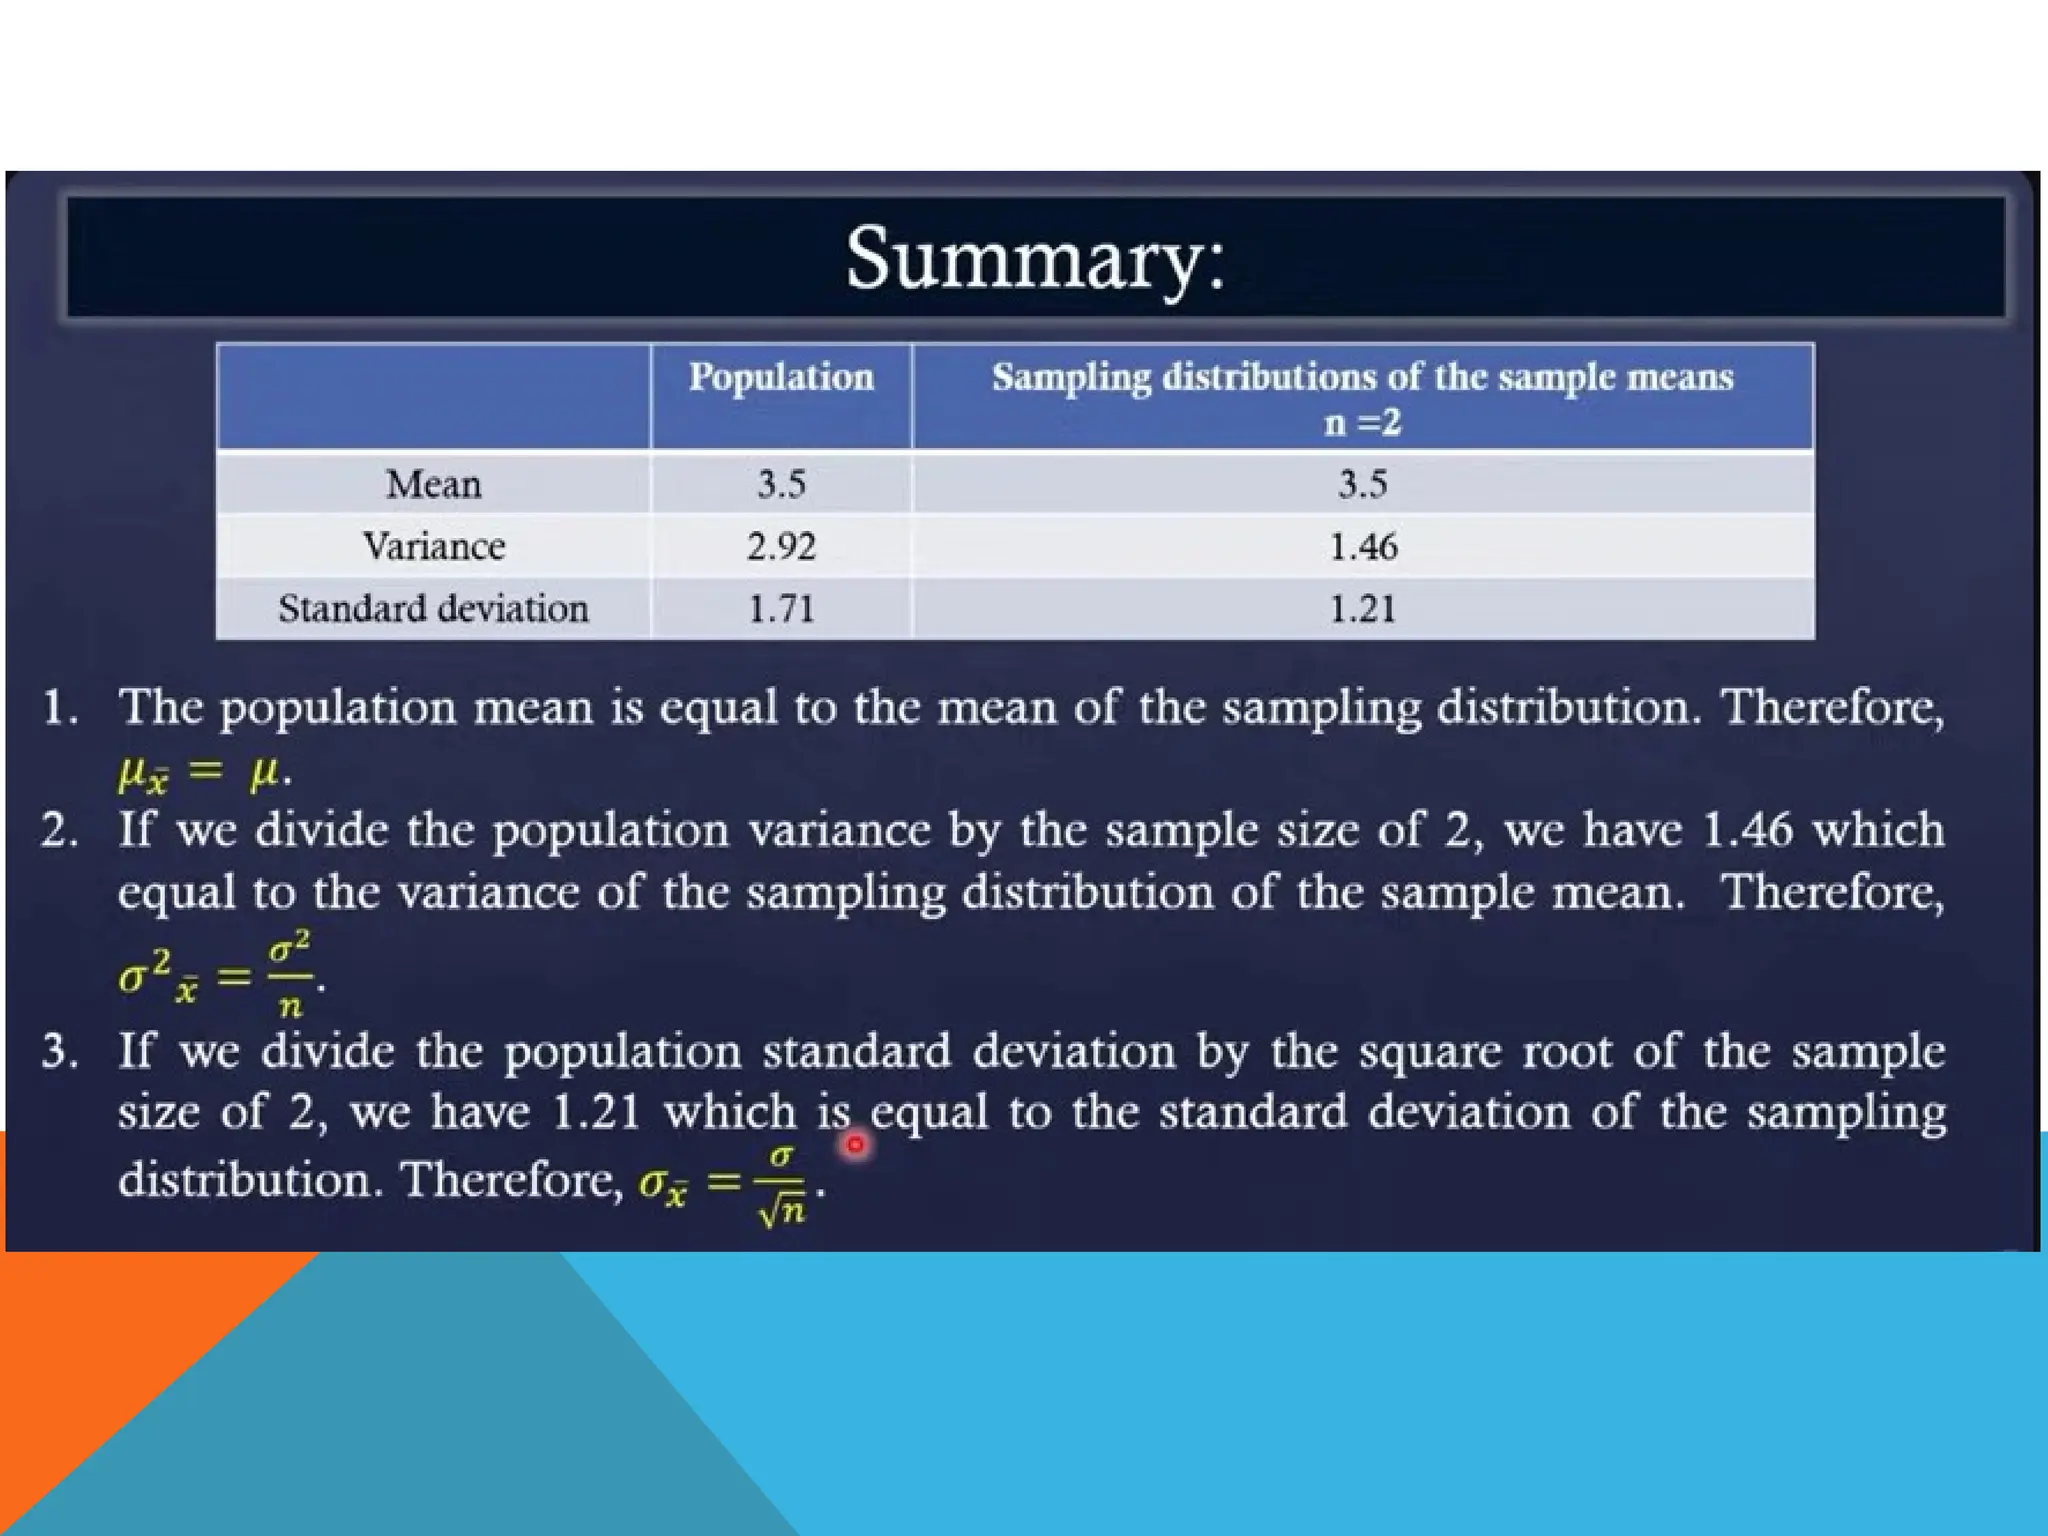
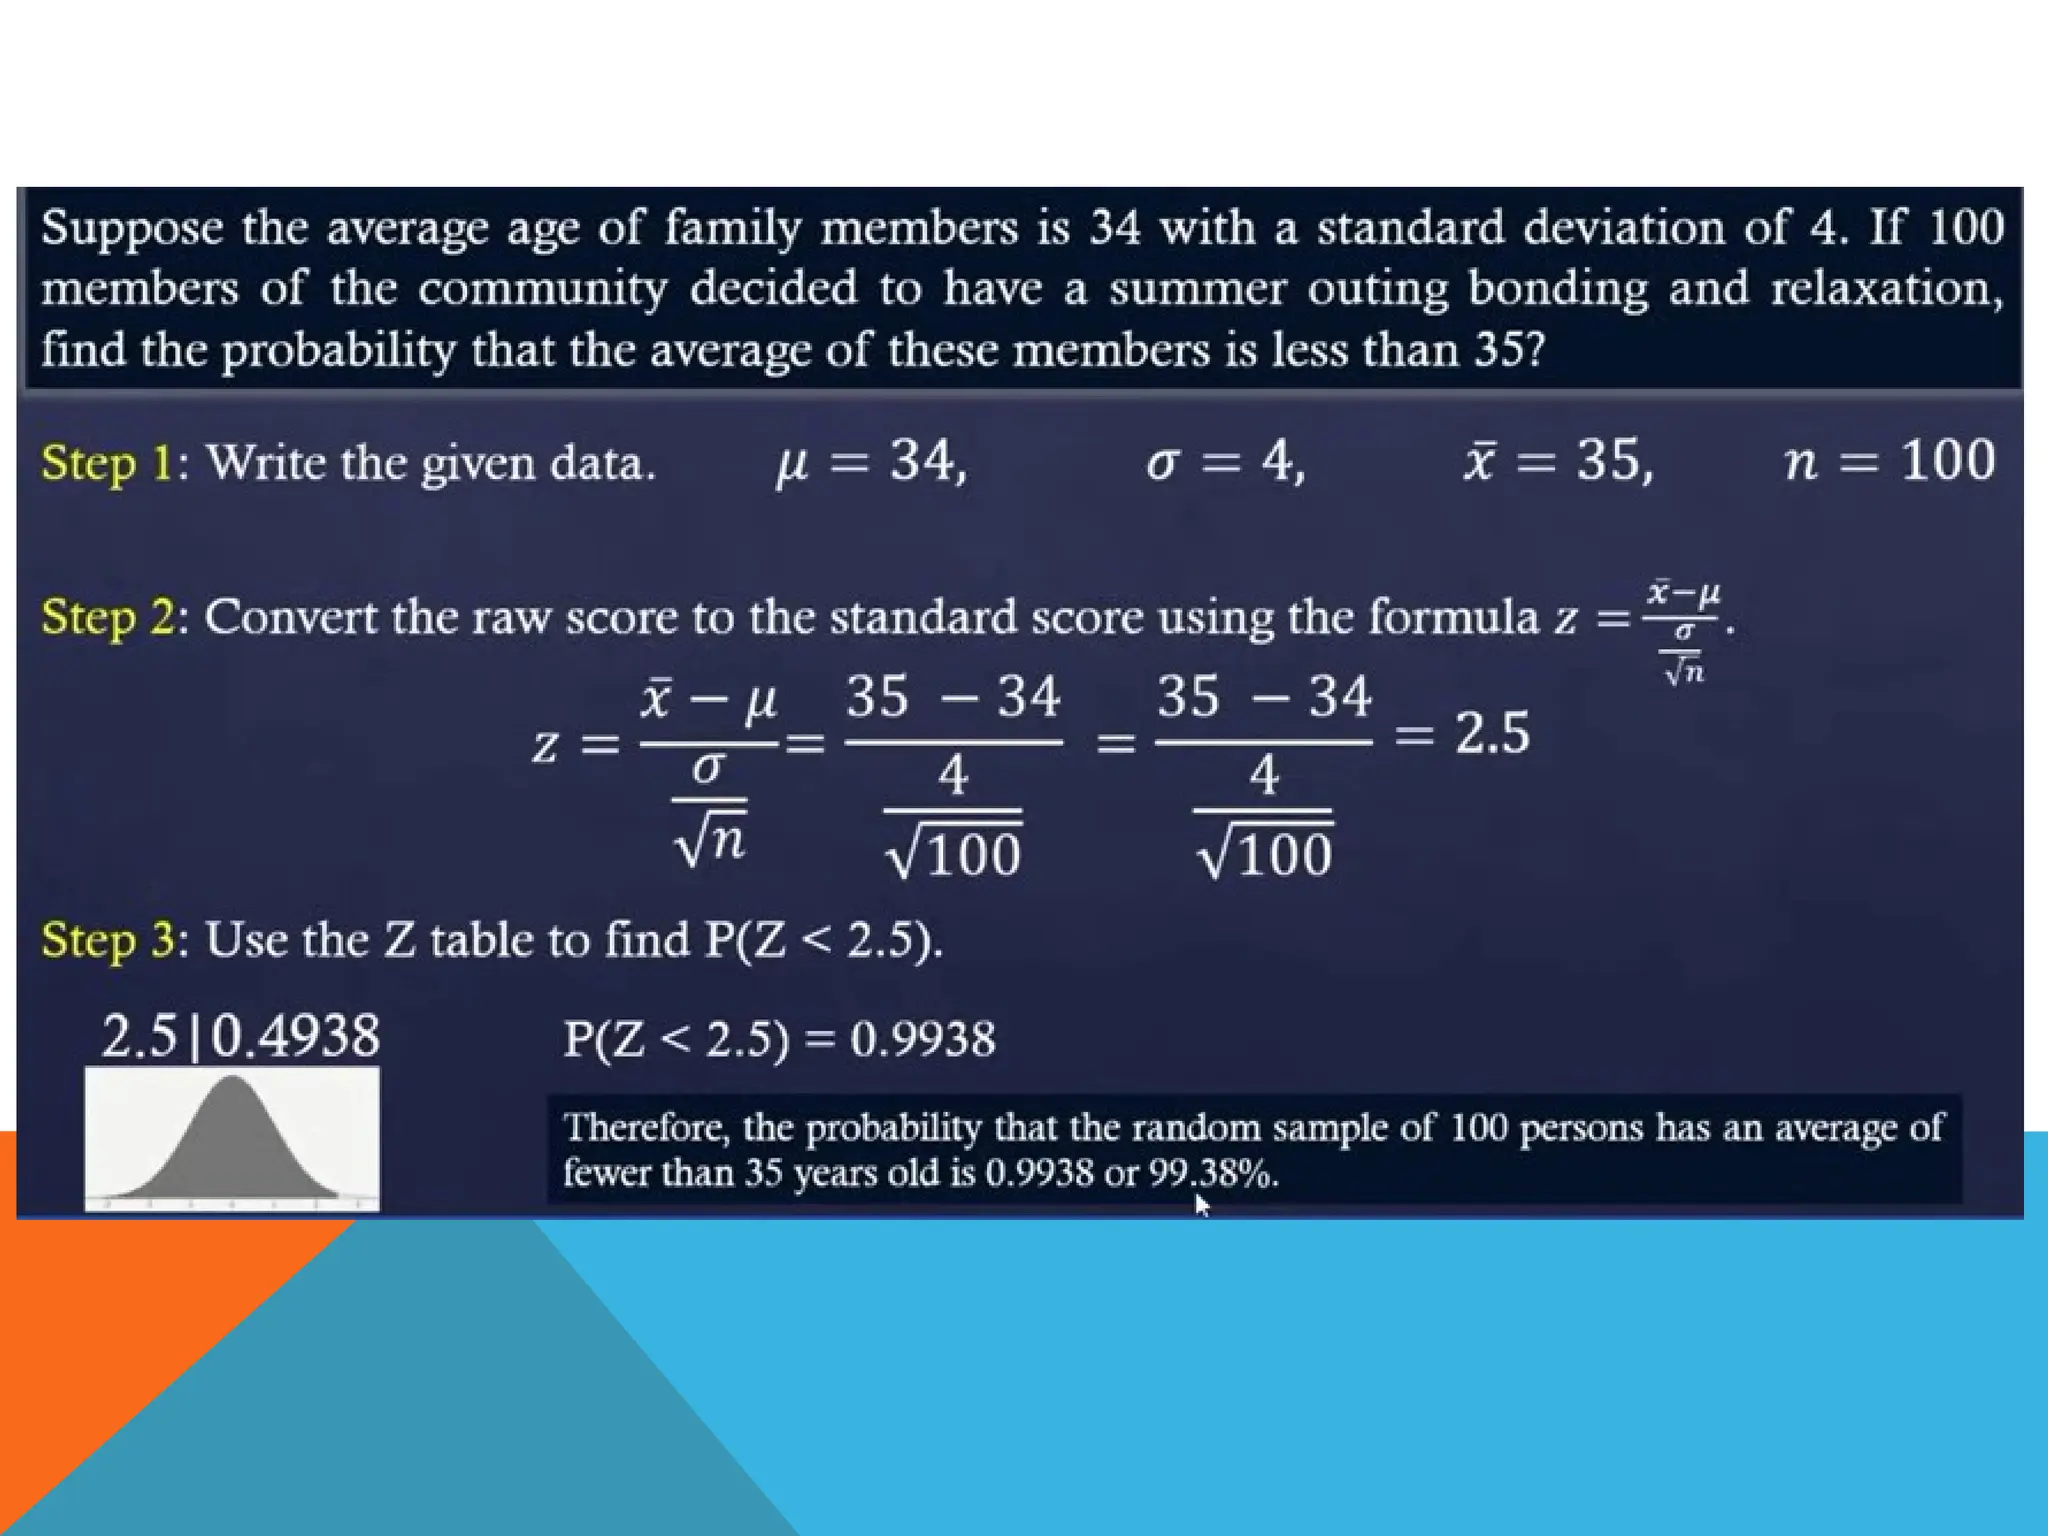
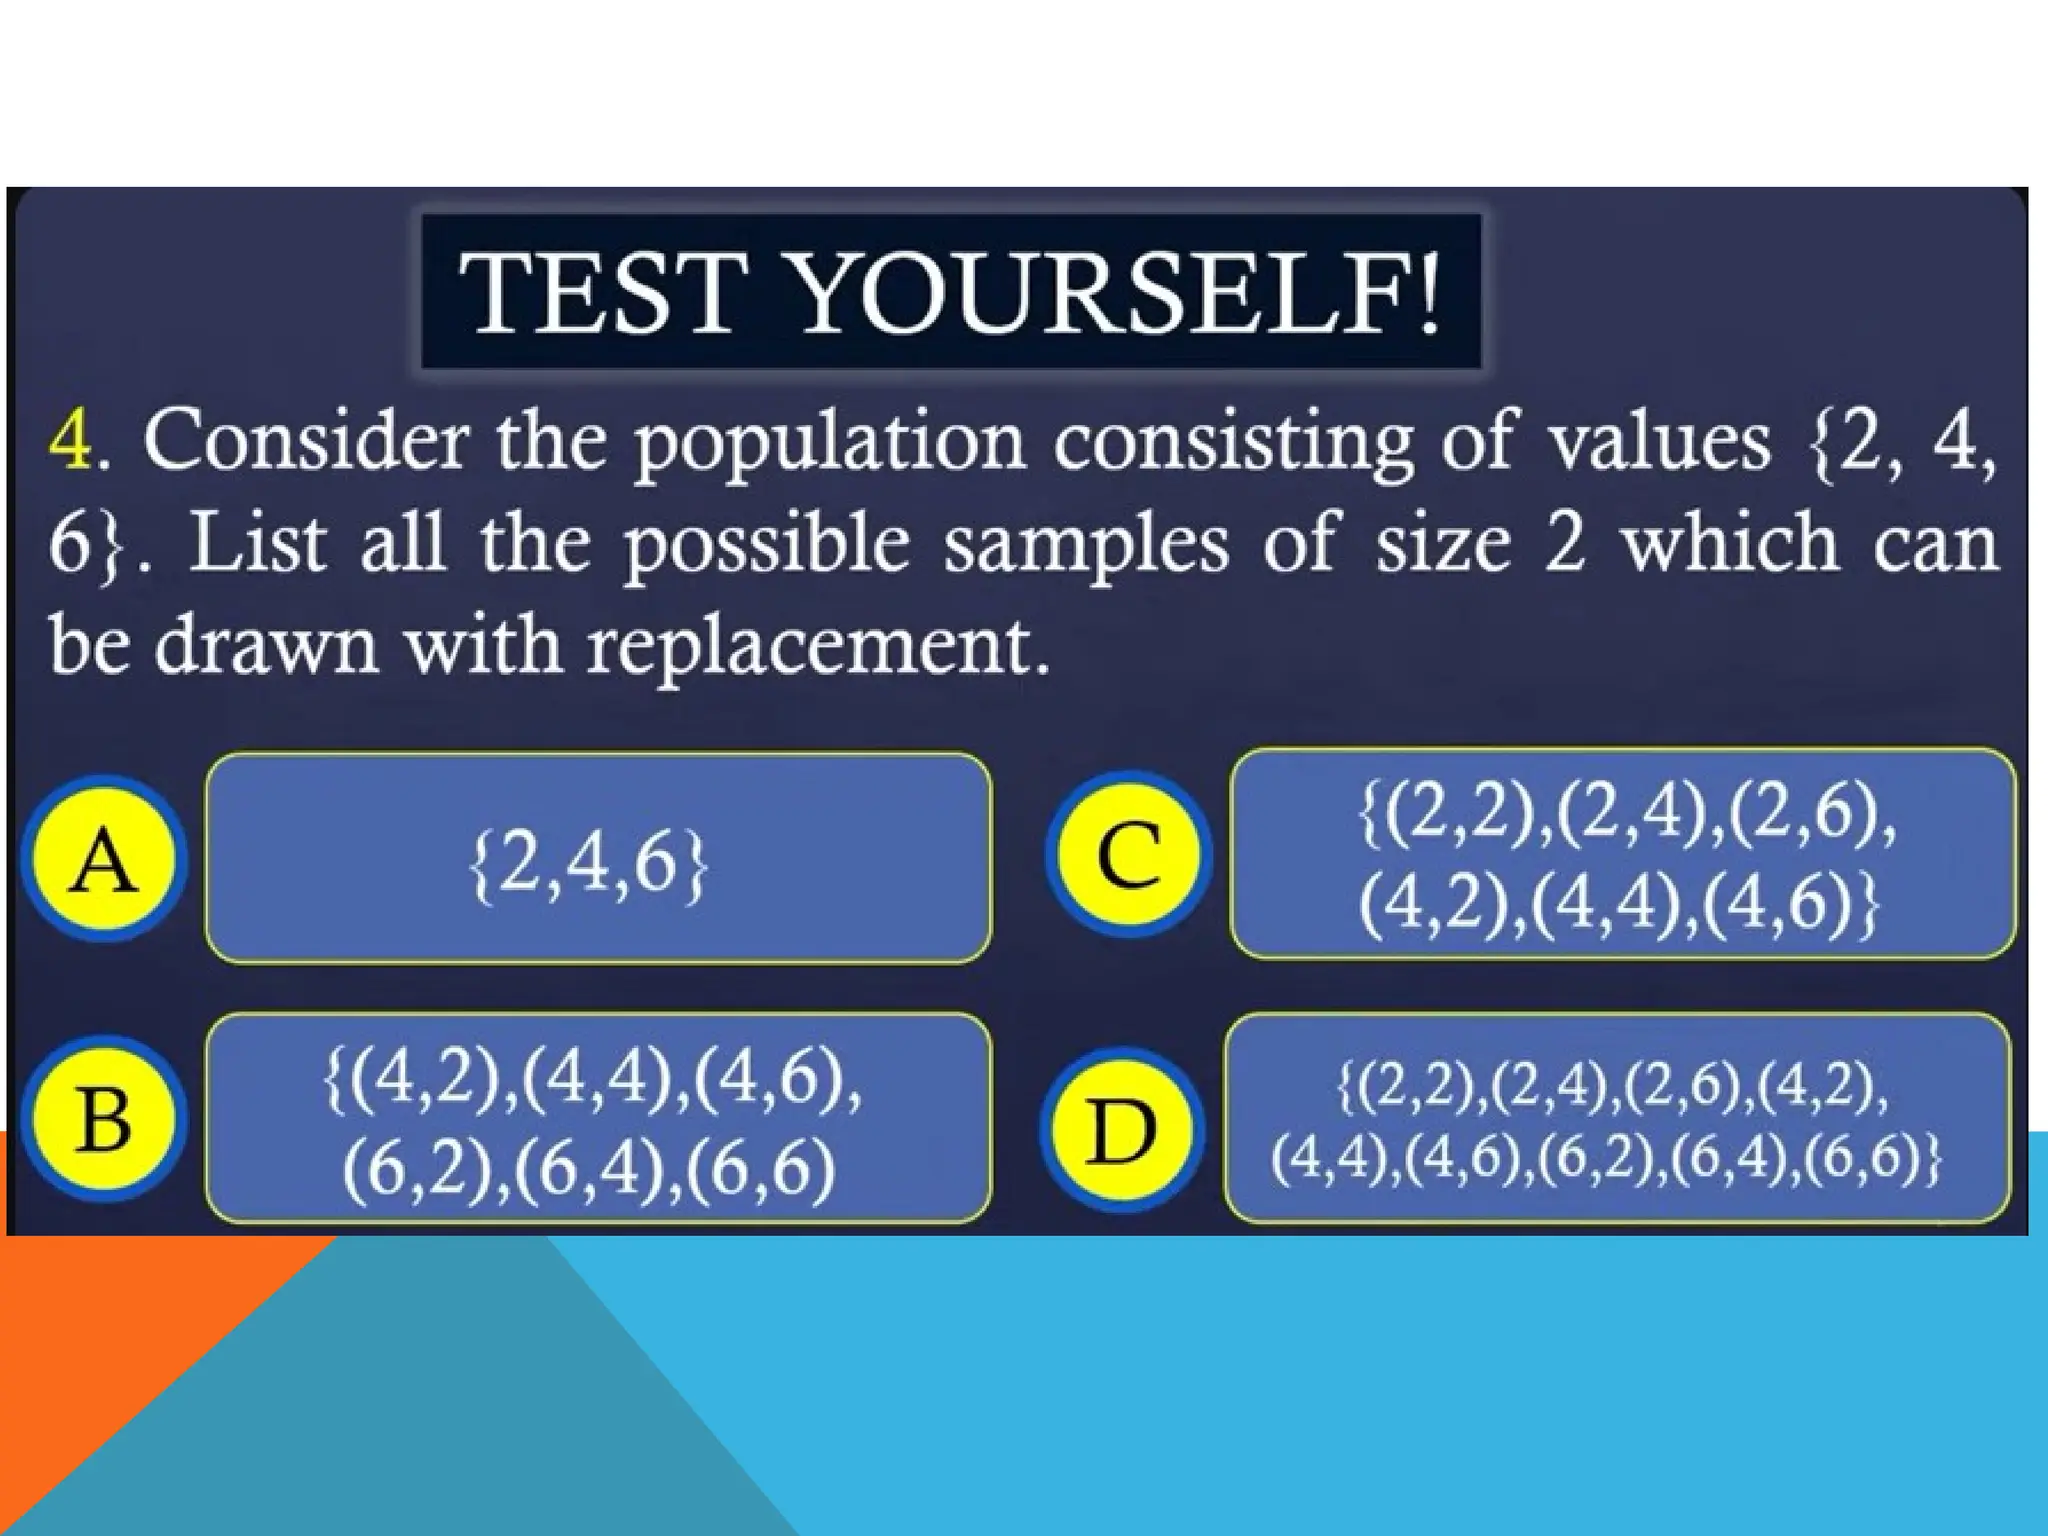
CEN
TRAL
LIM
IT
TH
EO
REM
SPECIFIC OBJECTIVES
At the end of the lesson, the students should be
able to:
1. Illustrates the Central Limit Theorem. M11/12SP-IIIe-
2
2. Defines the sampling distribution of the sample mean
using the Central Limit Theorem. M11/12SP-III-3
3. Solves problems involving sampling distributions of
the sample mean. M11SP-IIIe-f-1
CENTRAL LIMIT THEOREM
If random samples of size n are drawn
from a population, then as n becomes larger, the
sampling distribution of the mean approaches
the normal distribution, regardless of the shape
of the population distribution.
ILLUSTRATING CENTRAL LIMIT THEOREM
Given a die, it has 6 faces in which each face has
either dot/s of x= 1,2,3,4,5 and 6. Compute the
following:
1. Population mean
2. Population variance
3. Population standard deviation
4. Draw the probability histogram of the sampling
distribution of the means.
COMPUTE THE POPULATION MEAN
µ
COMPUTE THE POPULATION VARIANCE
= 2.92
𝝈𝟐
=𝜮 ¿¿
COMPUTE THE POPULATION STANDARD
DEVIATION
σ =
σ =
σ =
σ = 1.71
CONSTRUCT THE HISTOGRAM
PROBABILITY
SAMPLE MEAN
Given a die, it has 6 faces in which each face has
either dot/s of x= 1,2,3,4,5 and 6. Given it as
population, consider the samples of size n = 2.
Compute the following:
1.Mean of the sampling distribution of the sample
mean.
2.Variance of the sampling distribution of the sample
mean.
3.Standard deviation of the sampling distribution of
the sample mean.
4.Illustrate the probability histogram of the sample
distribution of the mean.
1,1 3,1
1,2 3,2
1,3 3,3
1,4 3,4
1,5 3,5
1,6 3,6
2,1 4,1
2,2 4,2
2,3 4,3
2,4 4,4
2,5 4,5
2,6 4,6
5,1
5,2
5,3
5,4
5,5
5,6
6,1
6,2
6,3
6,4
6,5
6,6
X = 1,2,3,4,5 and 6, n=2
POSSIBLE SAMPLE
COMPUTE THE MEAN OF THE SAMPLING DISTRIBUTION OF THE SAMPLE MEAN
COMPUTE THE VARIANCE OF THE SAMPLING DISTRIBUTION OF THE SAMPLE MEAN.
COMPUTE THE STANDARD DEVIATION OF THE SAMPLING DISTRIBUTION OF THE
SAMPLE MEAN..
https://www.youtube.com/watch?v=Sq_XTpslmMI&list=PPSV
WOW MATH
REFERENCES:

CENTRAL LIMIT THEOREM.pptx ccccccccccccc

  • 1.
  • 2.
    SPECIFIC OBJECTIVES At theend of the lesson, the students should be able to: 1. Illustrates the Central Limit Theorem. M11/12SP-IIIe- 2 2. Defines the sampling distribution of the sample mean using the Central Limit Theorem. M11/12SP-III-3 3. Solves problems involving sampling distributions of the sample mean. M11SP-IIIe-f-1
  • 3.
    CENTRAL LIMIT THEOREM Ifrandom samples of size n are drawn from a population, then as n becomes larger, the sampling distribution of the mean approaches the normal distribution, regardless of the shape of the population distribution.
  • 4.
    ILLUSTRATING CENTRAL LIMITTHEOREM Given a die, it has 6 faces in which each face has either dot/s of x= 1,2,3,4,5 and 6. Compute the following: 1. Population mean 2. Population variance 3. Population standard deviation 4. Draw the probability histogram of the sampling distribution of the means.
  • 5.
    COMPUTE THE POPULATIONMEAN µ COMPUTE THE POPULATION VARIANCE = 2.92 𝝈𝟐 =𝜮 ¿¿
  • 6.
    COMPUTE THE POPULATIONSTANDARD DEVIATION σ = σ = σ = σ = 1.71
  • 7.
  • 8.
    Given a die,it has 6 faces in which each face has either dot/s of x= 1,2,3,4,5 and 6. Given it as population, consider the samples of size n = 2. Compute the following: 1.Mean of the sampling distribution of the sample mean. 2.Variance of the sampling distribution of the sample mean. 3.Standard deviation of the sampling distribution of the sample mean. 4.Illustrate the probability histogram of the sample distribution of the mean.
  • 9.
    1,1 3,1 1,2 3,2 1,33,3 1,4 3,4 1,5 3,5 1,6 3,6 2,1 4,1 2,2 4,2 2,3 4,3 2,4 4,4 2,5 4,5 2,6 4,6 5,1 5,2 5,3 5,4 5,5 5,6 6,1 6,2 6,3 6,4 6,5 6,6 X = 1,2,3,4,5 and 6, n=2 POSSIBLE SAMPLE
  • 11.
    COMPUTE THE MEANOF THE SAMPLING DISTRIBUTION OF THE SAMPLE MEAN COMPUTE THE VARIANCE OF THE SAMPLING DISTRIBUTION OF THE SAMPLE MEAN. COMPUTE THE STANDARD DEVIATION OF THE SAMPLING DISTRIBUTION OF THE SAMPLE MEAN..
  • 23.