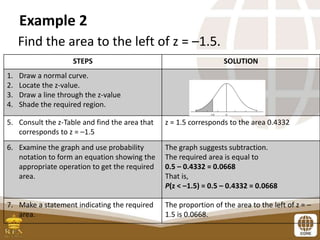
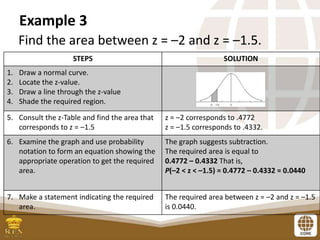
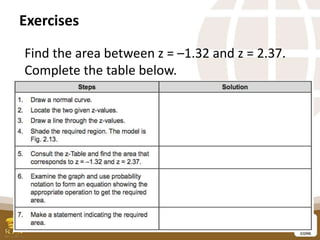
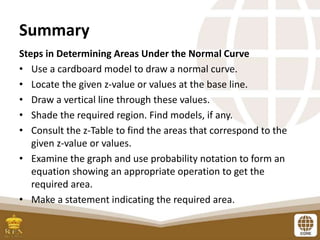
DETERMINING PROBABILITIES
Lesson Objectives
At the end of this lesson, you are expected to:
1. find areas between paired z-scores;
2. find probabilities for the standard normal
random variable z; and
3. express areas under the normal curve using
probability notation.
Pre-Assessment
Lesson Introduction
• Standard normal distribution is a normal
distribution with μ = 0 and σ = 1. A random
variable with a standard normal distribution,
denoted by X, is called a standard normal random
variable.
• Probabilities associated with the standard normal
random variables can be shown as areas under
the standard normal curve.
Discussion Points
Probability Notations Under the Normal Curve
The following notations for a random variable are used in
our various solutions concerning the normal curve.
• 𝑃 𝑎 < 𝑧 < 𝑏 denotes the probability that the z-score is
between a and b.
• 𝑃 𝑧 > 𝑎 denotes the probability that the z-score is
greater than a.
• 𝑃(𝑧 < 𝑎) denotes the probability that the z-score is less
than a.
where a and b are z-score values.
Discussion Points
To find the area of the region between z = 1
and z = 2, we subtract .3413 from .4772
resulting in .1359. It is graphically shown
below.
Discussion Points
The regions under the normal curve in terms
of percent, the graph of the distribution
would look like this:
Discussion Points
Case 1: The required area, as depicted by the shaded
regions under the curve in figure 2.8 and 2.9, are:
‘greater than z’
‘at least z’
‘more than z’
‘to the right of z’
‘above z’
Case 2: The required area is:
‘less than z’
‘at most z’
‘not more than z’
‘not greater than z’
‘to the left of z’
Case 3: Models when the required area is
𝒃𝒆𝒕𝒘𝒆𝒆𝒏 𝑧1 𝑎𝑛𝑑 𝑧2:
Example 1
Find the proportion of the area above z = –1.
STEPS SOLUTION
1. Draw a normal curve.
2. Locate the z-value.
3. Draw a line through the z-value
4. Shade the required region.
5. Consult the z-Table and find the area that
corresponds to z = –1.
z = –1 corresponds to an area of .3413
6. Examine the graph and use probability
notation to form an equation showing
the appropriate operation to get the
required area.
The graph suggests addition.
The required area is equal to
0.3413 + 0.5 = 0.8413.
That is,
P(z > –1) = 0.3413 + 0.5 = 0.8413
7. Make a statement indicating the required
area.
The proportion of the area above is .8413.
Example 2
Find the area to the left of z = –1.5.
STEPS SOLUTION
1. Draw a normal curve.
2. Locate the z-value.
3. Draw a line through the z-value
4. Shade the required region.
5. Consult the z-Table and find the area that
corresponds to z = –1.5
z = 1.5 corresponds to the area 0.4332
6. Examine the graph and use probability
notation to form an equation showing the
appropriate operation to get the required
area.
The graph suggests subtraction.
The required area is equal to
0.5 – 0.4332 = 0.0668
That is,
P(z < –1.5) = 0.5 – 0.4332 = 0.0668
7. Make a statement indicating the required
area.
The proportion of the area to the left of z = –
1.5 is 0.0668.
Example 3
Find the area between z = –2 and z = –1.5.
STEPS SOLUTION
1. Draw a normal curve.
2. Locate the z-value.
3. Draw a line through the z-value
4. Shade the required region.
5. Consult the z-Table and find the area that
corresponds to z = –1.5
z = –2 corresponds to .4772
z = –1.5 corresponds to .4332.
6. Examine the graph and use probability
notation to form an equation showing the
appropriate operation to get the required
area.
The graph suggests subtraction.
The required area is equal to
0.4772 – 0.4332 That is,
P(–2 < z < –1.5) = 0.4772 – 0.4332 = 0.0440
7. Make a statement indicating the required
area.
The required area between z = –2 and z = –1.5
is 0.0440.
Exercise 1
1. Find the area greater than 𝑧 = 1
2. Find the area above 𝑧 = 1.5
3. Find the area between 𝑧 = 0.98 𝑎𝑛𝑑 𝑧 = 2.58
4. Find the area between 𝑧 = −1.32 𝑎𝑛𝑑 𝑧 = 2.37
Exercises
Find the area between z = –1.32 and z = 2.37.
Complete the table below.
Problem Solving:
1. A brisk walk at 4 miles per hour burns an average of 300 calories
per hour.If the standard deviation of the distribution is 8 calories,
find the probability that a person who walks one hour at the rate of
4 miles per hour will burn the following calories. Assume the
variable to be normally distributed.
a) more than 280 calories c) between 278 and 318 calories
b) less than 294 calories
2. If the systolic blood pressure for a certain group of obese people
has a mean of 132 and a standard deviation of 8, find the
probability that a randomly selected person will have the following
blood pressure. Assume the variable is normally distributed.
a. above 130 b. below 140 c. between 131 and 136
3. For a medical study, a researcher wishes to select people in the
middle of 40% of the population based on blood pressure. If the
mean systolic blood pressure is 120 and the standard deviation is
8, find the upper and lower reading that would qualify people to
participate in the study.
4. If the scores for the test have a mean of 100 and a standard
deviation of 15, find the percentage of scores that will fall below
115.
The Central Limit Theorem
The Central Limit Theorem states that if you take sufficiently large samples
from a population, the samples’ means will be normally distributed, even if the
population isn’t normally distributed.
It states further that as the sample size increases, the shape of the distribution
of the sample means taken from a population with mean µ and standard
deviation σ will approach a normal distribution. This distribution will have mean
µ and a standard deviation
σ
𝑛
.
The Central Limit Theorem can be used to answer questions about sample
means in the same manner that the normal distribution can be used to answer
about individual values. There is a new formula to be used for the z values:
z =
𝒙 − µ
σ
𝒏
where ; 𝒙 is the sample mean and
σ
𝑛
is the standard deviation
It is important to remember two things when using the central limit theorem:
1. When the original variable is normally distributed, the distribution of the
sample means will be normally distributed, for any sample size n.
2. When the distribution of the original variable departs from normality, a sample
size of 30 or more is needed to use the normal distribution to approximate the
distribution of the sample means. The larger the sample, the better the
approximation will be.
Sample problems where CLT is applied:
1. The mean serum cholesterol of a large population of overweight adults is
220 mg/dl and the standard deviation is 16.3 mg/dl. If a sample of 30 adults is
selected, find the probability that the mean will be between 220 and 222 mg/dl.
2. The average age of accountants is 43 years, and with a standard deviation of 5
years. If an accountant firm employs 30 accountants, find the probability that the
average age of the group is greater than 44.2 years old.
3. The average annual precipitation for a certain city is 30.83
inches, with a standard deviation of 5 inches. If a random sample
of 10 years is selected, find the probability that the mean will be
between 32 and 33 inches. Assume that the variable is normally
distributed.
4. The mean weight of a 20-year-old females is 126 pounds and
the standard deviation is 15.7. If a sample of 25 females is
selected, find the probability that the mean of the sample will be
greater than 128.3 pounds. Assume that the variable is normally
distributed.
Solve the following problems. Show complete solutions.
1. The average life of a brand of automobile tires is 30,000 miles, with a standard
deviation of 2,000 miles. If a tire is selected and tested, find the probability that
will have the following lifetime. Assume the variable is normally distributed.
a) between 25,000 and 29,000
2. For a medical study, a researcher wishes to select people in the middle 75% of
the population based on blood pressure. If the mean systolic blood pressure is
120 and the standard deviation is 8, find the upper and lower readings that
would qualify people to participate in the study.
3. The average number of kilos of meat a person consumes in a year is 100 kg.
Assume that the standard deviation is 11 kg and the distribution is approximately
normal.
a. Find the probability that a person selected at random consumes less than 105
kg per year.
b. If a sample of 40 individuals is selected, find the probability that the mean of the
sample will be less than 105 kg per year.
Summary
Steps in Determining Areas Under the Normal Curve
• Use a cardboard model to draw a normal curve.
• Locate the given z-value or values at the base line.
• Draw a vertical line through these values.
• Shade the required region. Find models, if any.
• Consult the z-Table to find the areas that correspond to the
given z-value or values.
• Examine the graph and use probability notation to form an
equation showing an appropriate operation to get the
required area.
• Make a statement indicating the required area.

PSUnit_II_Lesson_4_Determining_Probabilities (1).pptx

  • 1.
  • 2.
    Lesson Objectives At theend of this lesson, you are expected to: 1. find areas between paired z-scores; 2. find probabilities for the standard normal random variable z; and 3. express areas under the normal curve using probability notation.
  • 3.
  • 4.
    Lesson Introduction • Standardnormal distribution is a normal distribution with μ = 0 and σ = 1. A random variable with a standard normal distribution, denoted by X, is called a standard normal random variable. • Probabilities associated with the standard normal random variables can be shown as areas under the standard normal curve.
  • 5.
    Discussion Points Probability NotationsUnder the Normal Curve The following notations for a random variable are used in our various solutions concerning the normal curve. • 𝑃 𝑎 < 𝑧 < 𝑏 denotes the probability that the z-score is between a and b. • 𝑃 𝑧 > 𝑎 denotes the probability that the z-score is greater than a. • 𝑃(𝑧 < 𝑎) denotes the probability that the z-score is less than a. where a and b are z-score values.
  • 6.
    Discussion Points To findthe area of the region between z = 1 and z = 2, we subtract .3413 from .4772 resulting in .1359. It is graphically shown below.
  • 7.
    Discussion Points The regionsunder the normal curve in terms of percent, the graph of the distribution would look like this:
  • 8.
  • 9.
    Case 1: Therequired area, as depicted by the shaded regions under the curve in figure 2.8 and 2.9, are: ‘greater than z’ ‘at least z’ ‘more than z’ ‘to the right of z’ ‘above z’
  • 10.
    Case 2: Therequired area is: ‘less than z’ ‘at most z’ ‘not more than z’ ‘not greater than z’ ‘to the left of z’
  • 11.
    Case 3: Modelswhen the required area is 𝒃𝒆𝒕𝒘𝒆𝒆𝒏 𝑧1 𝑎𝑛𝑑 𝑧2:
  • 12.
    Example 1 Find theproportion of the area above z = –1. STEPS SOLUTION 1. Draw a normal curve. 2. Locate the z-value. 3. Draw a line through the z-value 4. Shade the required region. 5. Consult the z-Table and find the area that corresponds to z = –1. z = –1 corresponds to an area of .3413 6. Examine the graph and use probability notation to form an equation showing the appropriate operation to get the required area. The graph suggests addition. The required area is equal to 0.3413 + 0.5 = 0.8413. That is, P(z > –1) = 0.3413 + 0.5 = 0.8413 7. Make a statement indicating the required area. The proportion of the area above is .8413.
  • 13.
    Example 2 Find thearea to the left of z = –1.5. STEPS SOLUTION 1. Draw a normal curve. 2. Locate the z-value. 3. Draw a line through the z-value 4. Shade the required region. 5. Consult the z-Table and find the area that corresponds to z = –1.5 z = 1.5 corresponds to the area 0.4332 6. Examine the graph and use probability notation to form an equation showing the appropriate operation to get the required area. The graph suggests subtraction. The required area is equal to 0.5 – 0.4332 = 0.0668 That is, P(z < –1.5) = 0.5 – 0.4332 = 0.0668 7. Make a statement indicating the required area. The proportion of the area to the left of z = – 1.5 is 0.0668.
  • 14.
    Example 3 Find thearea between z = –2 and z = –1.5. STEPS SOLUTION 1. Draw a normal curve. 2. Locate the z-value. 3. Draw a line through the z-value 4. Shade the required region. 5. Consult the z-Table and find the area that corresponds to z = –1.5 z = –2 corresponds to .4772 z = –1.5 corresponds to .4332. 6. Examine the graph and use probability notation to form an equation showing the appropriate operation to get the required area. The graph suggests subtraction. The required area is equal to 0.4772 – 0.4332 That is, P(–2 < z < –1.5) = 0.4772 – 0.4332 = 0.0440 7. Make a statement indicating the required area. The required area between z = –2 and z = –1.5 is 0.0440.
  • 15.
    Exercise 1 1. Findthe area greater than 𝑧 = 1 2. Find the area above 𝑧 = 1.5 3. Find the area between 𝑧 = 0.98 𝑎𝑛𝑑 𝑧 = 2.58 4. Find the area between 𝑧 = −1.32 𝑎𝑛𝑑 𝑧 = 2.37
  • 16.
    Exercises Find the areabetween z = –1.32 and z = 2.37. Complete the table below.
  • 17.
    Problem Solving: 1. Abrisk walk at 4 miles per hour burns an average of 300 calories per hour.If the standard deviation of the distribution is 8 calories, find the probability that a person who walks one hour at the rate of 4 miles per hour will burn the following calories. Assume the variable to be normally distributed. a) more than 280 calories c) between 278 and 318 calories b) less than 294 calories 2. If the systolic blood pressure for a certain group of obese people has a mean of 132 and a standard deviation of 8, find the probability that a randomly selected person will have the following blood pressure. Assume the variable is normally distributed. a. above 130 b. below 140 c. between 131 and 136
  • 18.
    3. For amedical study, a researcher wishes to select people in the middle of 40% of the population based on blood pressure. If the mean systolic blood pressure is 120 and the standard deviation is 8, find the upper and lower reading that would qualify people to participate in the study. 4. If the scores for the test have a mean of 100 and a standard deviation of 15, find the percentage of scores that will fall below 115.
  • 19.
    The Central LimitTheorem The Central Limit Theorem states that if you take sufficiently large samples from a population, the samples’ means will be normally distributed, even if the population isn’t normally distributed. It states further that as the sample size increases, the shape of the distribution of the sample means taken from a population with mean µ and standard deviation σ will approach a normal distribution. This distribution will have mean µ and a standard deviation σ 𝑛 . The Central Limit Theorem can be used to answer questions about sample means in the same manner that the normal distribution can be used to answer about individual values. There is a new formula to be used for the z values: z = 𝒙 − µ σ 𝒏 where ; 𝒙 is the sample mean and σ 𝑛 is the standard deviation
  • 20.
    It is importantto remember two things when using the central limit theorem: 1. When the original variable is normally distributed, the distribution of the sample means will be normally distributed, for any sample size n. 2. When the distribution of the original variable departs from normality, a sample size of 30 or more is needed to use the normal distribution to approximate the distribution of the sample means. The larger the sample, the better the approximation will be. Sample problems where CLT is applied: 1. The mean serum cholesterol of a large population of overweight adults is 220 mg/dl and the standard deviation is 16.3 mg/dl. If a sample of 30 adults is selected, find the probability that the mean will be between 220 and 222 mg/dl. 2. The average age of accountants is 43 years, and with a standard deviation of 5 years. If an accountant firm employs 30 accountants, find the probability that the average age of the group is greater than 44.2 years old.
  • 21.
    3. The averageannual precipitation for a certain city is 30.83 inches, with a standard deviation of 5 inches. If a random sample of 10 years is selected, find the probability that the mean will be between 32 and 33 inches. Assume that the variable is normally distributed. 4. The mean weight of a 20-year-old females is 126 pounds and the standard deviation is 15.7. If a sample of 25 females is selected, find the probability that the mean of the sample will be greater than 128.3 pounds. Assume that the variable is normally distributed.
  • 22.
    Solve the followingproblems. Show complete solutions. 1. The average life of a brand of automobile tires is 30,000 miles, with a standard deviation of 2,000 miles. If a tire is selected and tested, find the probability that will have the following lifetime. Assume the variable is normally distributed. a) between 25,000 and 29,000 2. For a medical study, a researcher wishes to select people in the middle 75% of the population based on blood pressure. If the mean systolic blood pressure is 120 and the standard deviation is 8, find the upper and lower readings that would qualify people to participate in the study. 3. The average number of kilos of meat a person consumes in a year is 100 kg. Assume that the standard deviation is 11 kg and the distribution is approximately normal. a. Find the probability that a person selected at random consumes less than 105 kg per year. b. If a sample of 40 individuals is selected, find the probability that the mean of the sample will be less than 105 kg per year.
  • 23.
    Summary Steps in DeterminingAreas Under the Normal Curve • Use a cardboard model to draw a normal curve. • Locate the given z-value or values at the base line. • Draw a vertical line through these values. • Shade the required region. Find models, if any. • Consult the z-Table to find the areas that correspond to the given z-value or values. • Examine the graph and use probability notation to form an equation showing an appropriate operation to get the required area. • Make a statement indicating the required area.