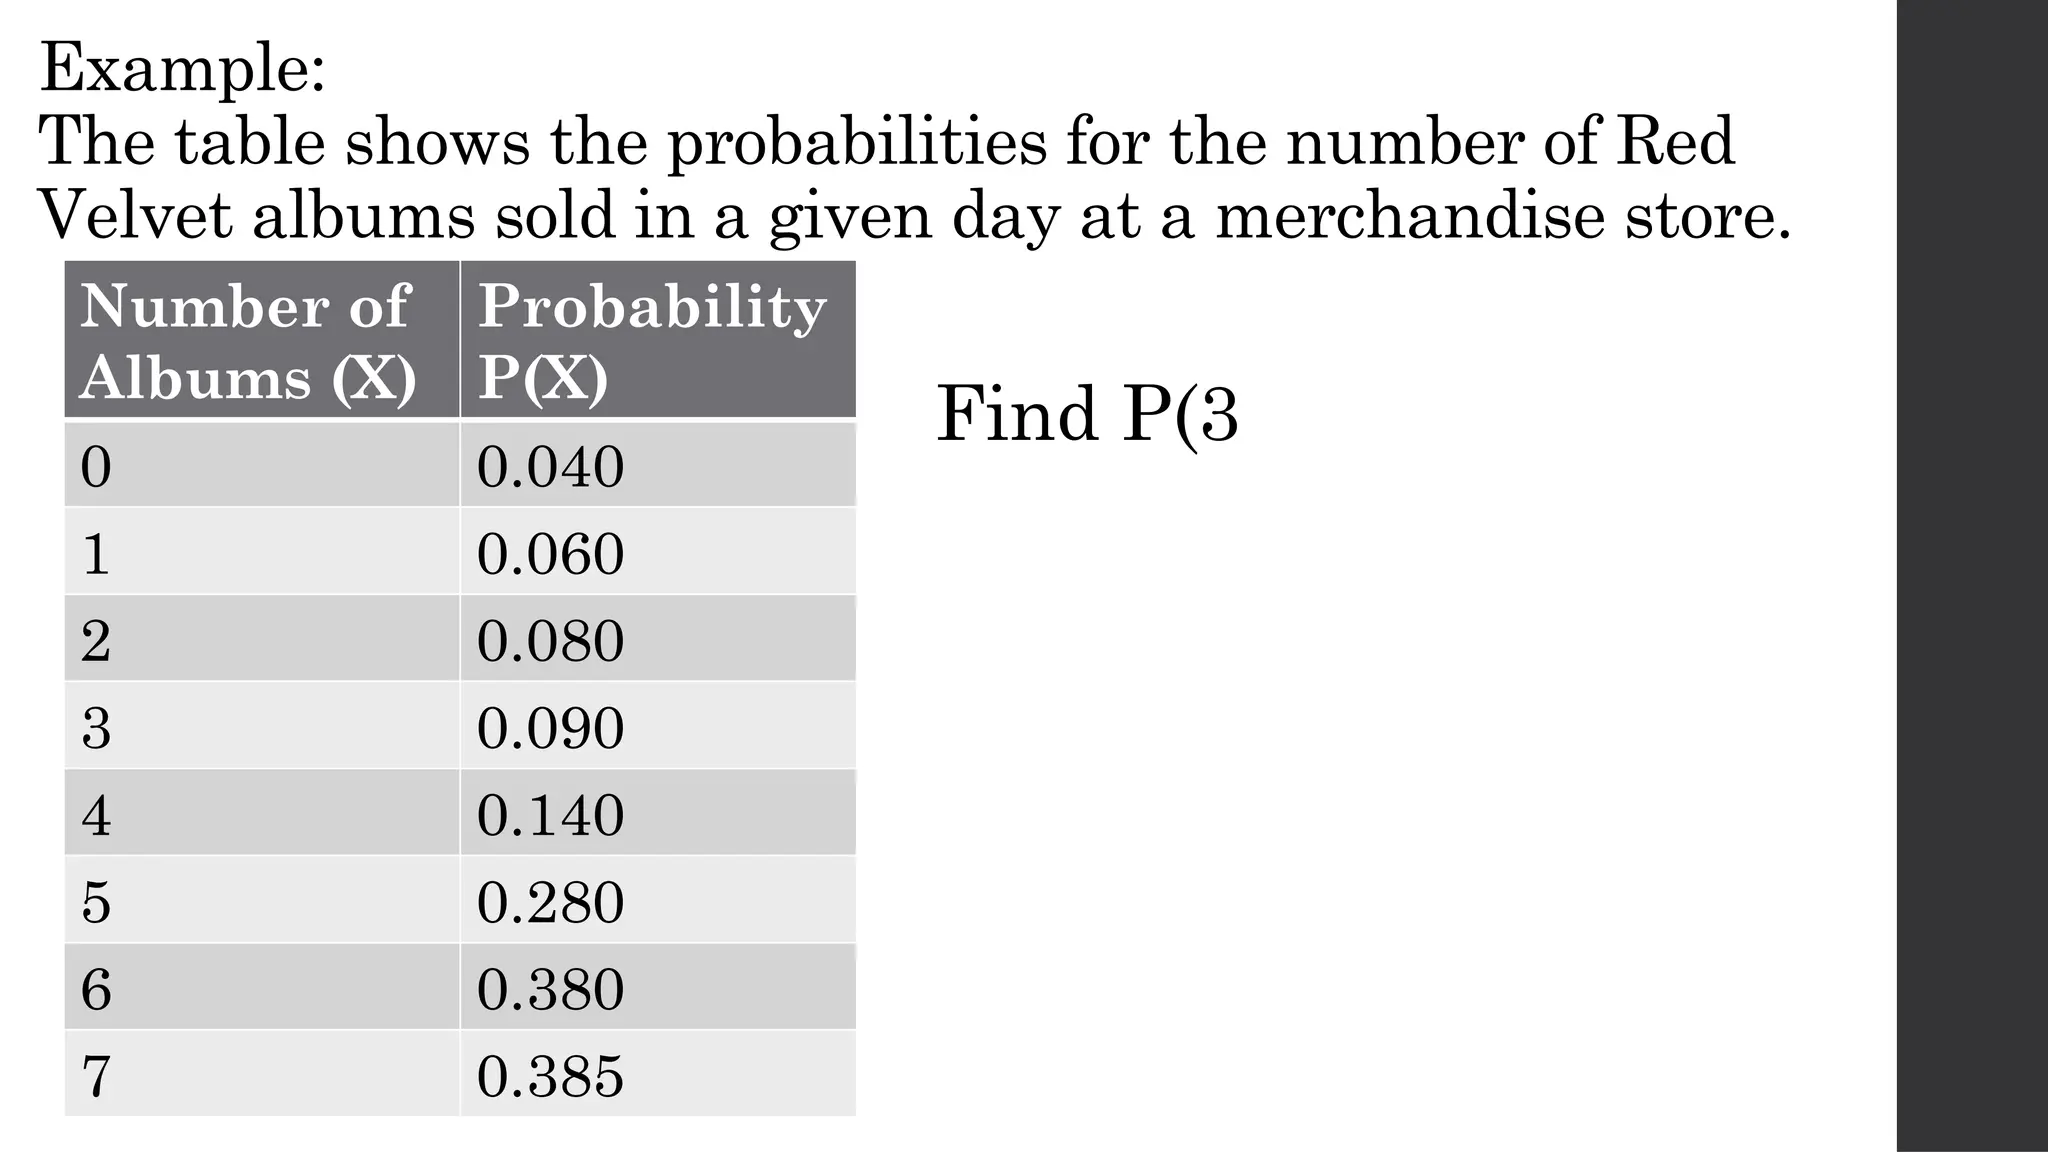
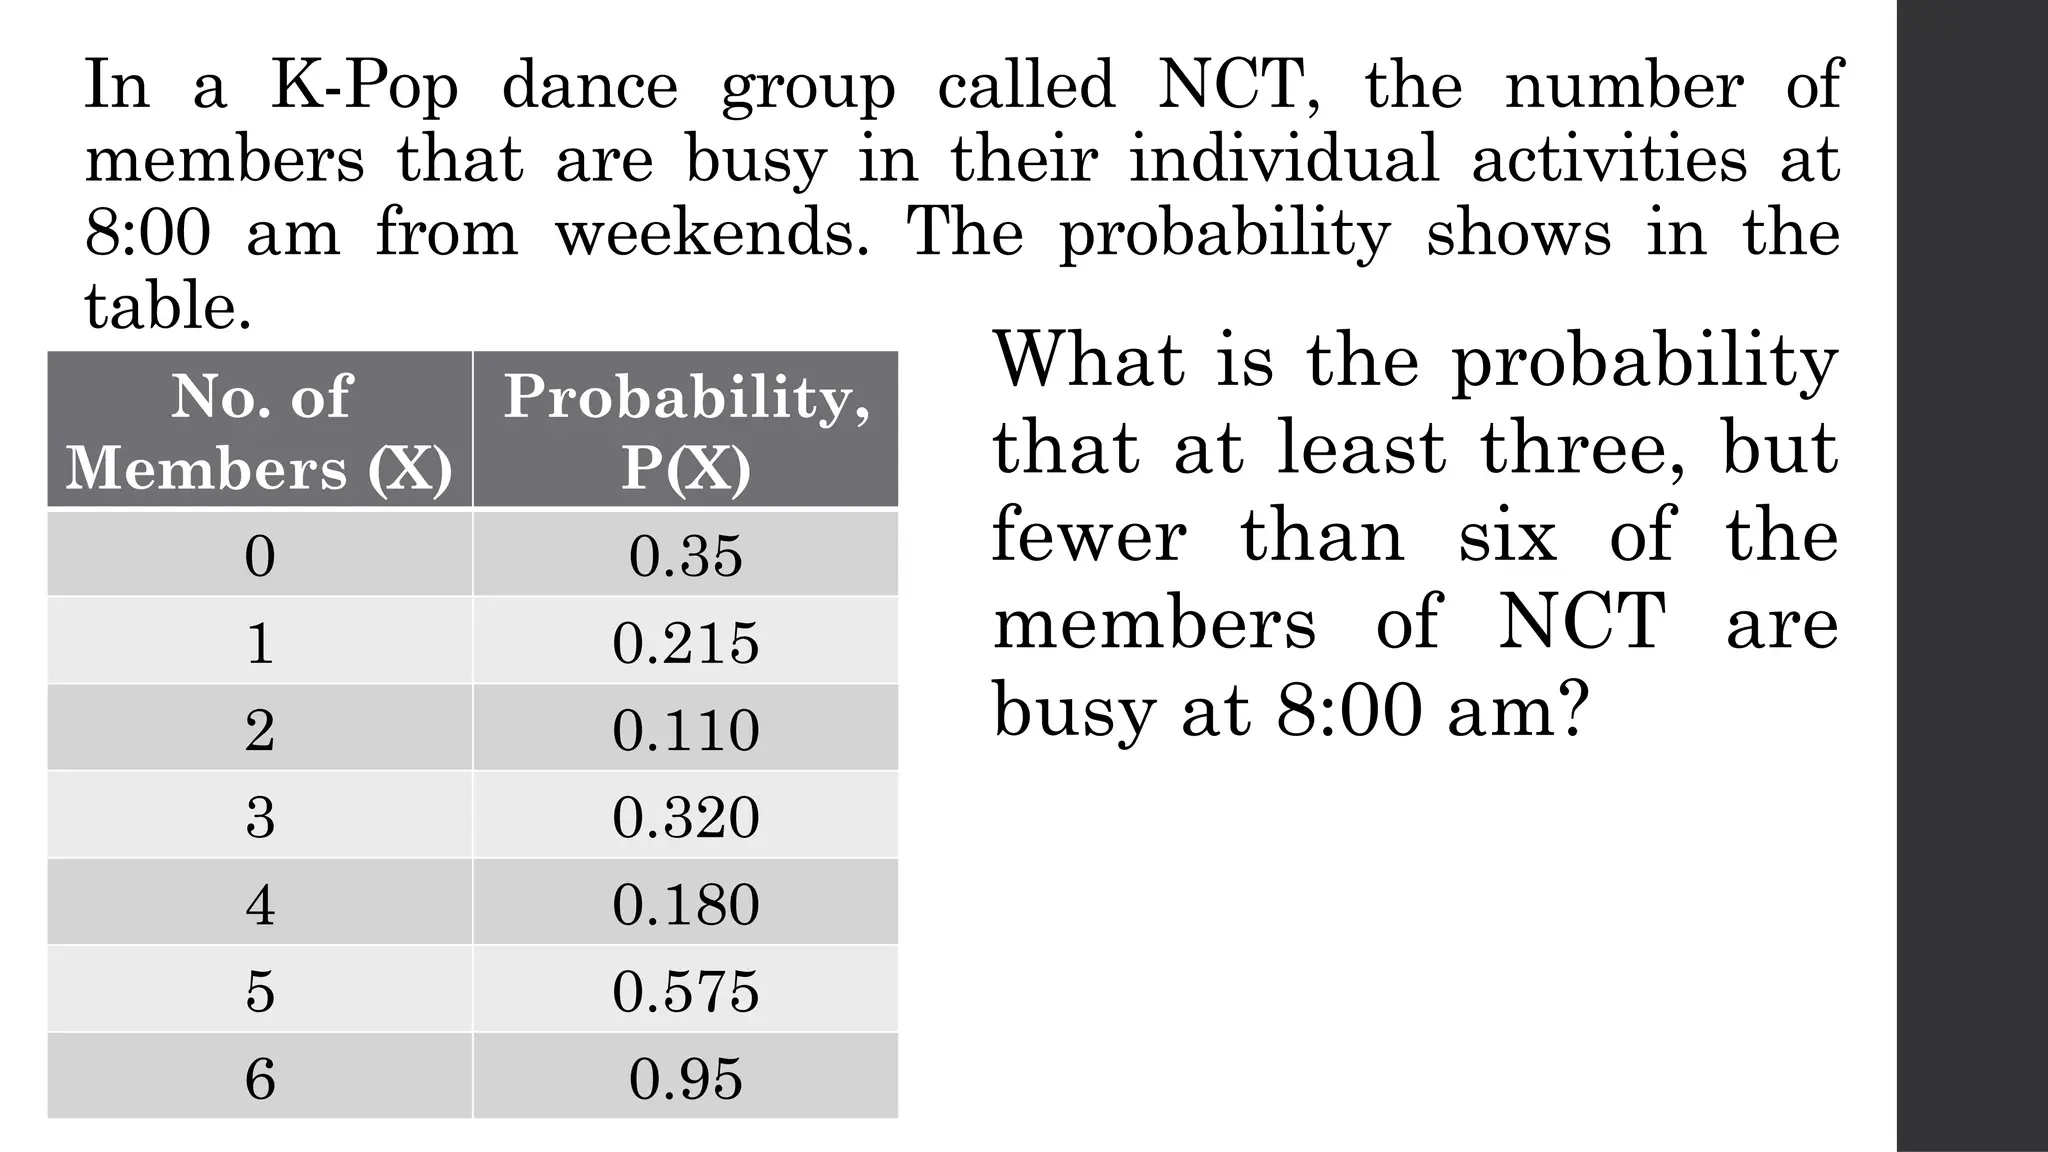
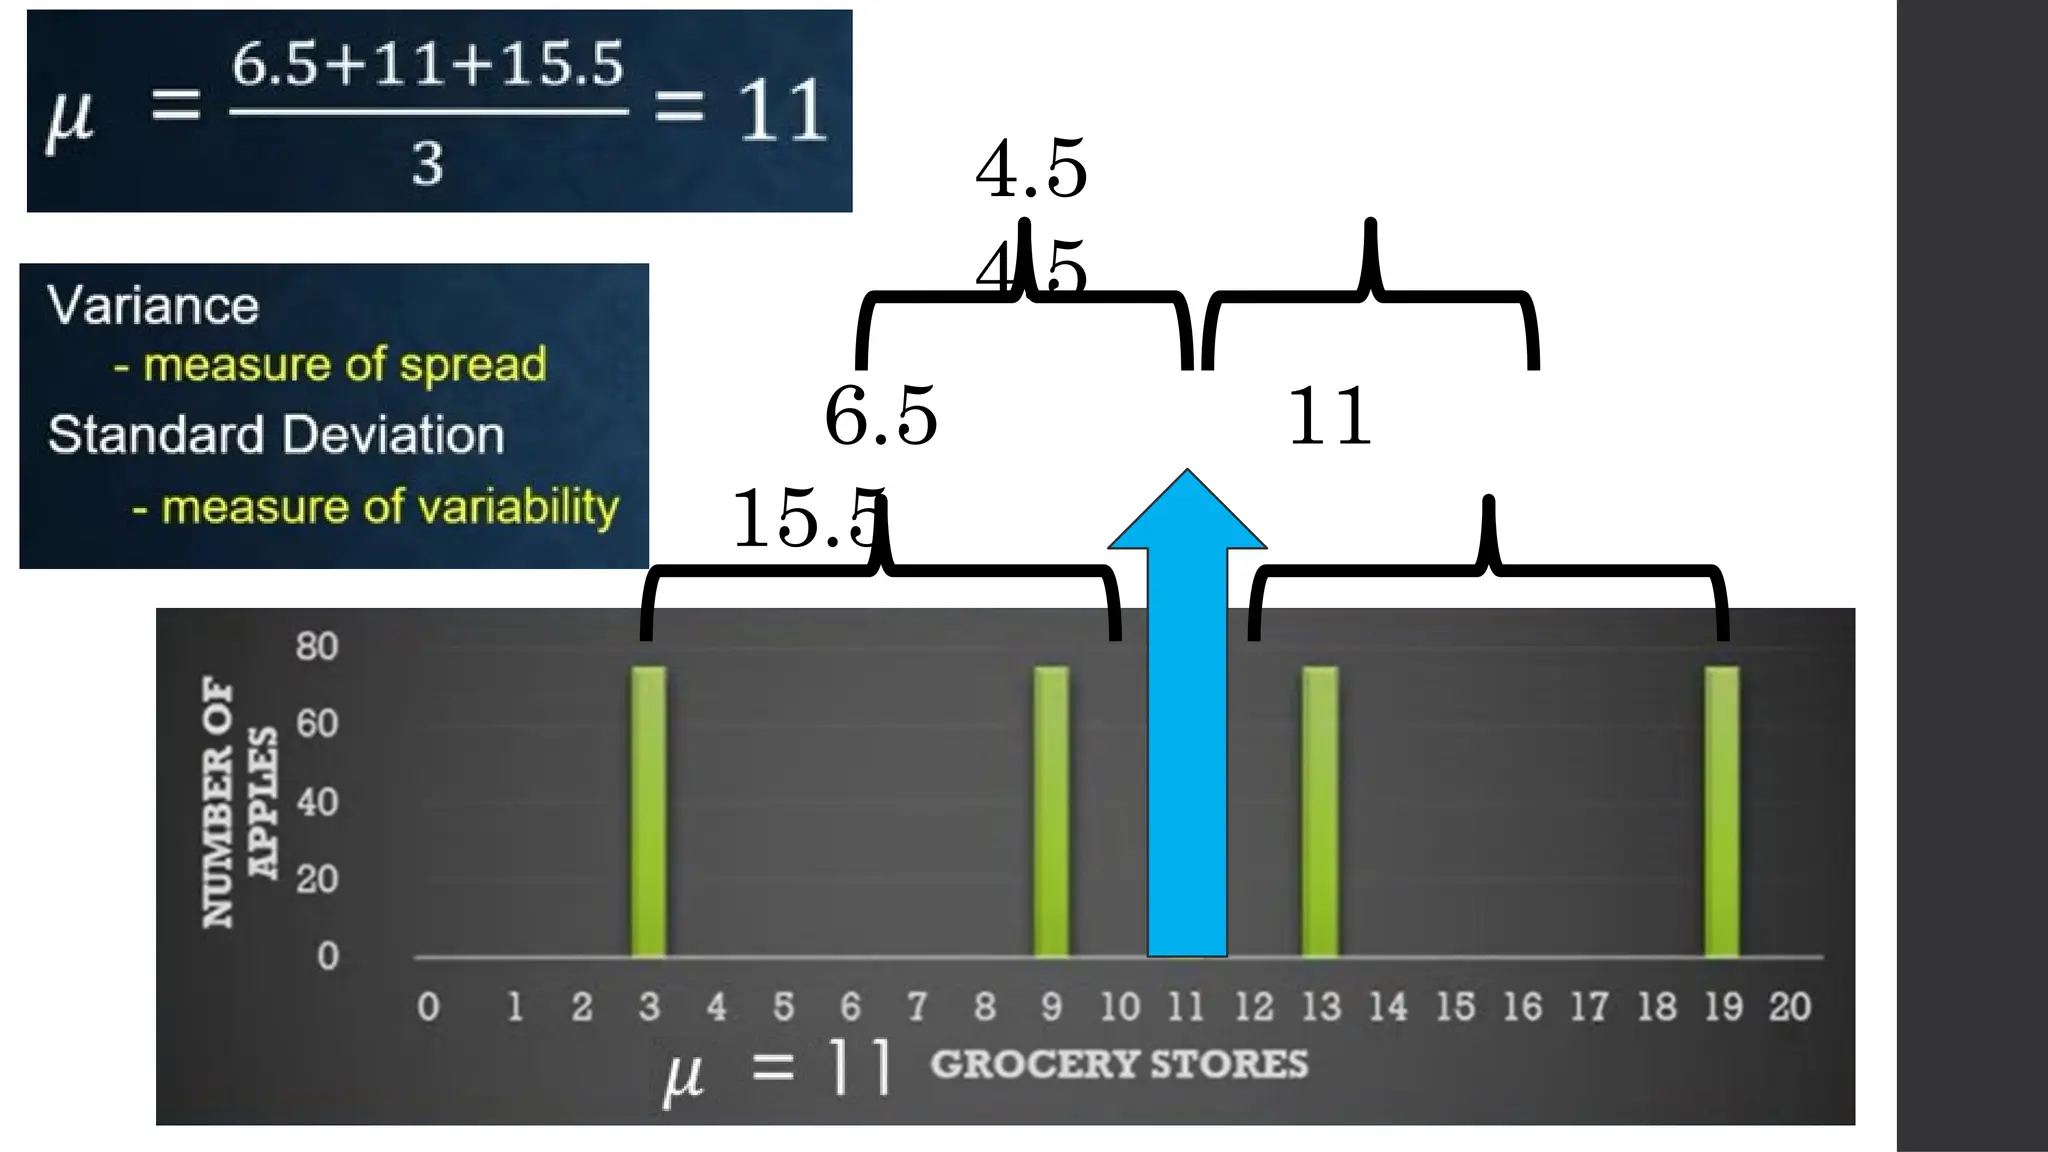
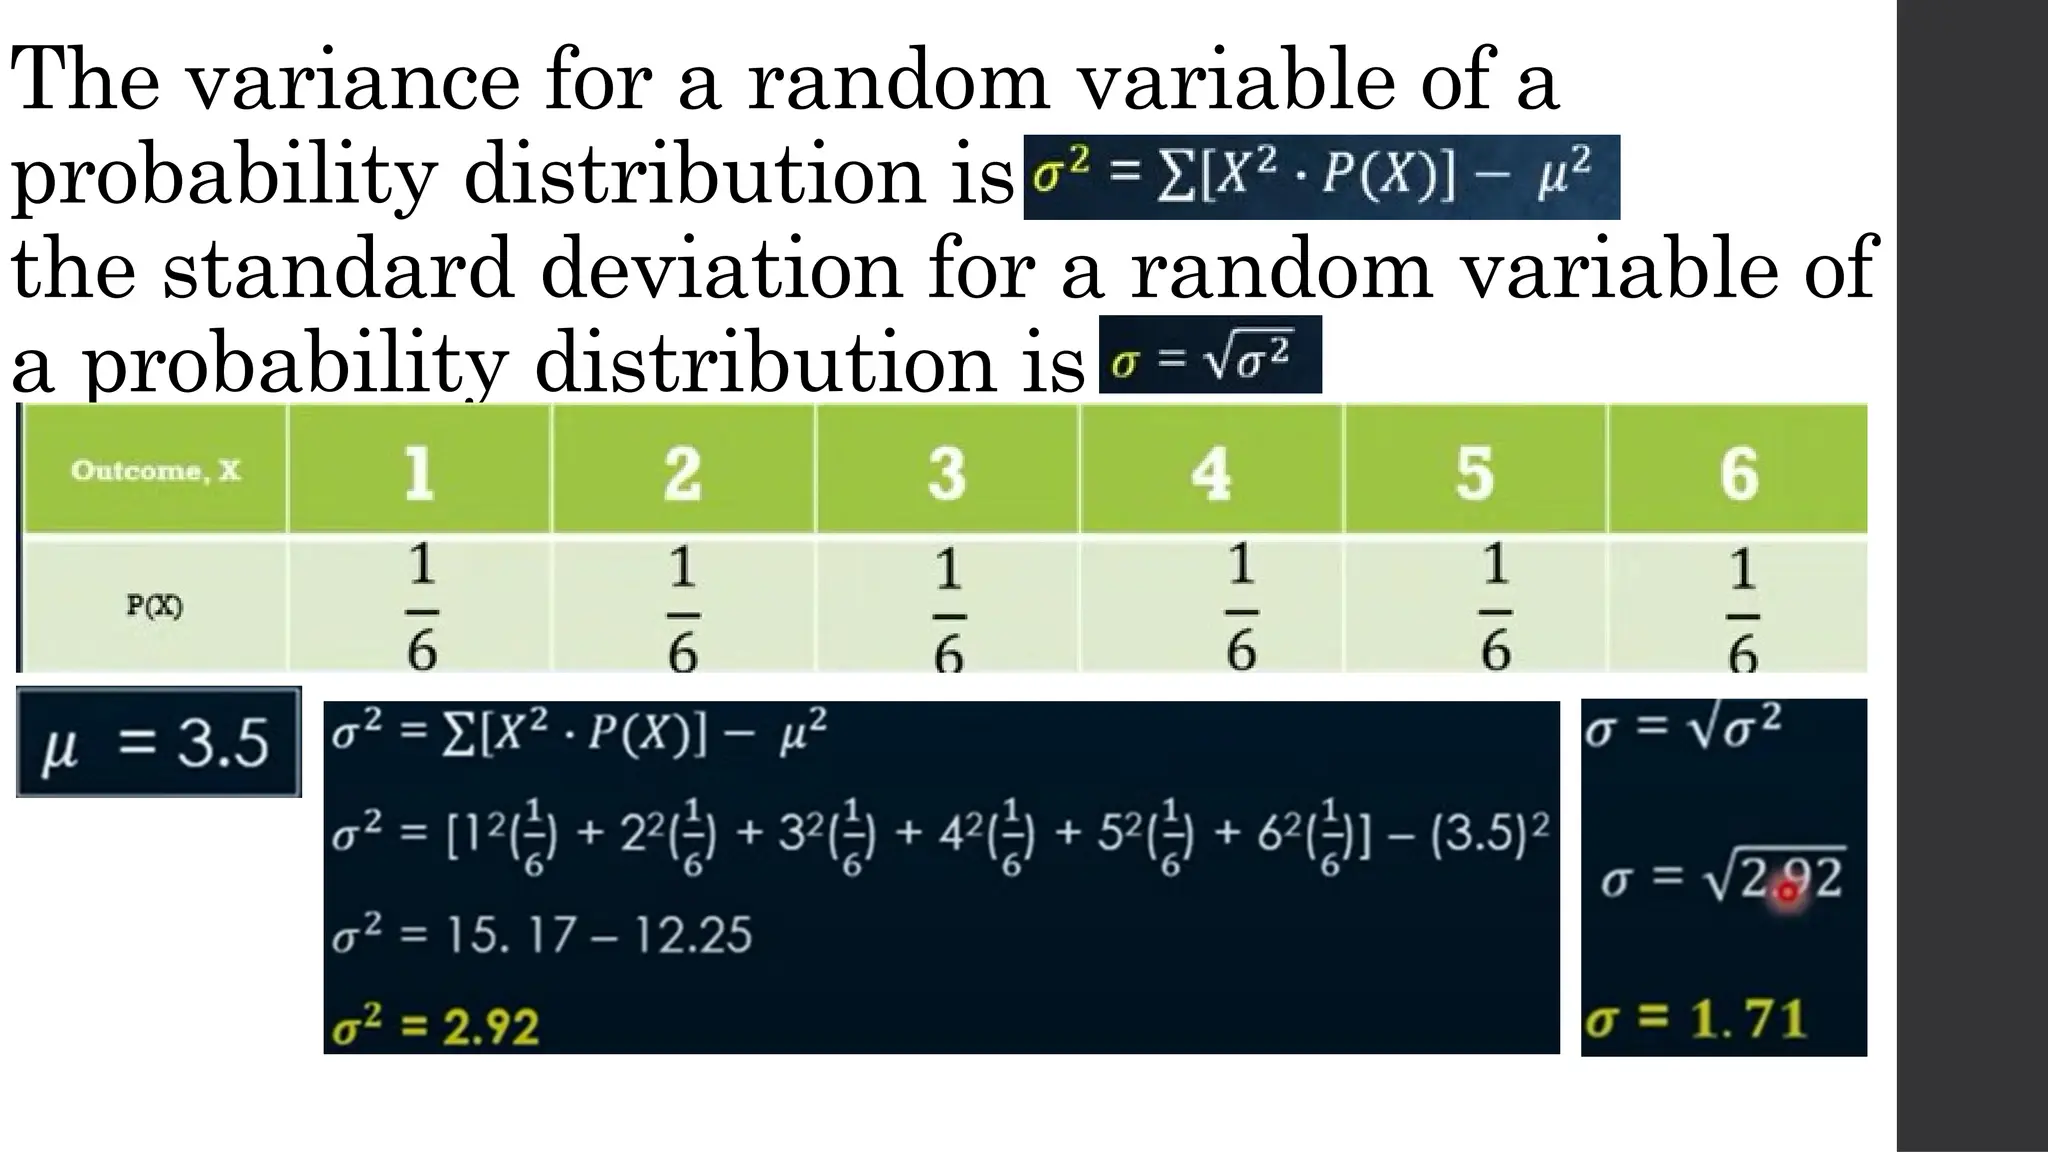
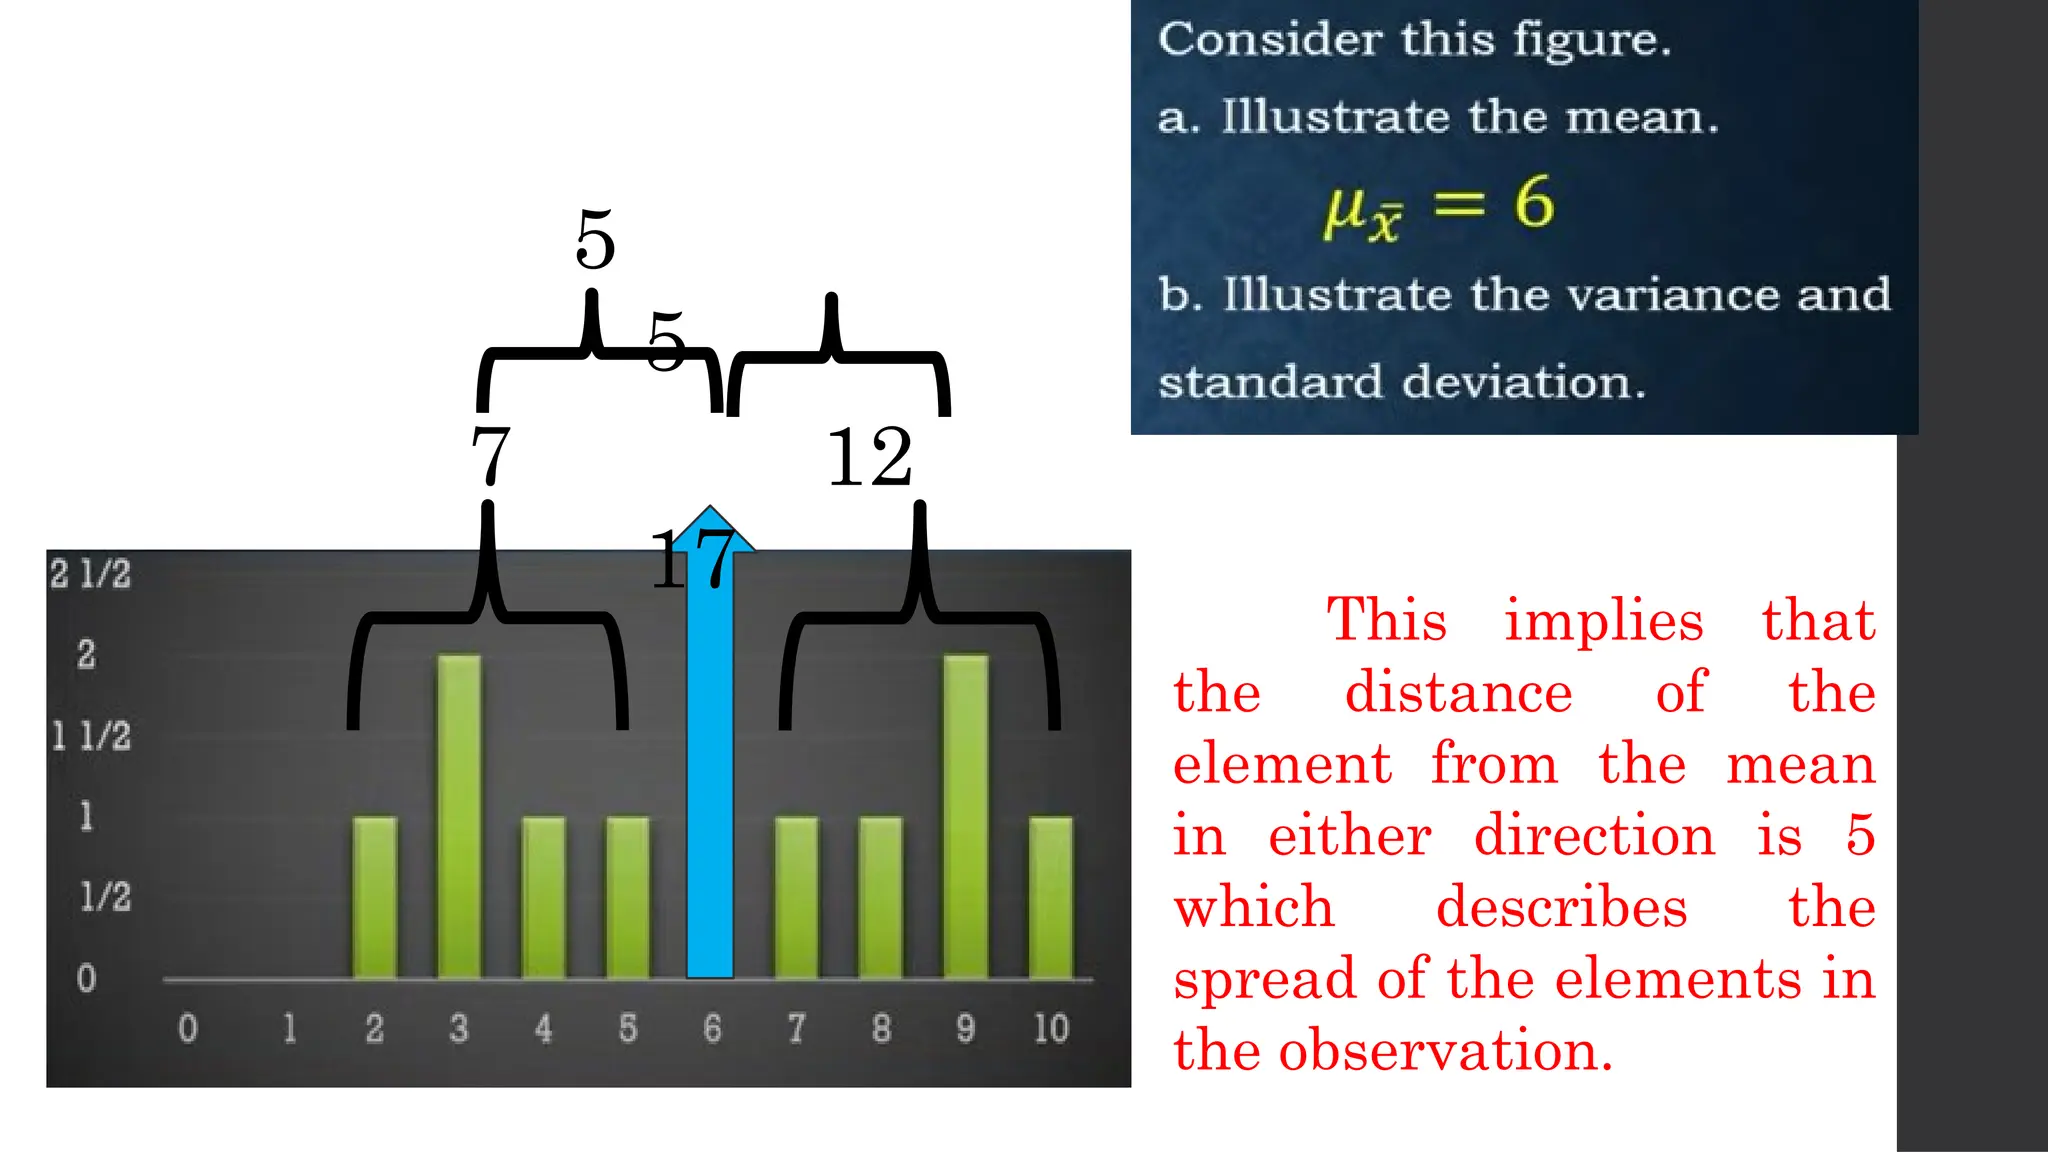
Computing Probability
Corresponding to a
given Random Variable
January 09, 2025
Melanie Ventura
Statistics and Probability
INEQUALITY SYMBOLS
Example:
The table shows the probabilities for the number of Red
Velvet albums sold in a given day at a merchandise store.
Number of
Albums (X)
Probability
P(X)
0 0.040
1 0.060
2 0.080
3 0.090
4 0.140
5 0.280
6 0.380
7 0.385
Find P(3
In a K-Pop dance group called NCT, the number of
members that are busy in their individual activities at
8:00 am from weekends. The probability shows in the
table.
What is the probability
that at least three, but
fewer than six of the
members of NCT are
busy at 8:00 am?
No. of
Members (X)
Probability,
P(X)
0 0.35
1 0.215
2 0.110
3 0.320
4 0.180
5 0.575
6 0.95
Let x be the value of a random variable represented by
the number of “Photocards” (PC) in an album. The
probability distribution table is shown in the table.
Find the probability
that at least 25 PCs can
be found in an album on
a particular day.
No. of PC
(X)
Probability
P(X)
12 3/12
21 1/12
25 2/12
32 1/6
40 3/12
47 2/12
Illustrating Mean
and Variance of
Discrete Random
Variable
The mean of a discrete random variable by utilizing
probabilities from its dispersion, as follows.
1. The mean is considered as a measure of the ‘ central location’
of a random variable. It is the weighted average of the values
that random variable X can take, with weights provided by
the probability distribution.
2. The Expected Value or Mean Value of a discrete random
variable x is can be computed by first multiplying each
possible x value by the probability of observing that value and
then adding the resulting quantities. Symbolically,
The average tends to be close to 3.5. this also implies
that the more rolls we do, the closer the average will be
to 3.5.
4 7
10
6.5 11
15.5
4.5
4.5
The variance for a random variable of a
probability distribution is
the standard deviation for a random variable of
a probability distribution is
7 12
17
5
5
This implies that
the distance of the
element from the mean
in either direction is 5
which describes the
spread of the elements in
the observation.

Computing Probability Corresponding to a given Random Variable.pptx

  • 1.
    Computing Probability Corresponding toa given Random Variable January 09, 2025 Melanie Ventura Statistics and Probability
  • 2.
  • 3.
    Example: The table showsthe probabilities for the number of Red Velvet albums sold in a given day at a merchandise store. Number of Albums (X) Probability P(X) 0 0.040 1 0.060 2 0.080 3 0.090 4 0.140 5 0.280 6 0.380 7 0.385 Find P(3
  • 4.
    In a K-Popdance group called NCT, the number of members that are busy in their individual activities at 8:00 am from weekends. The probability shows in the table. What is the probability that at least three, but fewer than six of the members of NCT are busy at 8:00 am? No. of Members (X) Probability, P(X) 0 0.35 1 0.215 2 0.110 3 0.320 4 0.180 5 0.575 6 0.95
  • 5.
    Let x bethe value of a random variable represented by the number of “Photocards” (PC) in an album. The probability distribution table is shown in the table. Find the probability that at least 25 PCs can be found in an album on a particular day. No. of PC (X) Probability P(X) 12 3/12 21 1/12 25 2/12 32 1/6 40 3/12 47 2/12
  • 6.
    Illustrating Mean and Varianceof Discrete Random Variable
  • 7.
    The mean ofa discrete random variable by utilizing probabilities from its dispersion, as follows. 1. The mean is considered as a measure of the ‘ central location’ of a random variable. It is the weighted average of the values that random variable X can take, with weights provided by the probability distribution. 2. The Expected Value or Mean Value of a discrete random variable x is can be computed by first multiplying each possible x value by the probability of observing that value and then adding the resulting quantities. Symbolically,
  • 8.
    The average tendsto be close to 3.5. this also implies that the more rolls we do, the closer the average will be to 3.5.
  • 9.
  • 10.
  • 11.
    The variance fora random variable of a probability distribution is the standard deviation for a random variable of a probability distribution is
  • 12.
    7 12 17 5 5 This impliesthat the distance of the element from the mean in either direction is 5 which describes the spread of the elements in the observation.