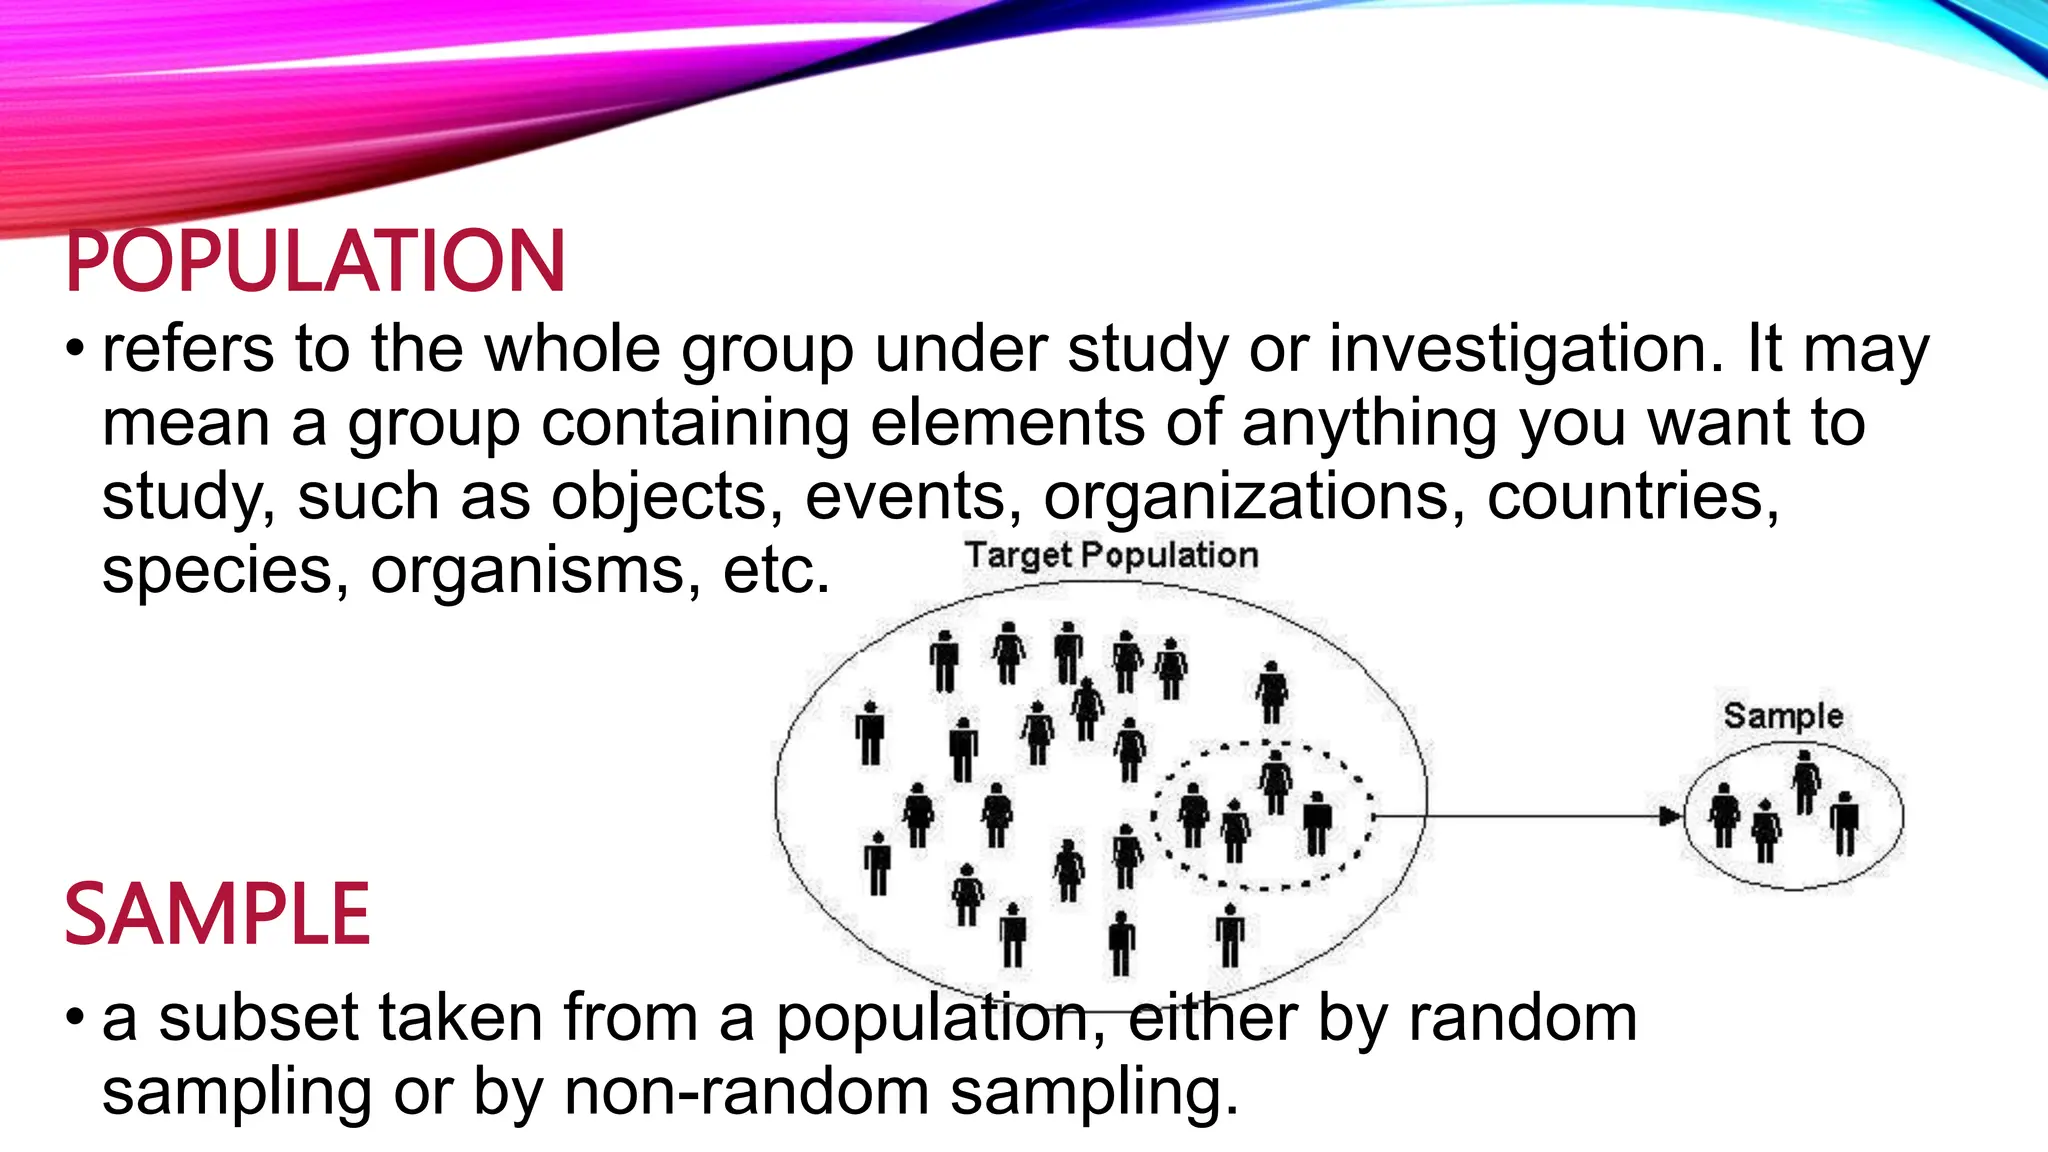
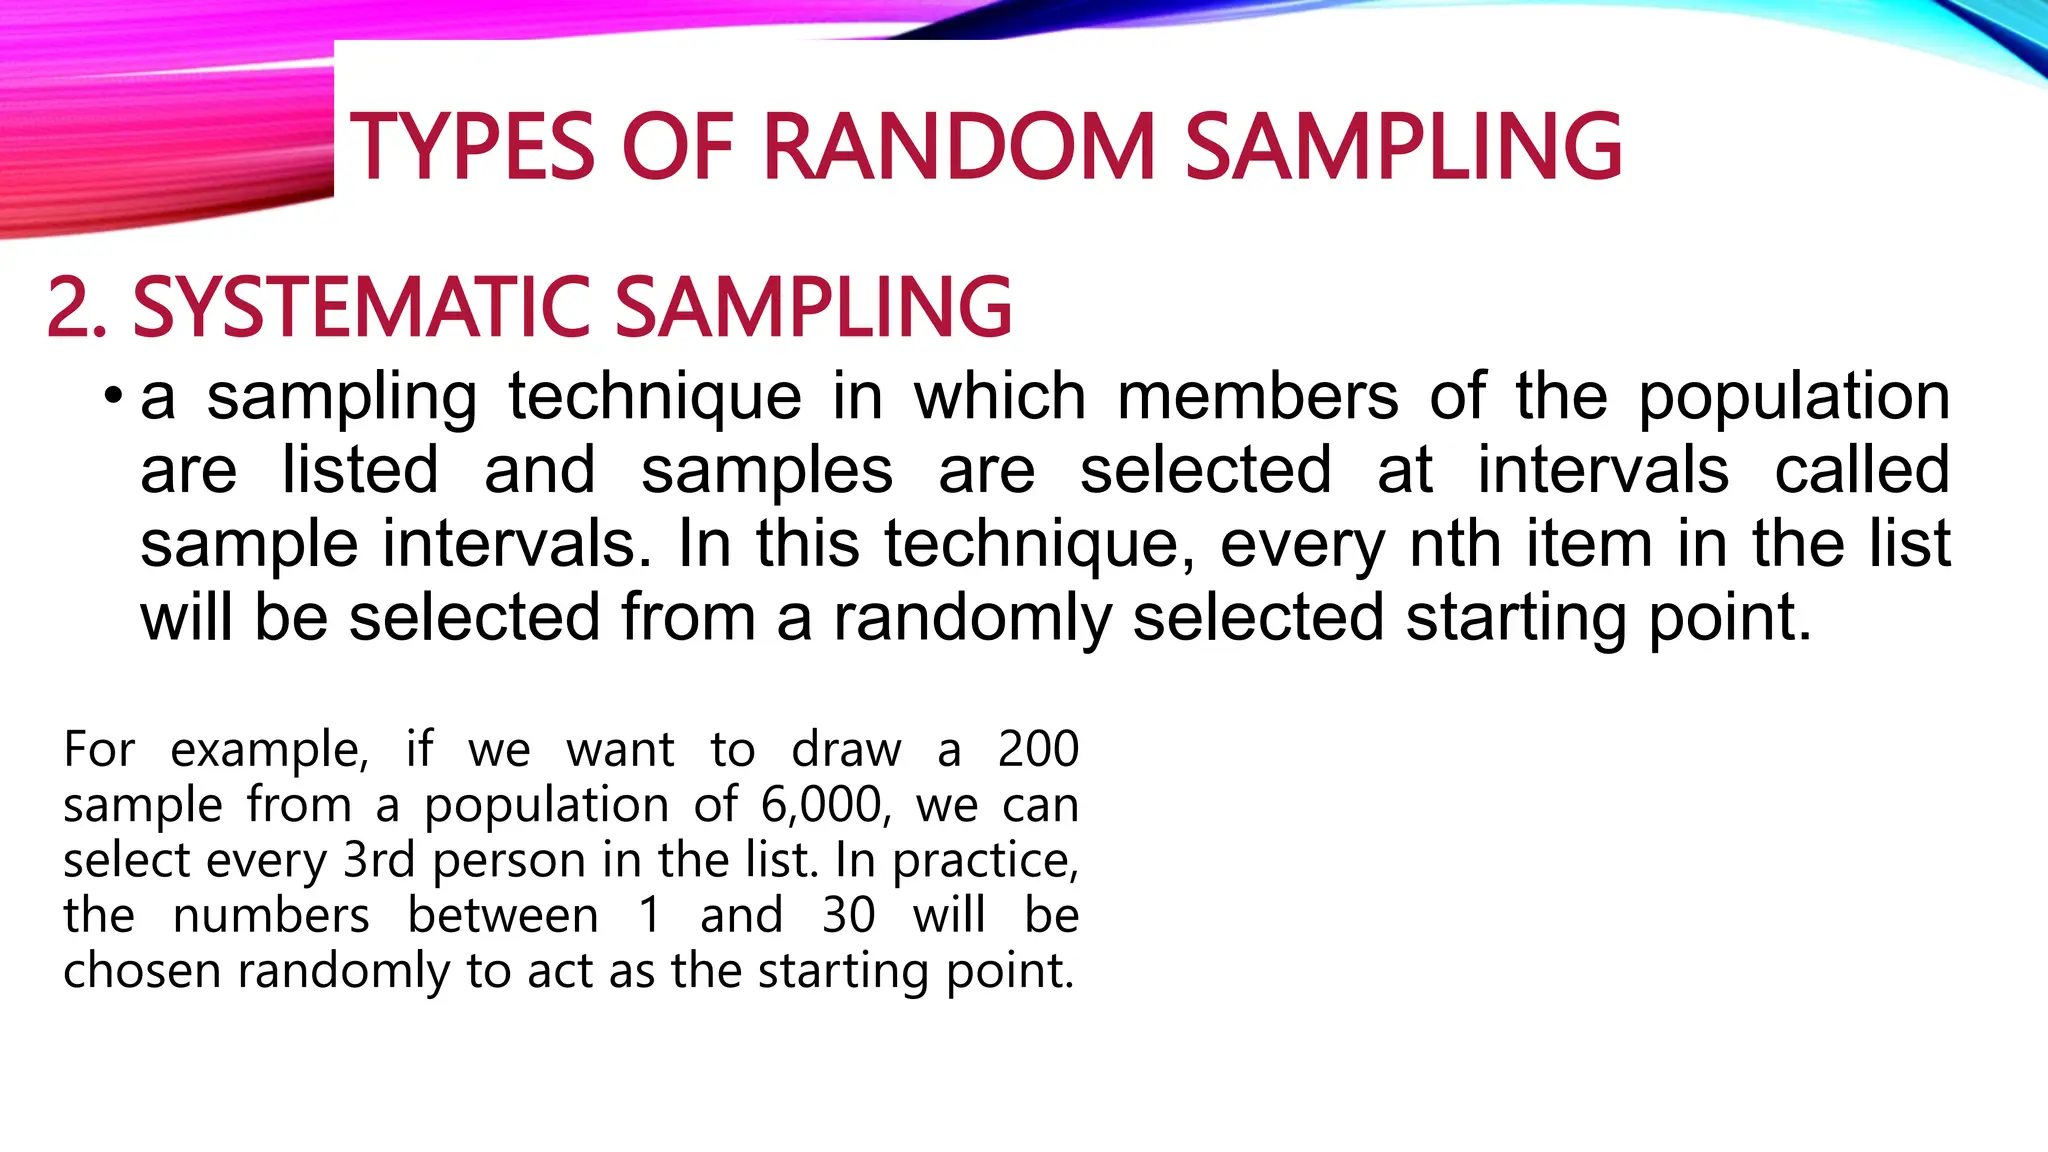
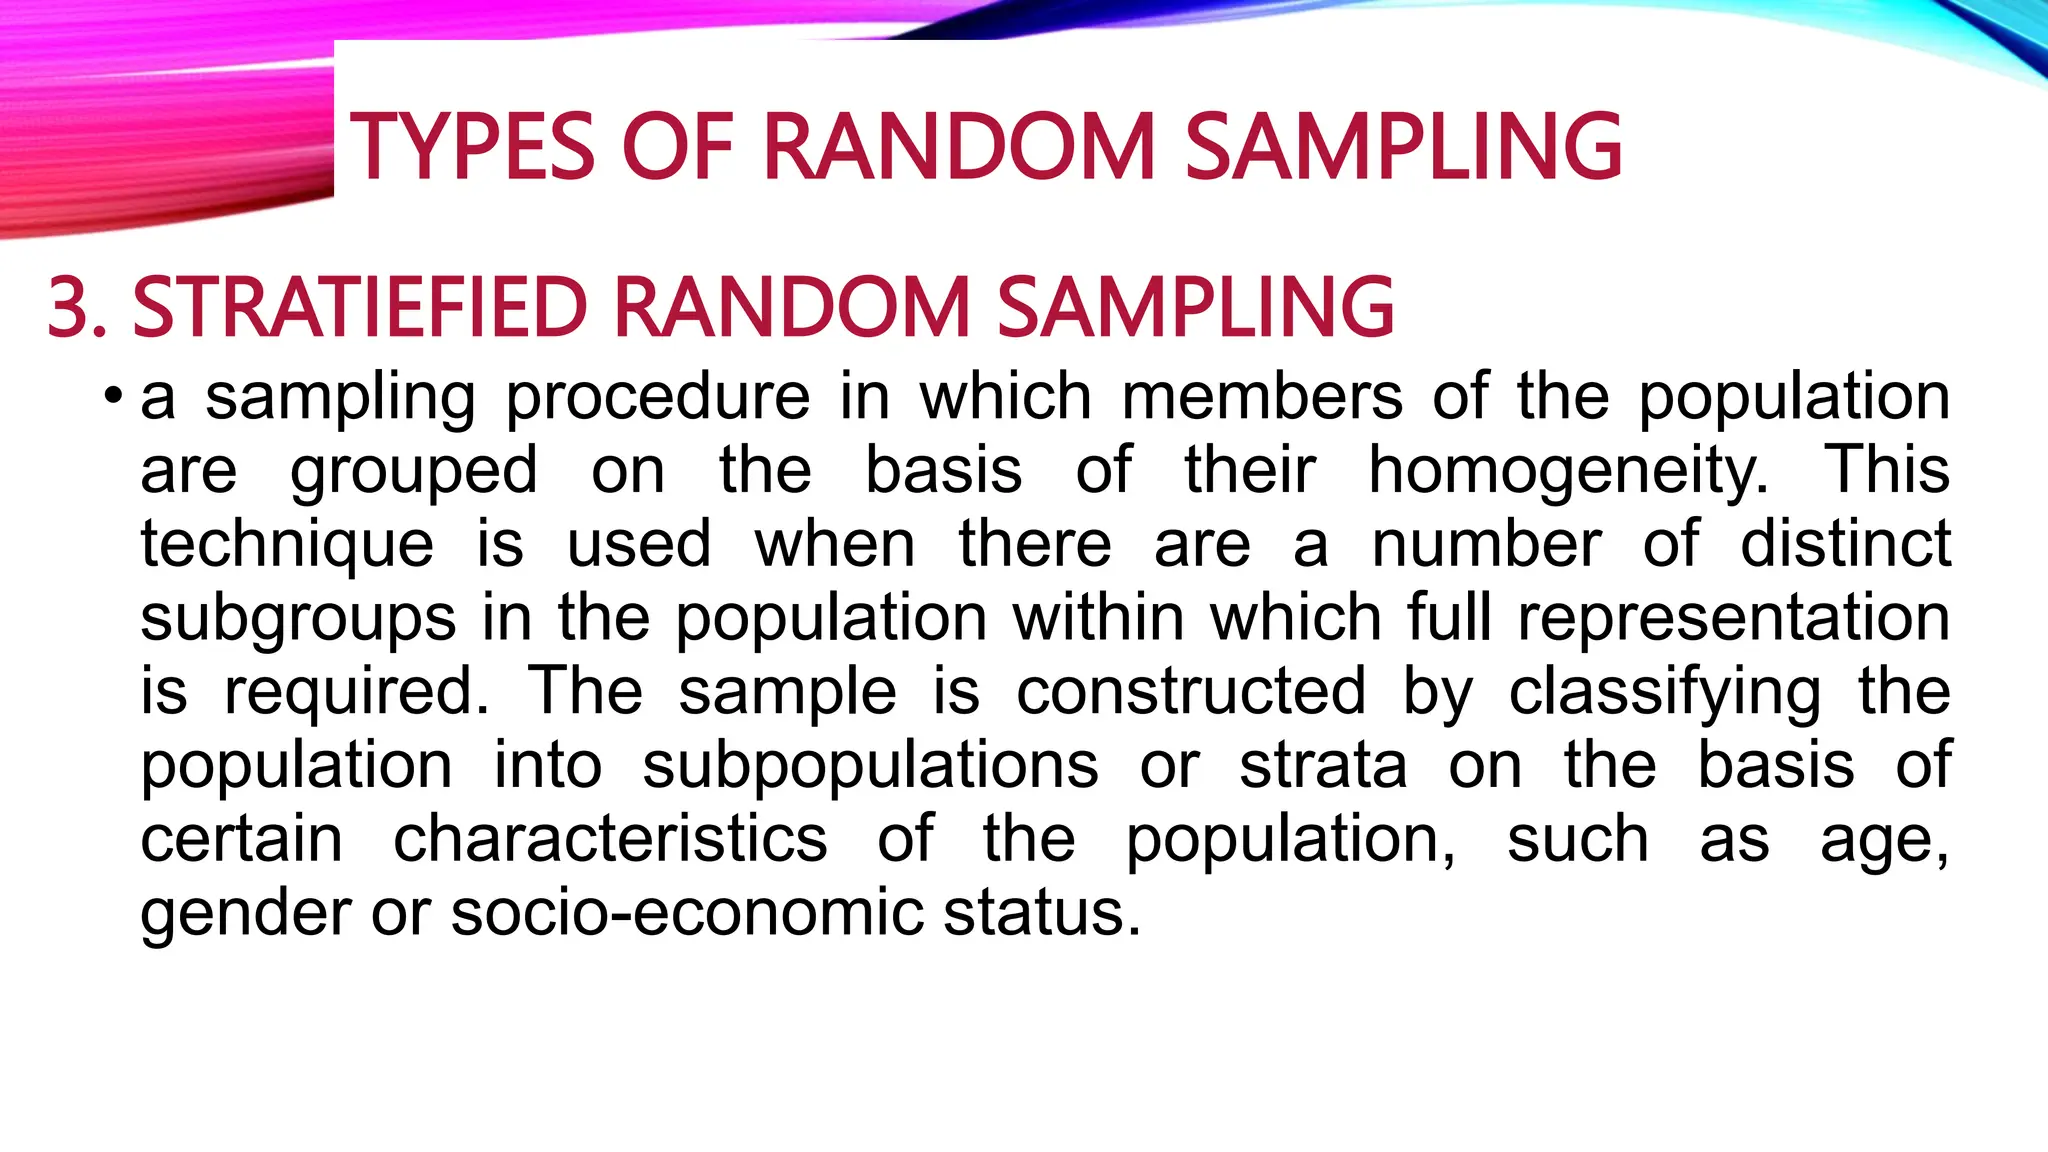
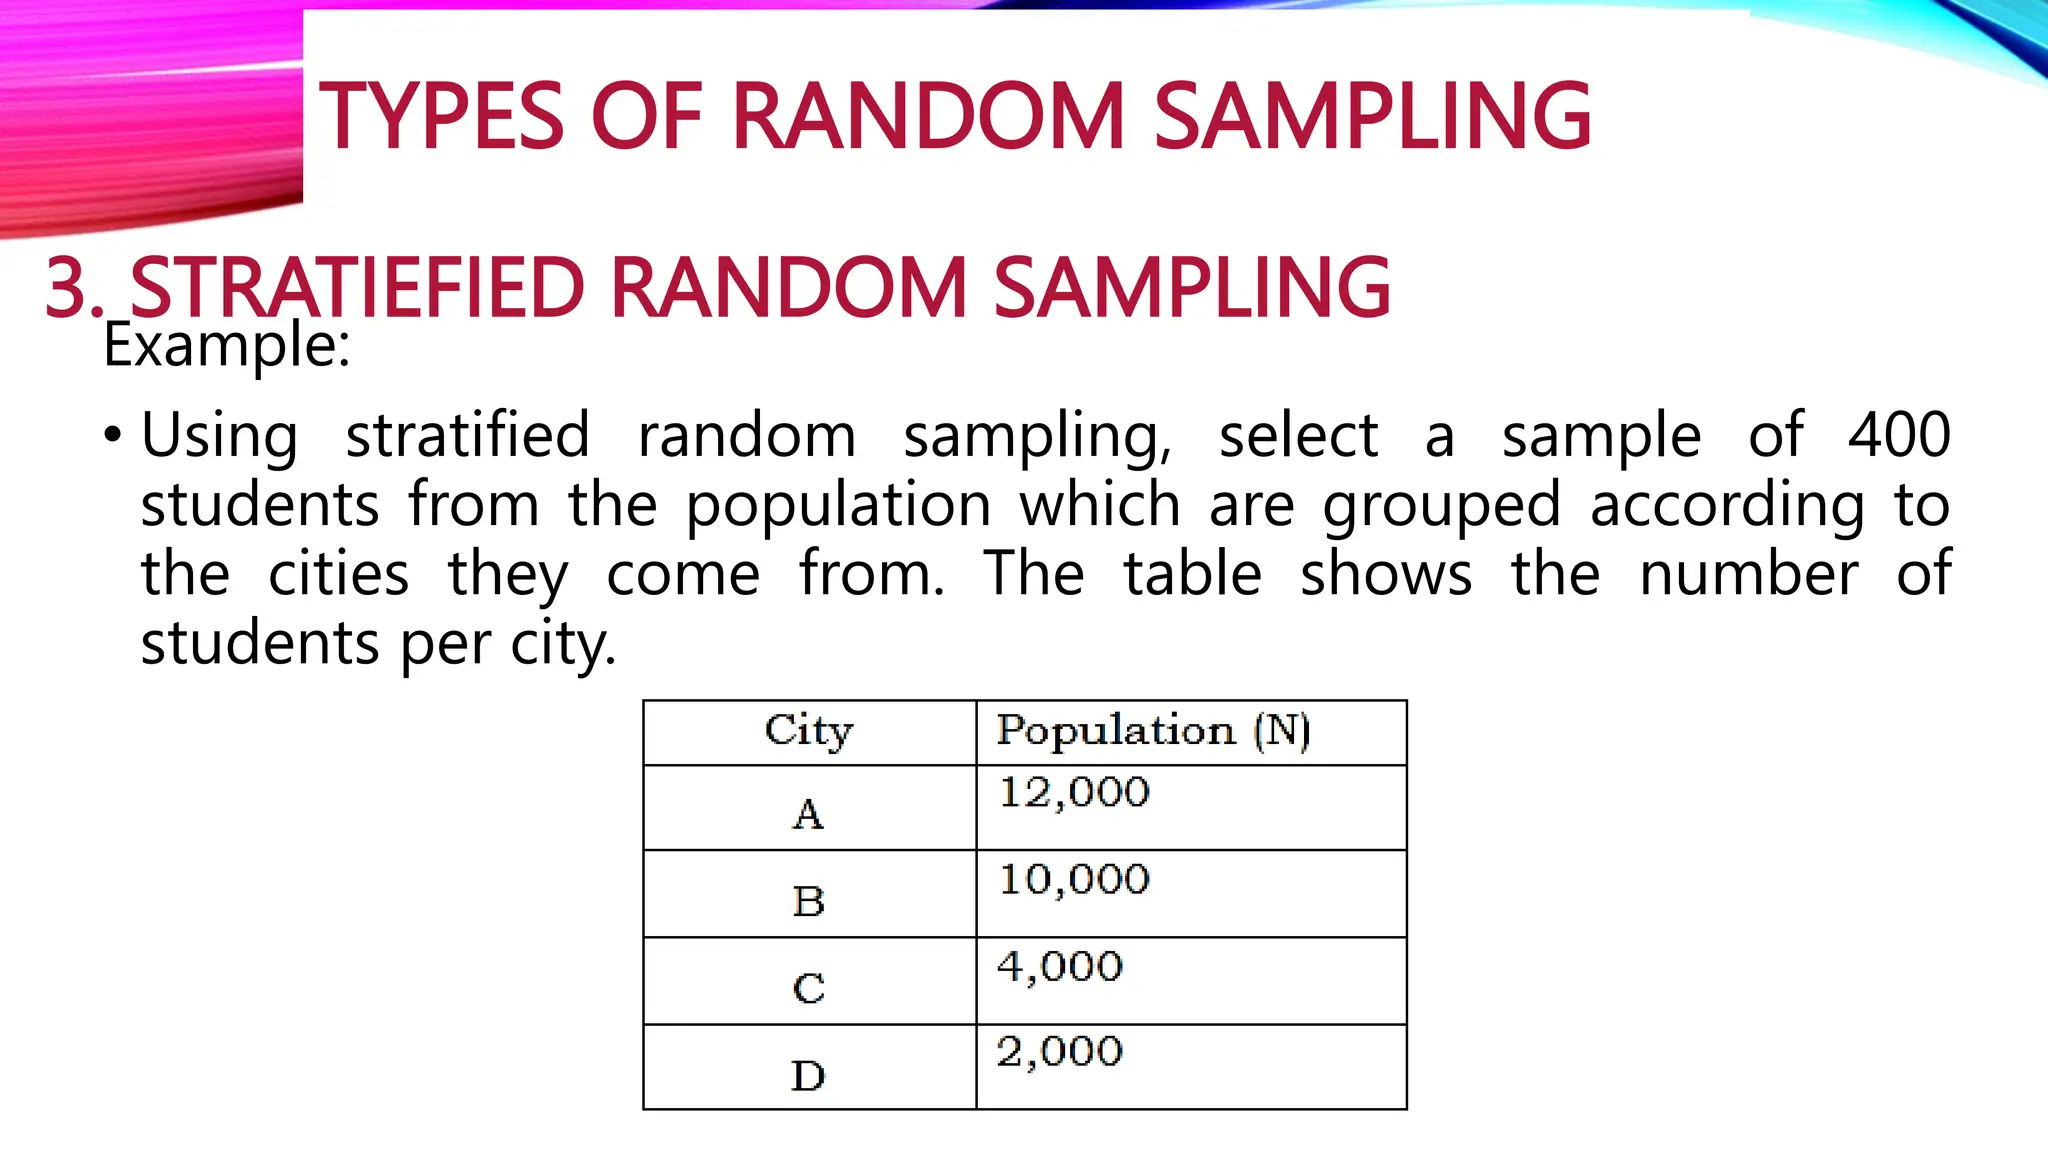
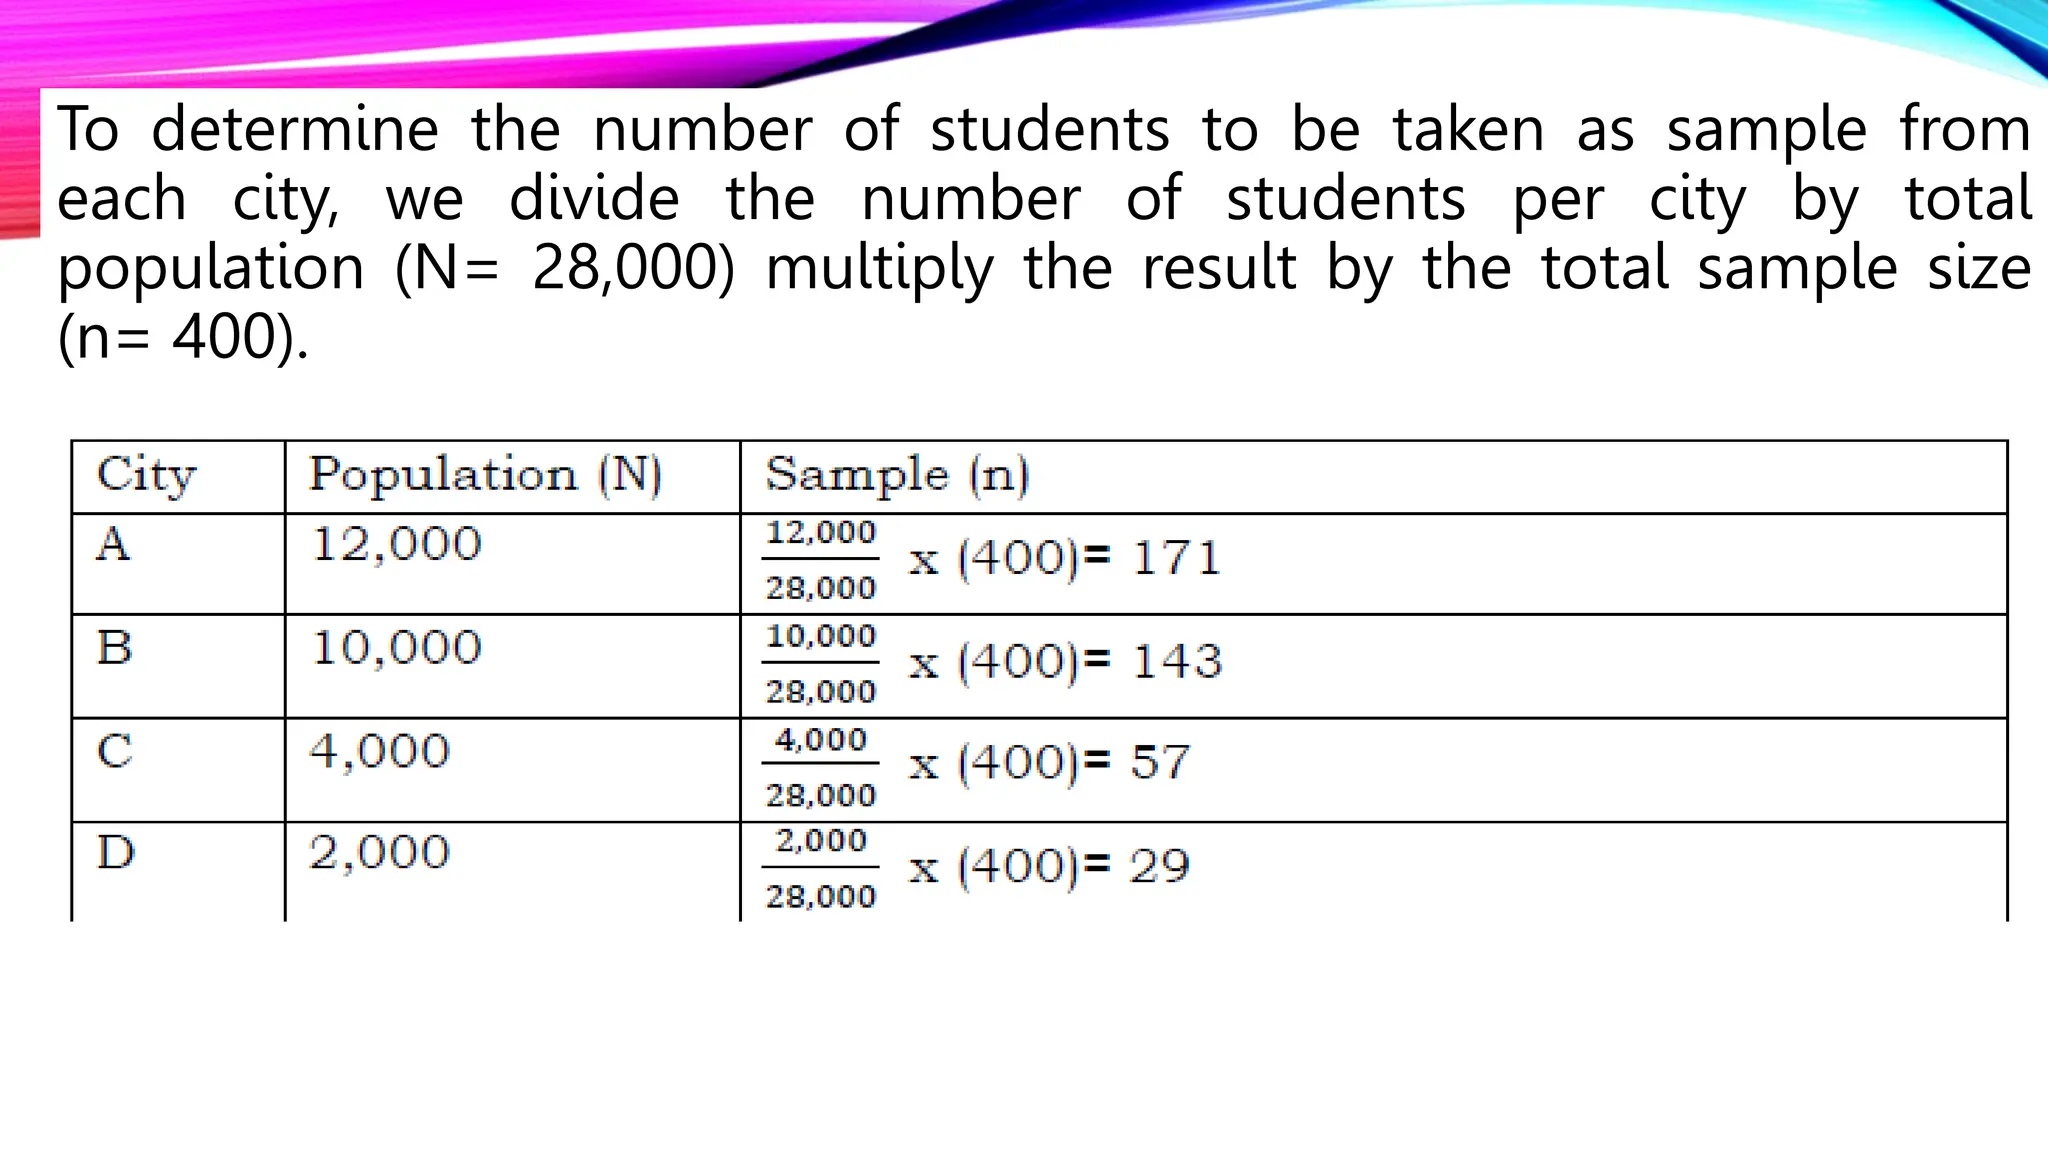
3. POPULATION
• refers to the whole group under study or investigation. It may
mean a group containing elements of anything you want to
study, such as objects, events, organizations, countries,
species, organisms, etc.
SAMPLE
• a subset taken from a population, either by random
sampling or by non-random sampling.
4. RANDOM SAMPLING
•is a selection of n elements derived from
the N population, which is the subject of an
investigation or experiment, where each
point of the sample has an equal chance of
being selected using the appropriate
sampling technique.
5. TYPES OF RANDOM SAMPLING
• a sampling technique in which each member of the
population has an equal chance of being selected. An
instance of this is when members of the population have
their names represented by small pieces of paper that are
then randomly mixed together and picked out. In the
sample, the members selected will be included.
1. LOTTERY SAMPLING
6. TYPES OF RANDOM SAMPLING
• a sampling technique in which members of the population
are listed and samples are selected at intervals called
sample intervals. In this technique, every nth item in the list
will be selected from a randomly selected starting point.
2. SYSTEMATIC SAMPLING
For example, if we want to draw a 200
sample from a population of 6,000, we can
select every 3rd person in the list. In practice,
the numbers between 1 and 30 will be
chosen randomly to act as the starting point.
7. TYPES OF RANDOM SAMPLING
• a sampling procedure in which members of the population
are grouped on the basis of their homogeneity. This
technique is used when there are a number of distinct
subgroups in the population within which full representation
is required. The sample is constructed by classifying the
population into subpopulations or strata on the basis of
certain characteristics of the population, such as age,
gender or socio-economic status.
3. STRATIEFIED RANDOM SAMPLING
8. TYPES OF RANDOM SAMPLING
Example:
• Using stratified random sampling, select a sample of 400
students from the population which are grouped according to
the cities they come from. The table shows the number of
students per city.
3. STRATIEFIED RANDOM SAMPLING
9. To determine the number of students to be taken as sample from
each city, we divide the number of students per city by total
population (N= 28,000) multiply the result by the total sample size
(n= 400).
10. TYPES OF RANDOM SAMPLING
•sometimes referred to as area sampling and applied
on a geographical basis. Generally, first sampling is
performed at higher levels before going down to
lower levels. For example, samples are taken
randomly from the provinces first, followed by cities,
municipalities or barangays, and then from
households.
4. CLUSTER SAMPLING
11. TYPES OF RANDOM SAMPLING
•uses a combination of different sampling techniques.
For example, when selecting respondents for a
national election survey, we can use the lottery
method first for regions and cities. We can then use
stratified sampling to determine the number of
respondents from selected areas and clusters.
5. MULTI-STAGE SAMPLING
12. PARAMETER AND STATISTIC
• is a descriptive population measure.
• It is a measure of the characteristics of the entire population
(a mass of all the units under consideration that share
common characteristics) based on all the elements within
that population.
PARAMETER
Example:
1. All people living in one city, all-male teenagers worldwide, all
elements in a shopping cart, and all students in a classroom.
2. The researcher interviewed all the students of a school for their
favorite apparel brand.
13. STATISTIC
PARAMETER AND STATISTIC
• Is the number that describes the sample.It can be calculated and
observed directly. The statistic is a characteristic of a population or
sample group.
• You will get the sample statistic when you collect the sample and
calculate the standard deviation and the mean. You can use sample
statistic to draw certain conclusions about the entire population.
Example:
1. Fifty percent of people living in the U.S. agree with the latest health care
proposal. Researchers can’t ask hundreds of millions of people if they agree,
so they take samples or part of the population and calculate the rest.
2. Researcher interviewed the 70% of covid-19 survivors.
14. SAMPLING DISTRIBUTION OF
STATISTIC (SAMPLE MEAN)
Example: A population consists of the five numbers 2, 3, 6, 10 and 12.
Consider samples of size 2 that can be drawn from this population.
Step1: Know the number of possible samples that can be drawn from the
population.
15.
16.
17.
18.
19.
20.
21.
22. LET’S TRY THIS!
A certain population consist of the
numbers 3, 6, 7, 12, and 4. Construct a
sampling distribution of size 3.
23. A. Directions: Identify the terms being described. Choose your answer inside
the box.
random sampling population lottery sampling
sample systematic sampling
_________1. It refers to the entire group that is under study or investigation.
_________2. It is a subset taken from a population, either by random or non-
random sampling technique. A sample is a representation of the population
where one hopes to draw valid conclusions from about population.
_________3. This is a selection of n elements derived from a population N,
which is the subject of the investigation or experiment, where each sample
point has an equal chance of being selected using the appropriate sampling
technique.
24. A. Directions: Identify the terms being described. Choose your answer inside
the box.
random sampling population lottery sampling
sample systematic sampling
_________4. A sampling technique where every member of the population
has an equal chance of being selected.
_________5. It refers to a sampling technique in which members of the
population are listed and samples are selected in intervals called sample
intervals.
25. B. Directions: Determine the statement whether it is true or false. Write
T if the statement is true and F if it is false.
_____6. A statistic is a number which describes a sample.
_____7. A parameter is a descriptive measure of population.
_____8. An example of parameter is the sample mean.
_____9. An average age of students in East High School is an
example of statistic.
_____10. An example of statistic is a population mean.
26. C. Directions: Construct a sampling distribution of sample
mean.
Samples of 3 cards are drawn from a population
of five cards numbered from 1-5.