This document provides an overview of the normal distribution. It discusses how the normal distribution arises from the binomial distribution with large numbers of trials. Some key properties of the normal distribution are that it is symmetric, bell-shaped, and defined by its mean and standard deviation. The normal distribution is widely used in fields like statistics, science, engineering, and medicine. Examples are provided to demonstrate how to calculate probabilities within a normal distribution for applications like predicting machine part sizes and light bulb lifetimes.


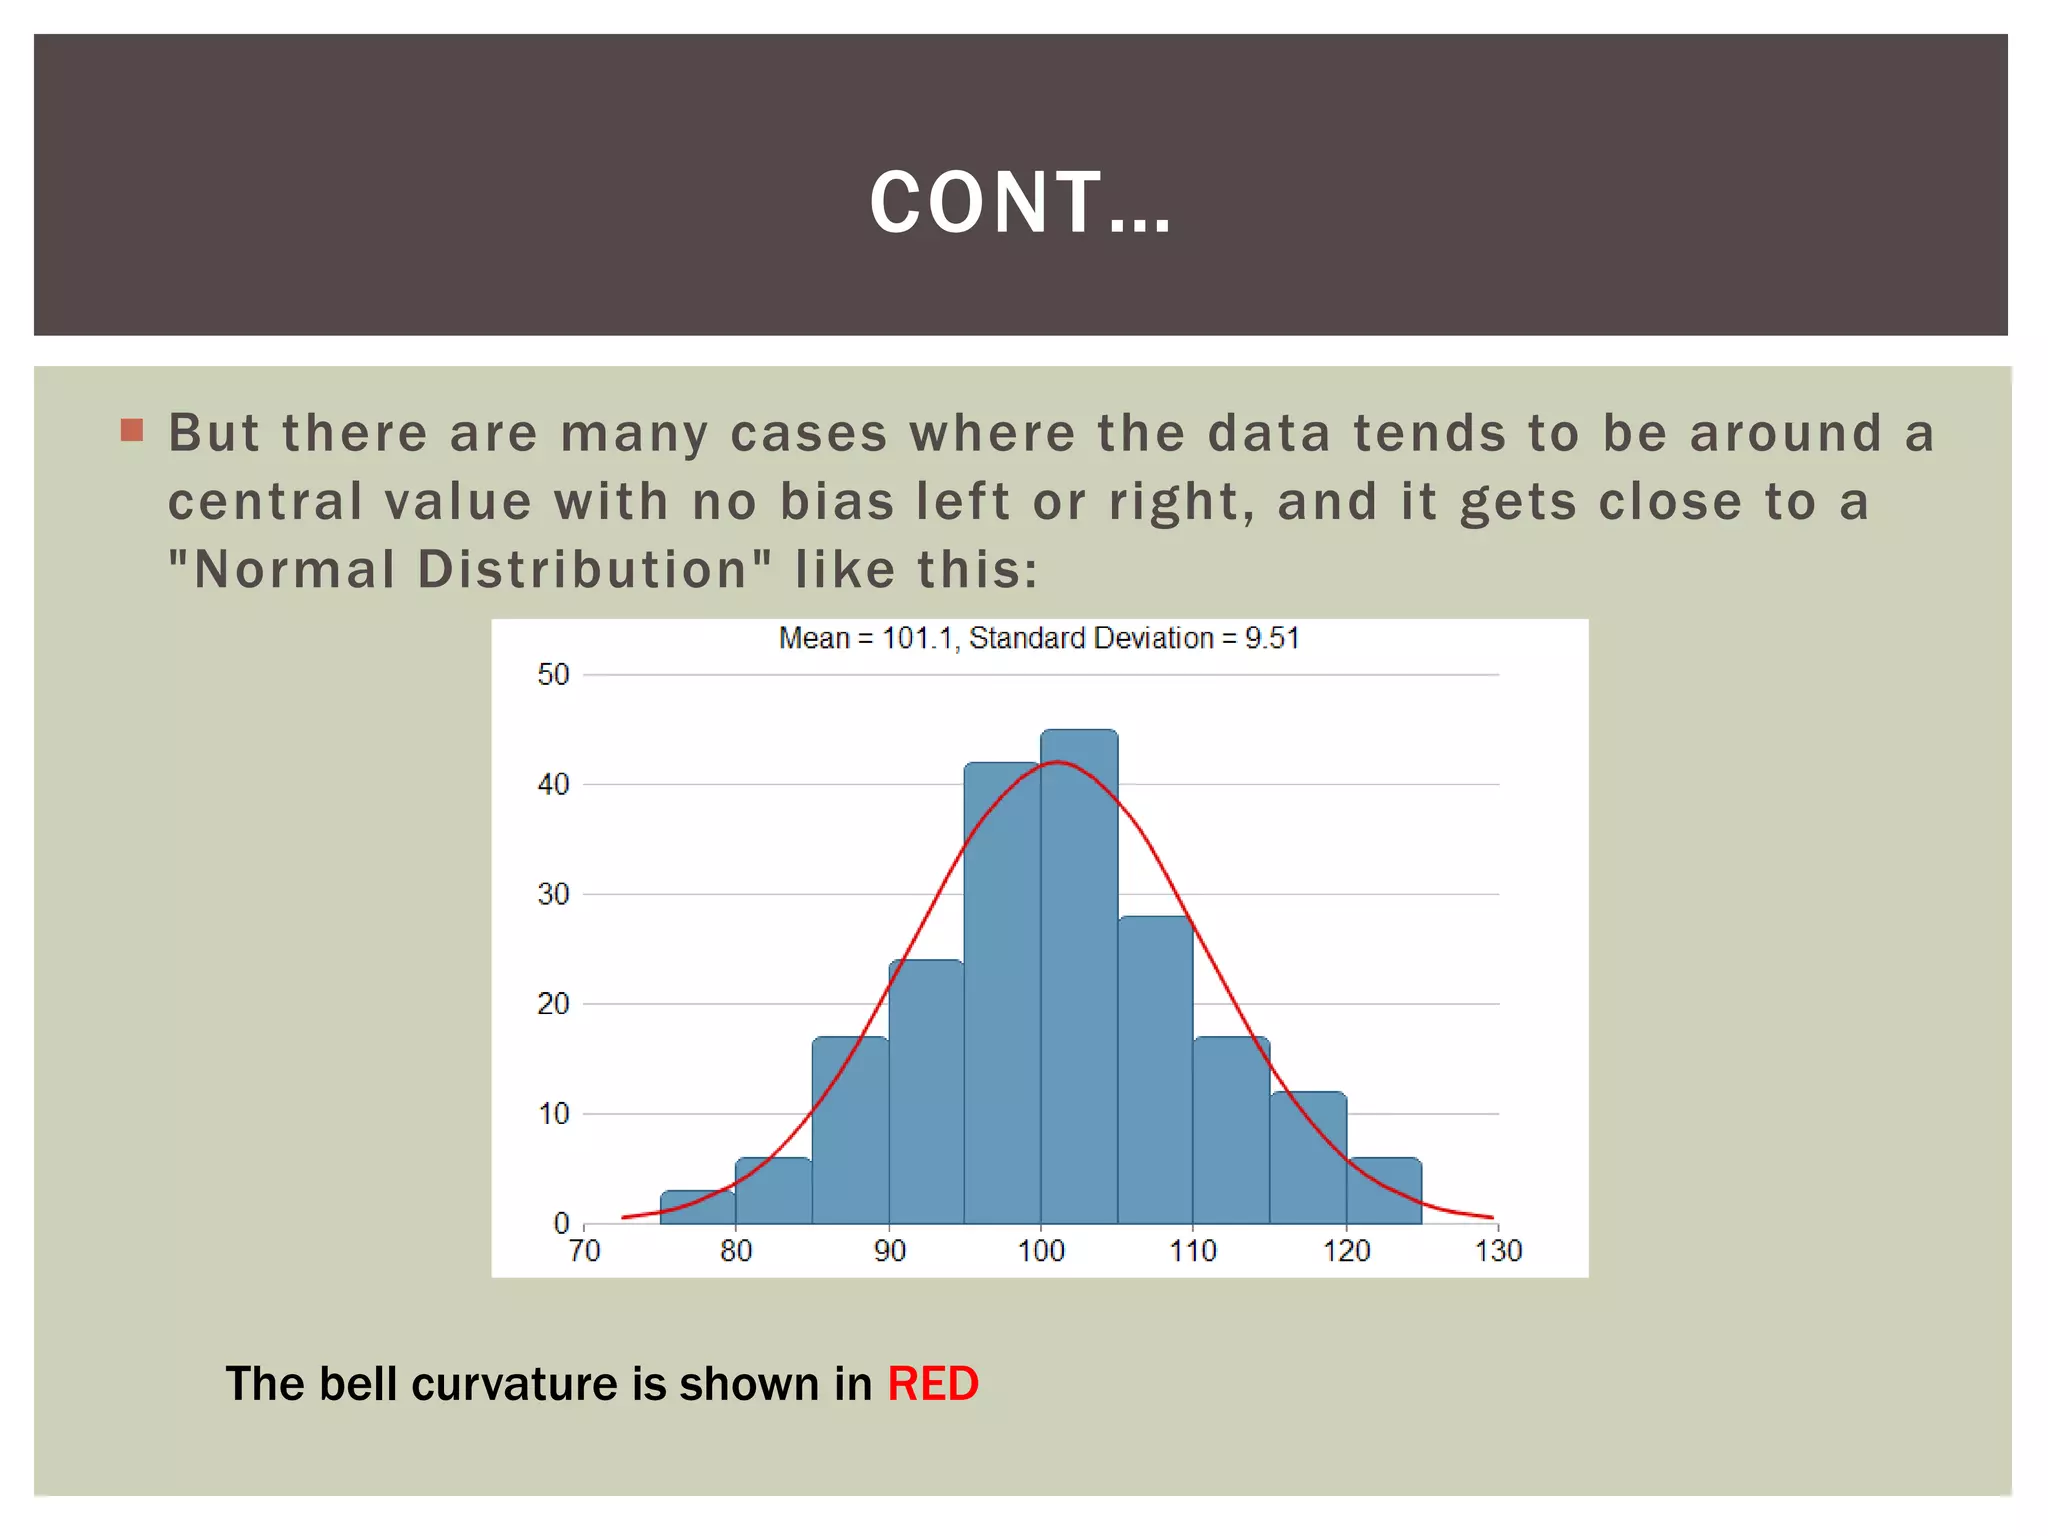


![ A city installs 2000 electric lamps, having a mean burning life
of 1000 hours with a standard deviation of 200 hours. The
normal distribution is a close approximation to this case. a)
What is the probability that a lamp will fail in the first 700
burning hours?
Sol.
z1 = (x1 − µ)/(σ) = (700 −1000)/(200) =− 1.50 From standard
Z table, for z1 = –1.50 = (–1.5) + (–0.00),
Pr [X < 700] = Pr [Z < –1.50] = Φ(–1.50) = 0.0668
Then Pr [burning life < 700 hours] = 0.0668 or 0.067.
b) What is the probability that a lamp will fail between 900 and
1300 burning hours?
EXAMPLE 1](https://image.slidesharecdn.com/normaldistribution-191224065855/75/Normal-distribution-17-2048.jpg)
![z1 = (x1-μ)/(σ) = 900-1000/200 = -0.50 = -0.50 + -0.00
AND z2= (x2-μ)/(σ) = 1300-1000/200 = +1.50+ -0.00
Φ(z1) = Φ(–0.50) = 0.3085 and Φ(z2) = Φ(1.50) = 0.9332
Then Pr [900 hours < burning life < 1300 hours]
= Φ(z2) – Φ(z1) for = 0.9332 – 0.3085 = 0.6247 or 0.625.
CONT…](https://image.slidesharecdn.com/normaldistribution-191224065855/75/Normal-distribution-18-2048.jpg)
![ A machine produces bolts which are (4,0.09), where
measurements are in mm. Bolts are measured accurately and
any which are smaller than 3.5mm or larger than 4.4mm is
rejected. Out of batch of 500 bolts, how many are acceptable?
Sol. P(X>4.4) = Φ[(4.4-4)/(0.3)] = Φ(1.33) = 0.90824
P(X<3.5) = Φ[(3.5-4)/(0.3)] = Φ(-1.67) = 0.04746
Hence P(3.5<X<4.4) = 0.90824-0.004746
= 0.86078
The number of acceptable items are therefore = 0.86078*500
=430.39
=430 (rounded
up) ANS.
EXAMPLE 2](https://image.slidesharecdn.com/normaldistribution-191224065855/75/Normal-distribution-19-2048.jpg)


![Engineering Economics: Solved exam problems [ch1-ch4]](https://cdn.slidesharecdn.com/ss_thumbnails/solvedexamproblemsch1-ch4-200220070043-thumbnail.jpg?width=640&height=640&fit=bounds)