1. The document discusses probability mass functions of discrete random variables, including their properties and examples of constructing probability mass functions in tables and histograms.
2. It provides examples of calculating probabilities of discrete random variables like the number of tails in coin flips and the sums of coin flips and die rolls.
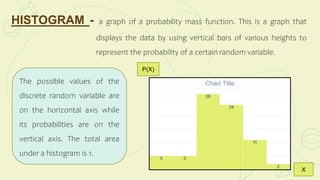
3. The document also covers histograms as a way to graphically represent probability mass functions of discrete random variables.