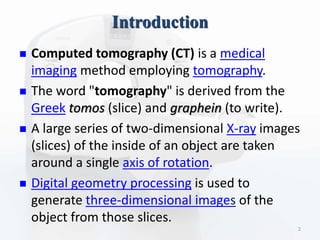
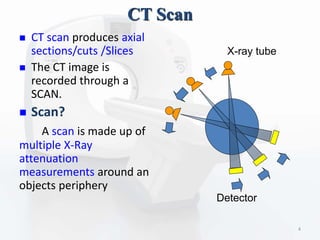
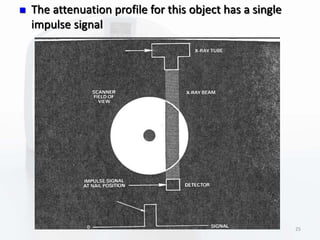
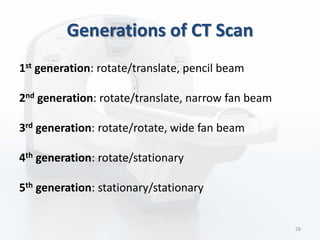
Computed Tomography
Presented by :
120130103071-Nandasana Jay
120130103084-Prajapati Jay
1
Introduction
 Computed tomography (CT) is a medical
imaging method employing tomography.
 The word "tomography" is derived from the
Greek tomos (slice) and graphein (to write).
 A large series of two-dimensional X-ray images
(slices) of the inside of an object are taken
around a single axis of rotation.
 Digital geometry processing is used to
generate three-dimensional images of the
object from those slices.
2
History
 The first commercially viable CT scanner was
invented by Sir Godfrey Hounsfield in Hayes,
United Kingdom at EMI Central Research
Laboratories using X-rays. Hounsfield
conceived his idea in 1967. and it was publicly
announced in 1972.
 Allan McLeod Cormack of Tufts University in
U.S. independently invented a similar process,
and both Hounsfield and Cormack shared the
1979 Nobel Prize in Medicine.
3
CT Scan
 CT scan produces axial
sections/cuts /Slices
 The CT image is
recorded through a
SCAN.
 Scan?
A scan is made up of
multiple X-Ray
attenuation
measurements around an
objects periphery
X-ray tube
Detector
4
Understanding Basic factors
 Absorption :-stopping
of x-rays with transfer
of energy
 Scatter:- deflection of x-
rays
 Incident Intensity :- No.
of x-ray photons falling
on an object
 Transmitted Intensity:-
No. of photons passing
through
Incident x-
ray beam
Transmitted
X-ray beam
Scattered x-rays
5
Attenuation
 The reduction of the
beam intensity on
passing through the
material due to
absorption plus scatter
 The degree of
attenuation is obtained
by measuring and
comparing the incident
and transmitted
intensities
More dense
material
Less dense
material
Less
transmitted
x-rays
More
transmitted
x-rays
6
Slice / Cut
 The cross sectional
portion of the body
which is scanned for the
production of CT image
is called a slice.
 The slice has width and
therefore volume.
 The width is
determined by the
width of the x-ray beam
7
Matrix
 The image is
represented as a
MATRIX of numbers.
 Matrix :- A two
dimensional array of
numbers arranged in
rows and columns.
 Each number
represents the value of
the image at that
location
8
VOXEL
 Each individual element
or number in the image
matrix represents a
three dimensional
volume element in the
object, called a VOXEL
9
PIXEL
 The VOXEL is
represented in the
image as a two-
dimensional element
called PIXEL - (picture
element)
10
CT numbers
 The numbers in the
image matrix are called
CT numbers.
 Each pixel has a number
which represents the x-
ray attenuation in the
corresponding voxel of
the object
11
Visual image & Gray Scale
 To obtain a visual
image, the CT numbers
are assigned different
shades of gray on a gray
scale.
 Each shade of gray
represents the x-ray
attenuation within the
corresponding voxel
12
13
Tissue Types And Appearance
*Cerebrospinal fluid (CSF)
CT Image
14
Phases of CT imaging
1. Scanning the patient
2. Data Acquisition
I. Tube or tube and detector move
II. Multiple attenuation measurements are taken
around the object
3. Image reconstruction
4. Image Display
5. Image archival (recording)
15
DATA ACQUISITION
 Basic components
 X-ray tube
 Collimators
 Detector/s
 Collimated x-ray beam
traverses the object and
enters the detector.
X-ray
tube
Collimators
Detector
16
Practical method of Generation of
Attenuation profiles
 Attenuation profiles are a recording of X-ray attenuation
verses position in the object.
 Attenuation is related to the ratio between incident
intensity (I0) and transmitted intensity (It)
I0
It
17
 X-ray intensity is measured by a DETECTOR which
converts x-ray photons to electrical current
 The reference (Input) detector measures the incident
intensity (I0)
 The output detector measures the transmitted
intensity (It )
I0= incident intensity = tube output
It
18
 I0 should remain constant
 It will change depending on the attenuation of the
object scanned (e.g. centered, round object of
uniform density)
Io=1000
It=1000
It
19
Calibration profile
 If the object scanned is a centered, round water bath
each attenuation profile is called a CALIBRATION PROFILE.
and the set of profiles are called the Calibration File or
Cal file
20
DATA Calibration
 Subtraction of
calibration file
from the
attenuation
profiles of the
object called data
calibration
 (consider an
object containing
two areas of
different densities
as shown)
21
Scan Data File
 The difference profile are stored as numerical values as a
function of position in the profile.
 This data is used in the image reconstruction process
 The set of difference profiles for a complete scan is called
SCAN DATA FILE or raw data
22
Back projection of scan data
1. Back projection of
the corrected
attenuation profiles
is accomplished by
feeding the
numerical values of
each point along the
profile into a matrix.
(Since the scanning
motion is circular,
the matrix is usually
round)
--
23
Formation of Star artifact and streaks
 Consider a
scan of a
single high
density object
suspended in
air
24
 The attenuation profile for this object has a single
impulse signal
25
 Back projections are crated for each profile
26
 Addition of the attenuation profiles create an image
with star and streak artifacts
To be continued – CT Complementary 3 27
Generations of CT Scan
1st generation: rotate/translate, pencil beam
2nd generation: rotate/translate, narrow fan beam
3rd generation: rotate/rotate, wide fan beam
4th generation: rotate/stationary
5th generation: stationary/stationary
28
1st generation: rotate/translate,
pencil beam
• Only 2 x-ray detectors used (two different slices)
• Parallel ray geometry
• About 4.5 minutes/scan with 1.5 minutes to
reconstruct slice
29
2nd generation: rotate/translate,
narrow fan beam
• Incorporated linear array of
30 detectors
• More data acquired to
improve image quality
• Shortest scan time was 18
seconds/slice
• Narrow fan beam allows
more scattered radiation to
be detected
30
3rd generation: rotate/rotate, wide fan
beam
• Number of detectors
increased substantially (to
more than 800 detectors)
• Angle of fan beam
increased to cover entire
patient.
• Mechanically joined x-ray
tube and detector array
rotate together
• Newer systems have scan
times of ½ second
31
4th generation: rotate/stationary
• Designed to overcome the problem of ring
artifacts.
• Stationary ring of about 4,800 detectors
32
5th generation: stationary/stationary
• Developed specifically for cardiac tomographic
imaging
• No conventional x-ray tube; large arc of tungsten
encircles patient and lies directly opposite to the
detector ring
• Electron beam steered around the patient to strike
the annular tungsten target
• Capable of 50-msec scan times.
33
34
Latest update:-
6th generation: helical
7th generation: multiple detector array
35
Modern CT scanner
1. gantry aperture (720mm
diameter)
2. microphone
3. sagittal laser alignment light
4. patient guide lights
5. x-ray exposure indicator light
6. emergency stop buttons
7. gantry control panels
8. external laser alignment lights
9. Patient couch
10. ECG gating monitor
36
Advantages
•Quick and painless
•Can help diagnose and guide
treatment for a wider range of
conditions than plain X-rays
•Can detect or exclude the presence
of more serious problems
•Can be used to check if a previously
treated disease has recurred
Disadvantages
•Small increased risk of cancer in
future from exposure to ionising
radiation (X-rays). Risk is greater for
children
•Uses higher doses of radiation, so the
risks (while still small) are in general
greater than other imaging types
•Injection of a contrast medium (dye)
can cause kidney problems or result in
allergic or injection-site reactions in
some people
•Some procedures require anaesthesia
37
Questions?
38
Thank You……………
39

Computed tomography by jay&jay

  • 1.
    Computed Tomography Presented by: 120130103071-Nandasana Jay 120130103084-Prajapati Jay 1
  • 2.
    Introduction  Computed tomography(CT) is a medical imaging method employing tomography.  The word "tomography" is derived from the Greek tomos (slice) and graphein (to write).  A large series of two-dimensional X-ray images (slices) of the inside of an object are taken around a single axis of rotation.  Digital geometry processing is used to generate three-dimensional images of the object from those slices. 2
  • 3.
    History  The firstcommercially viable CT scanner was invented by Sir Godfrey Hounsfield in Hayes, United Kingdom at EMI Central Research Laboratories using X-rays. Hounsfield conceived his idea in 1967. and it was publicly announced in 1972.  Allan McLeod Cormack of Tufts University in U.S. independently invented a similar process, and both Hounsfield and Cormack shared the 1979 Nobel Prize in Medicine. 3
  • 4.
    CT Scan  CTscan produces axial sections/cuts /Slices  The CT image is recorded through a SCAN.  Scan? A scan is made up of multiple X-Ray attenuation measurements around an objects periphery X-ray tube Detector 4
  • 5.
    Understanding Basic factors Absorption :-stopping of x-rays with transfer of energy  Scatter:- deflection of x- rays  Incident Intensity :- No. of x-ray photons falling on an object  Transmitted Intensity:- No. of photons passing through Incident x- ray beam Transmitted X-ray beam Scattered x-rays 5
  • 6.
    Attenuation  The reductionof the beam intensity on passing through the material due to absorption plus scatter  The degree of attenuation is obtained by measuring and comparing the incident and transmitted intensities More dense material Less dense material Less transmitted x-rays More transmitted x-rays 6
  • 7.
    Slice / Cut The cross sectional portion of the body which is scanned for the production of CT image is called a slice.  The slice has width and therefore volume.  The width is determined by the width of the x-ray beam 7
  • 8.
    Matrix  The imageis represented as a MATRIX of numbers.  Matrix :- A two dimensional array of numbers arranged in rows and columns.  Each number represents the value of the image at that location 8
  • 9.
    VOXEL  Each individualelement or number in the image matrix represents a three dimensional volume element in the object, called a VOXEL 9
  • 10.
    PIXEL  The VOXELis represented in the image as a two- dimensional element called PIXEL - (picture element) 10
  • 11.
    CT numbers  Thenumbers in the image matrix are called CT numbers.  Each pixel has a number which represents the x- ray attenuation in the corresponding voxel of the object 11
  • 12.
    Visual image &Gray Scale  To obtain a visual image, the CT numbers are assigned different shades of gray on a gray scale.  Each shade of gray represents the x-ray attenuation within the corresponding voxel 12
  • 13.
    13 Tissue Types AndAppearance *Cerebrospinal fluid (CSF)
  • 14.
  • 15.
    Phases of CTimaging 1. Scanning the patient 2. Data Acquisition I. Tube or tube and detector move II. Multiple attenuation measurements are taken around the object 3. Image reconstruction 4. Image Display 5. Image archival (recording) 15
  • 16.
    DATA ACQUISITION  Basiccomponents  X-ray tube  Collimators  Detector/s  Collimated x-ray beam traverses the object and enters the detector. X-ray tube Collimators Detector 16
  • 17.
    Practical method ofGeneration of Attenuation profiles  Attenuation profiles are a recording of X-ray attenuation verses position in the object.  Attenuation is related to the ratio between incident intensity (I0) and transmitted intensity (It) I0 It 17
  • 18.
     X-ray intensityis measured by a DETECTOR which converts x-ray photons to electrical current  The reference (Input) detector measures the incident intensity (I0)  The output detector measures the transmitted intensity (It ) I0= incident intensity = tube output It 18
  • 19.
     I0 shouldremain constant  It will change depending on the attenuation of the object scanned (e.g. centered, round object of uniform density) Io=1000 It=1000 It 19
  • 20.
    Calibration profile  Ifthe object scanned is a centered, round water bath each attenuation profile is called a CALIBRATION PROFILE. and the set of profiles are called the Calibration File or Cal file 20
  • 21.
    DATA Calibration  Subtractionof calibration file from the attenuation profiles of the object called data calibration  (consider an object containing two areas of different densities as shown) 21
  • 22.
    Scan Data File The difference profile are stored as numerical values as a function of position in the profile.  This data is used in the image reconstruction process  The set of difference profiles for a complete scan is called SCAN DATA FILE or raw data 22
  • 23.
    Back projection ofscan data 1. Back projection of the corrected attenuation profiles is accomplished by feeding the numerical values of each point along the profile into a matrix. (Since the scanning motion is circular, the matrix is usually round) -- 23
  • 24.
    Formation of Starartifact and streaks  Consider a scan of a single high density object suspended in air 24
  • 25.
     The attenuationprofile for this object has a single impulse signal 25
  • 26.
     Back projectionsare crated for each profile 26
  • 27.
     Addition ofthe attenuation profiles create an image with star and streak artifacts To be continued – CT Complementary 3 27
  • 28.
    Generations of CTScan 1st generation: rotate/translate, pencil beam 2nd generation: rotate/translate, narrow fan beam 3rd generation: rotate/rotate, wide fan beam 4th generation: rotate/stationary 5th generation: stationary/stationary 28
  • 29.
    1st generation: rotate/translate, pencilbeam • Only 2 x-ray detectors used (two different slices) • Parallel ray geometry • About 4.5 minutes/scan with 1.5 minutes to reconstruct slice 29
  • 30.
    2nd generation: rotate/translate, narrowfan beam • Incorporated linear array of 30 detectors • More data acquired to improve image quality • Shortest scan time was 18 seconds/slice • Narrow fan beam allows more scattered radiation to be detected 30
  • 31.
    3rd generation: rotate/rotate,wide fan beam • Number of detectors increased substantially (to more than 800 detectors) • Angle of fan beam increased to cover entire patient. • Mechanically joined x-ray tube and detector array rotate together • Newer systems have scan times of ½ second 31
  • 32.
    4th generation: rotate/stationary •Designed to overcome the problem of ring artifacts. • Stationary ring of about 4,800 detectors 32
  • 33.
    5th generation: stationary/stationary •Developed specifically for cardiac tomographic imaging • No conventional x-ray tube; large arc of tungsten encircles patient and lies directly opposite to the detector ring • Electron beam steered around the patient to strike the annular tungsten target • Capable of 50-msec scan times. 33
  • 34.
  • 35.
    Latest update:- 6th generation:helical 7th generation: multiple detector array 35
  • 36.
    Modern CT scanner 1.gantry aperture (720mm diameter) 2. microphone 3. sagittal laser alignment light 4. patient guide lights 5. x-ray exposure indicator light 6. emergency stop buttons 7. gantry control panels 8. external laser alignment lights 9. Patient couch 10. ECG gating monitor 36
  • 37.
    Advantages •Quick and painless •Canhelp diagnose and guide treatment for a wider range of conditions than plain X-rays •Can detect or exclude the presence of more serious problems •Can be used to check if a previously treated disease has recurred Disadvantages •Small increased risk of cancer in future from exposure to ionising radiation (X-rays). Risk is greater for children •Uses higher doses of radiation, so the risks (while still small) are in general greater than other imaging types •Injection of a contrast medium (dye) can cause kidney problems or result in allergic or injection-site reactions in some people •Some procedures require anaesthesia 37
  • 38.
  • 39.