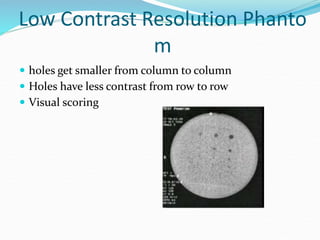
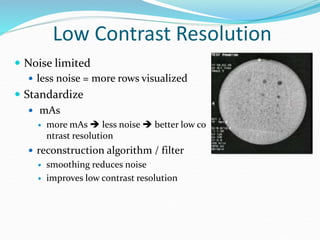
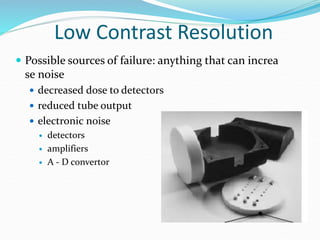
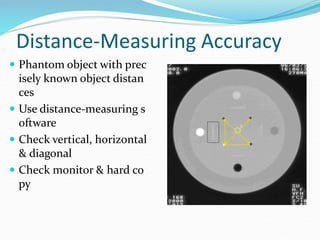
Quality Control
For CT Scanners
SAJID EJAZ
DEPARTMENT OF
RADIOLOGY
Quality Control in CT
 A good idea? Yes
 Required for accreditation? Sometimes
 Improves image quality? Sometimes
 Depends on starting point
 Reduces downtime? Sometimes
 Depends on starting point
 Possible recognition of problems before
 clinical manifestations
 total failure
 may reduce unscheduled downtime
High Contrast Resolution
 Baseline established when scanner in good operati
ng condition
 Subsequent test compared to baseline
CT Quality Control
 Standard protocol required
 same kVp, mAs, scan diameter, slice width, algorith
m, focal spot, filter, etc
 When performed
 At regular intervals
 After major service
 tube change
CT # of Water
 What do we check?
 Average (ideally 0 by definition)
 Standard Deviation (ideally 0)
 Flatness
 ROI’s at various locations in phantom
 Results depend upon protocol
 kVp, mA, scan time
 slice width
 phantom size
 ROI position
 Problem causes
 Mis-calibration
 Noise / drift in detector system
CT # of Water
 Can repeat for various
 Slice thicknesses
 Reconstruction algorithms
 Centering positions
 Phantom diameters
 Fields of view
CT Number Accuracy
 Phantom with several materials of known CT #’s
 Do ROI’s at each and check CT # accuracy
High Contrast (or Limiting) Reso
lution
 Phantom
 rows of equally spaced high contrast objects
 holes get smaller from row to row
 Bars of decreasing size & separation
 Determine smallest row of holes where all
holes can be clearly seen
 smaller holes = better resolution
 Visual scoring
Low Contrast Resolution Phanto
m
 holes get smaller from column to column
 Holes have less contrast from row to row
 Visual scoring
Low Contrast Resolution
 Noise limited
 less noise = more rows visualized
 Standardize
 mAs
 more mAs  less noise  better low co
ntrast resolution
 reconstruction algorithm / filter
 smoothing reduces noise
 improves low contrast resolution
Low Contrast Resolution
 Possible sources of failure: anything that can increa
se noise
 decreased dose to detectors
 reduced tube output
 electronic noise
 detectors
 amplifiers
 A - D convertor
Distance-Measuring Accuracy
 Phantom object with prec
isely known object distan
ces
 Use distance-measuring s
oftware
 Check vertical, horizontal
& diagonal
 Check monitor & hard co
py
Monitor Performance / Hard Copy Output
 Standard gray scale ima
ge needed
 computer generated (S
MPTE pattern)
 Check monitor & hard c
opy
 5% patches
 Contrast patches
 Resolution bars
 Hard copy
 Measure optical densit
y of steps with densito
meter
Slice Localization / Thickness Accuracy
 Phantom with
 slanted wire
 Measure length
 Regularly spaced (in z direction) obj
ects
 count
 Align phantom slice with laser
 Make single scan with known slice t
hickness
Slice Localization / Thickness Accuracy
Table Indexing
 X-ray cassette on table
 Load table with weight
 Select
 multiple scans
 small beam width
 large mm table increment
Table Indexing
 Image should show series of exposed b
ands
 Measure distance between bands
 Possible causes of failure
 slippage of table drive mechanism
 table mis-calibration
Table Backlash
 Does table return to same position
from both directions?
 Test
 Apply masking tape to table
 Load table with weight
 Note numerical position
 Mark tape at starting position usin
g laser position
 Move table away from starting posit
ion & then back to same numerical
location
 Check laser vs. mark on tape
Laser Accuracy
 Align phantom on table m
atching outer laser to exter
nal marks on phantom
 “Zero” table
 Scan phantom
 “0” z-location should sho
w correct phantom position
on image
 Repeat for internal laser
CT Noise Characteristics
 Water phantom
 Multiple scans changing only mAs
 Measure standard deviation of CT #’s using ident
ical ROI’s
 Noise proportional to standard deviation
CT Noise Characteristics
 Excessive noise can be caused by
 detector problems
 electronic noise in detector amplifier circuits
 reduced output per mAs
Ct quality control

Ct quality control

  • 1.
    Quality Control For CTScanners SAJID EJAZ DEPARTMENT OF RADIOLOGY
  • 2.
    Quality Control inCT  A good idea? Yes  Required for accreditation? Sometimes  Improves image quality? Sometimes  Depends on starting point  Reduces downtime? Sometimes  Depends on starting point  Possible recognition of problems before  clinical manifestations  total failure  may reduce unscheduled downtime
  • 3.
    High Contrast Resolution Baseline established when scanner in good operati ng condition  Subsequent test compared to baseline
  • 4.
    CT Quality Control Standard protocol required  same kVp, mAs, scan diameter, slice width, algorith m, focal spot, filter, etc  When performed  At regular intervals  After major service  tube change
  • 5.
    CT # ofWater  What do we check?  Average (ideally 0 by definition)  Standard Deviation (ideally 0)  Flatness  ROI’s at various locations in phantom  Results depend upon protocol  kVp, mA, scan time  slice width  phantom size  ROI position  Problem causes  Mis-calibration  Noise / drift in detector system
  • 6.
    CT # ofWater  Can repeat for various  Slice thicknesses  Reconstruction algorithms  Centering positions  Phantom diameters  Fields of view
  • 7.
    CT Number Accuracy Phantom with several materials of known CT #’s  Do ROI’s at each and check CT # accuracy
  • 8.
    High Contrast (orLimiting) Reso lution  Phantom  rows of equally spaced high contrast objects  holes get smaller from row to row  Bars of decreasing size & separation  Determine smallest row of holes where all holes can be clearly seen  smaller holes = better resolution  Visual scoring
  • 9.
    Low Contrast ResolutionPhanto m  holes get smaller from column to column  Holes have less contrast from row to row  Visual scoring
  • 10.
    Low Contrast Resolution Noise limited  less noise = more rows visualized  Standardize  mAs  more mAs  less noise  better low co ntrast resolution  reconstruction algorithm / filter  smoothing reduces noise  improves low contrast resolution
  • 11.
    Low Contrast Resolution Possible sources of failure: anything that can increa se noise  decreased dose to detectors  reduced tube output  electronic noise  detectors  amplifiers  A - D convertor
  • 12.
    Distance-Measuring Accuracy  Phantomobject with prec isely known object distan ces  Use distance-measuring s oftware  Check vertical, horizontal & diagonal  Check monitor & hard co py
  • 13.
    Monitor Performance /Hard Copy Output  Standard gray scale ima ge needed  computer generated (S MPTE pattern)  Check monitor & hard c opy  5% patches  Contrast patches  Resolution bars  Hard copy  Measure optical densit y of steps with densito meter
  • 14.
    Slice Localization /Thickness Accuracy  Phantom with  slanted wire  Measure length  Regularly spaced (in z direction) obj ects  count  Align phantom slice with laser  Make single scan with known slice t hickness
  • 15.
    Slice Localization /Thickness Accuracy
  • 16.
    Table Indexing  X-raycassette on table  Load table with weight  Select  multiple scans  small beam width  large mm table increment
  • 17.
    Table Indexing  Imageshould show series of exposed b ands  Measure distance between bands  Possible causes of failure  slippage of table drive mechanism  table mis-calibration
  • 18.
    Table Backlash  Doestable return to same position from both directions?  Test  Apply masking tape to table  Load table with weight  Note numerical position  Mark tape at starting position usin g laser position  Move table away from starting posit ion & then back to same numerical location  Check laser vs. mark on tape
  • 19.
    Laser Accuracy  Alignphantom on table m atching outer laser to exter nal marks on phantom  “Zero” table  Scan phantom  “0” z-location should sho w correct phantom position on image  Repeat for internal laser
  • 20.
    CT Noise Characteristics Water phantom  Multiple scans changing only mAs  Measure standard deviation of CT #’s using ident ical ROI’s  Noise proportional to standard deviation
  • 21.
    CT Noise Characteristics Excessive noise can be caused by  detector problems  electronic noise in detector amplifier circuits  reduced output per mAs