Downloaded 90 times


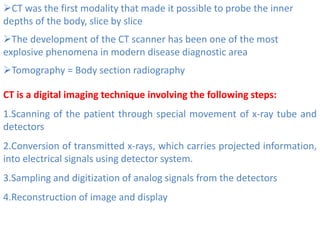


![Convolution can be represented by
P’(x) = FT-1{FT[P(x)] (X) k(x)}
Here P(x) = Projected data at a given angle
k(x) = spatial domain kernel
P’(x) = filtered data in spatial domain
In clinical CT scanners, various filters used such as
oBone filters/Bone kernel
oSoft tissue filters/Soft tissue kernel
Bone kernels have less high frequency roll off where as soft tissue
kernels have more roll off at higher frequencies since for clinical
applications, high contrast resolution is more important than spatial
resolution](https://image.slidesharecdn.com/ctscanner-171226164514/85/CT-scanner-25-320.jpg)
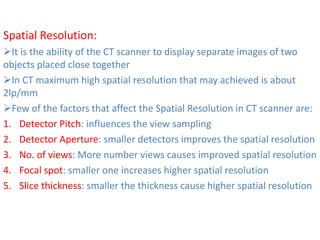
![CT Number:
In image reconstruction, the attenuation coefficients are represented
by a relative quantity called CT number
CT number is the value of the tissue corresponding to the pixel that
is normalized to the value of water (the major component of tissue)
CT Number = [μtissue – μwater /μwater ] x 1000
Here μtissue – linear attenuation co-efficient of tissue
μwater – linear attenuation of co-efficient of water
CT number is expressed in Hounsfield Unit (HU) in honor of the
inventor Godfrey Hounsfield.
CT number for water = 1000 [ (w - w) / w] = 0 HU
CT number for bone = 1000 [ ( 2 w - w) / w] = 1000 HU
( because bone (0.528/cm) is about twice w (0.206/cm)
CT number for air = 1000 [ ( 0 - w) / w] = - 1000 HU
( because air is taken as 0 )](https://image.slidesharecdn.com/ctscanner-171226164514/85/CT-scanner-26-320.jpg)


The document summarizes the history and technology of computed tomography (CT) scanners. It describes how CT was developed in the 1970s by Godfrey Hounsfield and Alan Cormack, who were later awarded the Nobel Prize. It outlines the key innovations in each generation of CT scanners, from the first generation's pencil beam geometry to later generations' use of detector arrays and helical scanning, which reduced scan times. The document also discusses the components of a CT scanner, including the x-ray tube, detectors, and techniques for image reconstruction and calibration.


