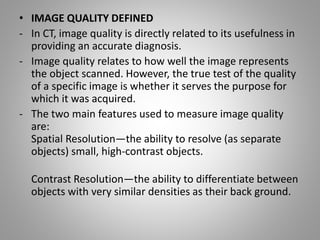
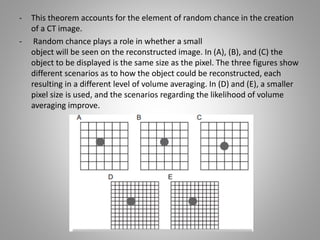
This document discusses factors that impact the image quality in CT scans. It describes key scanning parameters like milliampere, scan time, slice thickness, and reconstruction algorithm that determine image quality. Higher mA and shorter scan times improve image quality but increase radiation dose. Thinner slice thickness and smaller pixel size enhance spatial resolution. The modulation transfer function is used to evaluate a system's ability to resolve fine detail spatially. Selection of these parameters requires balancing optimal image quality with minimizing radiation dose to the patient.


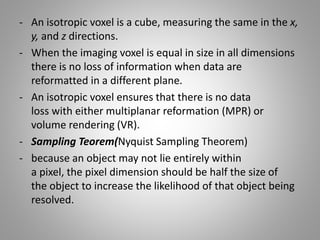
![• Pitch
- Pitch is the relationship between slice thickness and
table travel per rotation during a helical scan
acquisition.
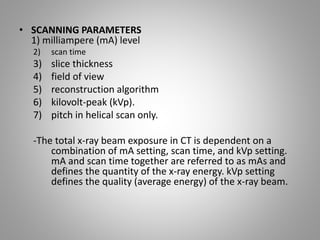
• SCAN GEOMETRY
- Another factor is tube arc (180o,360oand 400o ”
overscan “. full scan [360° (full scan) + 40 (typical
field of view) = 400° scan used in 4th generation].
- Overscan→ overlap of data from the first and last
tube positions, reduced motion artifacts.](https://image.slidesharecdn.com/chapter6imagequality-171027150003/85/Chapter-6-image-quality-in-ct-10-320.jpg)