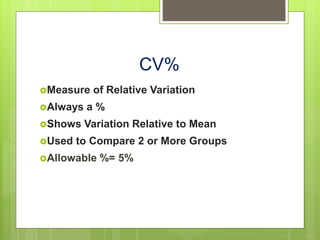
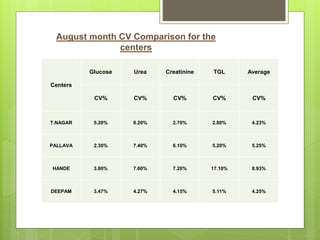
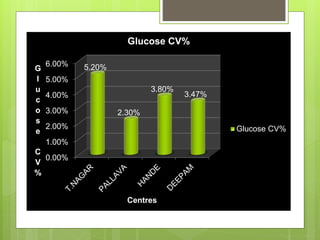
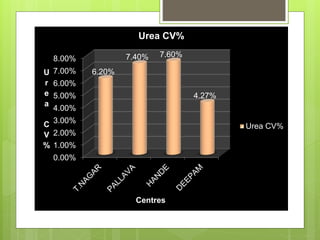
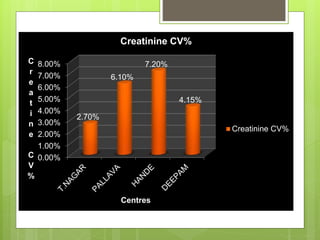
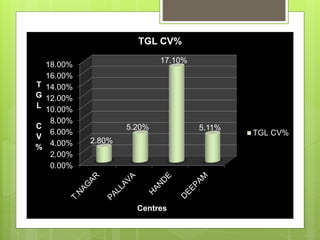
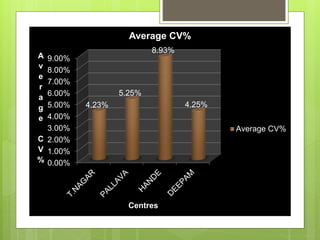
The document discusses the coefficient of variation (CV), which is a measurement used to quantify the amount of variation or dispersion from the average value of a quantitative measurement. The CV is calculated by taking the standard deviation and dividing it by the mean. A lower CV percentage indicates less variation among values. The document provides CV percentages for different clinical parameters like glucose, urea, creatinine, and triglycerides across multiple medical centers for the month of August. The CV can be used to compare the consistency of measurements across different groups.


![CV% Calculation
The Coefficient of Variation [CV] is the ratio of the standard
deviation to the mean and is expressed as a percentage.
CV=SD/MEAN
Other names:
VIS - CMC
Z-Score – Bio Rad](https://image.slidesharecdn.com/32255aae-c01d-4308-9fd9-74c9f5e47448-160207174516/85/CV_ANALYSIS_Thendral_-1-1-4-320.jpg)


![CV_ANALYSIS_Thendral_(1)[1]](https://image.slidesharecdn.com/32255aae-c01d-4308-9fd9-74c9f5e47448-160207174516/85/CV_ANALYSIS_Thendral_-1-1-13-320.jpg)