Download as PPSX, PPTX


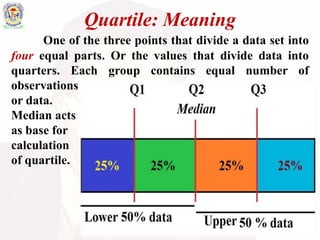
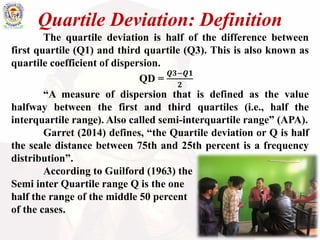
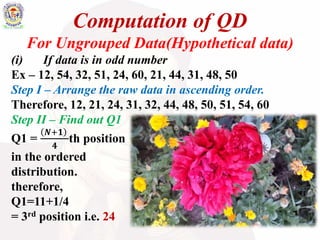
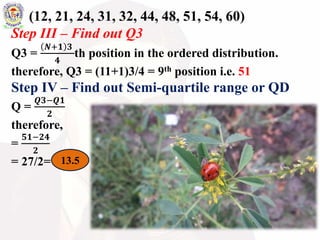
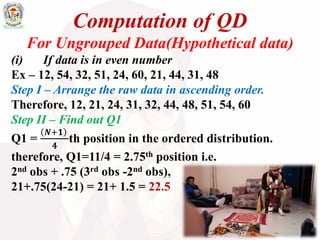
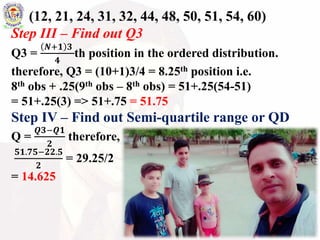
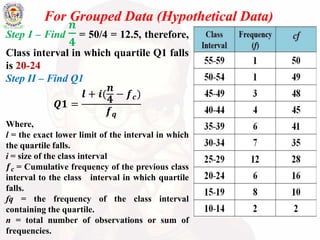
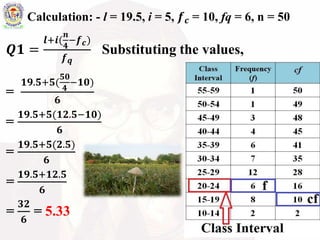
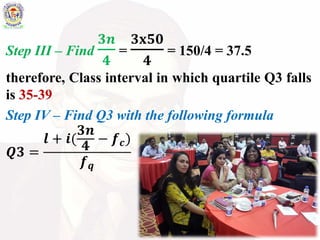
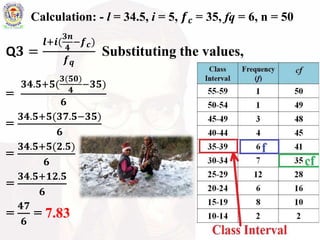


The document explains the concept of quartile and quartile deviation, with quartiles used to divide a data set into four equal parts. The quartile deviation is defined as half the difference between the first quartile (Q1) and the third quartile (Q3), serving as a measure of dispersion in the data set. The text also includes methods for calculating quartile deviation for both ungrouped and grouped data.