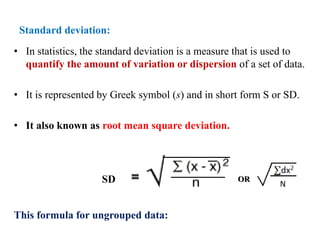
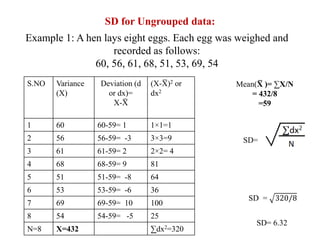
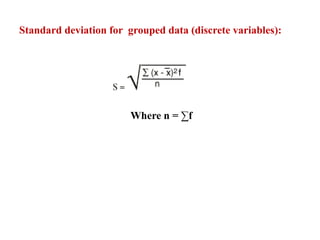
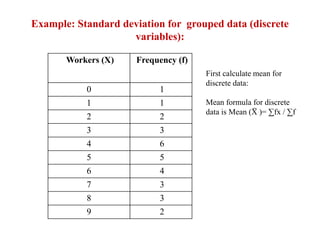
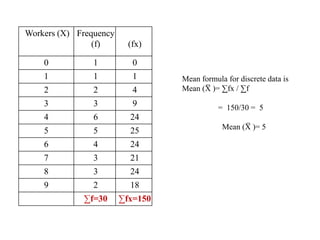
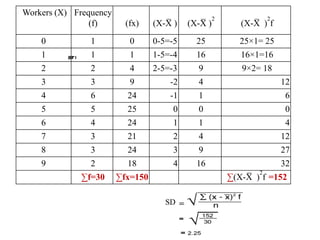
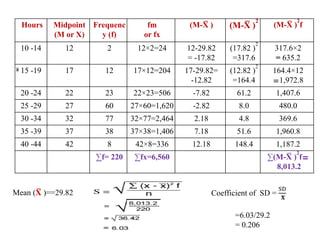
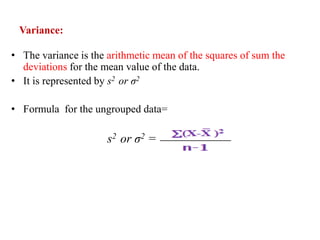
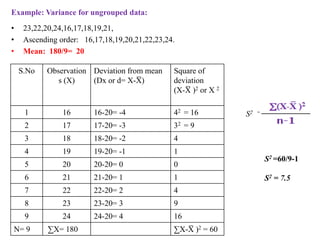
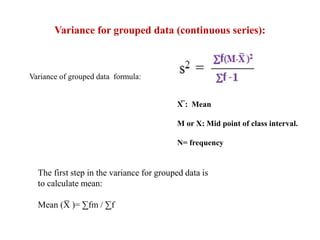
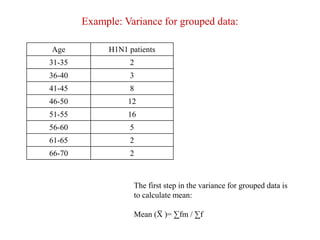
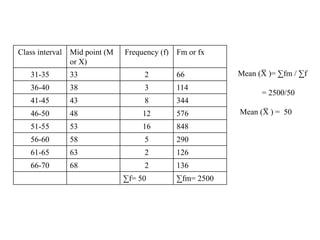
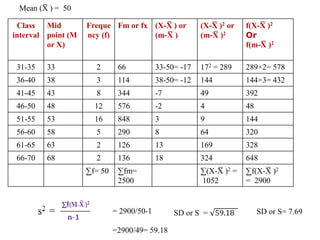
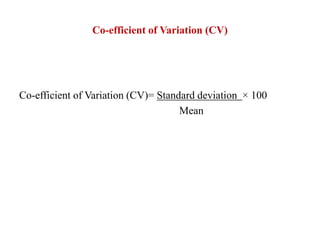
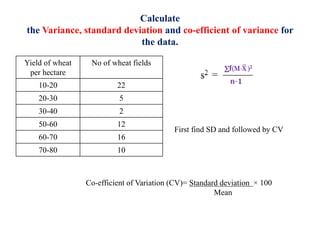
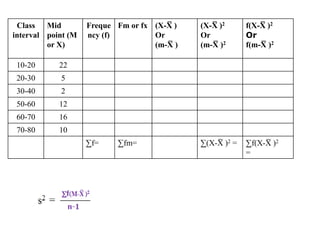
SlideShare a Scribd company logo
1 of 32
Standard Deviation &Variance
Dr. Harinatha Reddy
Sri Krishnadevaraya University
Department of microbiology
Standard deviation:
• In statistics, the standard deviation is a measure that is used to
quantify the amount of variation or dispersion of a set of data.
• It is represented by Greek symbol (s) and in short form S or SD.
• It also known as root mean square deviation.
This formula for ungrouped data:
SD OR
SD for Ungrouped data:
Example 1: A hen lays eight eggs. Each egg was weighed and
recorded as follows:
60, 56, 61, 68, 51, 53, 69, 54
S.NO Variance
(X)
Deviation (d
or dx)=
X-X
̅
(X-X
̅ )2 or
dx2
1 60 60-59= 1 1×1=1
2 56 56-59= -3 3×3=9
3 61 61-59= 2 2×2= 4
4 68 68-59= 9 81
5 51 51-59= -8 64
6 53 53-59= -6 36
7 69 69-59= 10 100
8 54 54-59= -5 25
N=8 X=432 ∑dx2=320
Mean(X
̅ )= ∑X/N
= 432/8
=59
SD=
SD = 320/8
SD= 6.32
Exercise 1: Calculate SD for ungrouped data:
• 10,15,20,25,4,8
Standard deviation for grouped data (discrete variables):
Where n = ∑f
Example: Standard deviation for grouped data (discrete
variables):
Workers (X) Frequency (f)
0 1
1 1
2 2
3 3
4 6
5 5
6 4
7 3
8 3
9 2
First calculate mean for
discrete data:
Mean formula for discrete
data is Mean (X
̅ )= ∑fx / ∑f
Workers (X) Frequency
(f) (fx)
0 1 0
1 1 1
2 2 4
3 3 9
4 6 24
5 5 25
6 4 24
7 3 21
8 3 24
9 2 18
∑f=30 ∑fx=150
Mean formula for discrete data is
Mean (X
̅ )= ∑fx / ∑f
= 150/30 = 5
Mean (X
̅ )= 5
Workers (X) Frequency
(f) (fx) (X-X
̅ ) (X-X
̅ )
2
(X-X
̅ )
2
f
0 1 0 0-5=-5 25 25×1= 25
1 1 1 1-5=-4 16 16×1=16
2 2 4 2-5=-3 9 9×2= 18
3 3 9 -2 4 12
4 6 24 -1 1 6
5 5 25 0 0 0
6 4 24 1 1 4
7 3 21 2 4 12
8 3 24 3 9 27
9 2 18 4 16 32
∑f=30 ∑fx=150 ∑(X-X
̅ )
2
f =152
SD
Exercise 1: Calculate SD for following discrete data
Blood cells No of days
90 5
55 9
60 5
70 4
80 10
100 20
Standard deviation for grouped Data
(Continuous serious)
Standard deviation for grouped Data
Hours Number of
students
10 -14 2
15 -19 12
20 -24 23
25-29 60
30-34 77
35-39 38
40 -44 8
Table 1. Number of hours per week spent
watching television
First calculate Mean (x
̅ )= ∑f.m / ∑f
M= Middle values of class (It also mention as X)
Hours Number of
students
10 -14 2
15 -19 12
20 -24 23
25-29 60
30-34 77
35-39 38
40 -44 8
First calculate Mean (x
̅ )= ∑f.m / ∑f
M= Middle values of class (It also mention as X)
Hours Midpoint
(x)
Frequenc
y (f)
fx
10 to 14 12 2 24
15 to 19 17 12 204
20 to 24 22 23 506
25 to 29 27 60 1,620
30 to 34 32 77 2,464
35 to 39 37 38 1,406
40 to 44 42 8 336
∑f= 220 ∑fx=6,560
Mean (x
̅ )= ∑f.m / ∑f
= 6560/220
=29.82
Hours Midpoint
(M or X)
Frequenc
y (f)
fm
or fx
(M-X
̅ ) (M-X
̅ )
2
(M-X
̅ )
2
f
10 -14 12 2 12×2=24 12-29.82
= -17.82
(17.82 )
2
=317.6
317.6×2
= 635.2
15 -19 17 12 17×12=204 17-29.82=
-12.82
(12.82 )
2
=164.4
164.4×12
=1,972.8
20 -24 22 23 22×23=506 -7.82 61.2 1,407.6
25 -29 27 60 27×60=1,620 -2.82 8.0 480.0
30 -34 32 77 32×77=2,464 2.18 4.8 369.6
35 -39 37 38 37×38=1,406 7.18 51.6 1,960.8
40 -44 42 8 42×8=336 12.18 148.4 1,187.2
∑f= 220 ∑fx=6,560 ∑(M-X
̅ )
2
f=
8,013.2
Mean (x)==29.82
SD
Where n = ∑f
M written as X in the equation
(Middle point (M) of the class also called as X)
SD
Coefficient of standard deviation
Coefficient of standard deviation=
Standard deviation (SD)
Arithmetic mean (𝐗̅ )
=
SD
𝐗̅
Hours Midpoint
(M or X)
Frequenc
y (f)
fm
or fx
(M-X
̅ ) (M-X
̅ )
2
(M-X
̅ )
2
f
10 -14 12 2 12×2=24 12-29.82
= -17.82
(17.82 )
2
=317.6
317.6×2
= 635.2
15 -19 17 12 17×12=204 17-29.82=
-12.82
(12.82 )
2
=164.4
164.4×12
=1,972.8
20 -24 22 23 22×23=506 -7.82 61.2 1,407.6
25 -29 27 60 27×60=1,620 -2.82 8.0 480.0
30 -34 32 77 32×77=2,464 2.18 4.8 369.6
35 -39 37 38 37×38=1,406 7.18 51.6 1,960.8
40 -44 42 8 42×8=336 12.18 148.4 1,187.2
∑f= 220 ∑fx=6,560 ∑(M-X
̅ )
2
f=
8,013.2
Mean (X
̅ )==29.82 Coefficient of SD =
SD
𝐗̅
=6.03/29.2
= 0.206
Uses of Standard deviation:
• Standard deviation is based on all the observations.
• Of all the measures of dispersion, standard deviation is best
because it is least effected by fluctuations.
• It used in the finding of standard error.
Variance
Variance:
• The variance is the arithmetic mean of the squares of sum the
deviations for the mean value of the data.
• It is represented by s2 or σ2
• Formula for the ungrouped data=
s2 or σ2 =
• Ascending order: 16,17,18,19,20,21,22,23,24.
Example: Variance for ungrouped data:
• 23,22,20,24,16,17,18,19,21,
• Ascending order: 16,17,18,19,20,21,22,23,24.
• Mean: 180/9= 20
S.No Observation
s (X)
Deviation from mean
(Dx or d= X-X
̅ )
Square of
deviation
(X-X
̅ )2 or X 2
1 16 16-20= -4 42 = 16
2 17 17-20= -3 32 = 9
3 18 18-20= -2 4
4 19 19-20= -1 1
5 20 20-20= 0 0
6 21 21-20= 1 1
7 22 22-20= 2 4
8 23 23-20= 3 9
9 24 24-20= 4 16
N= 9 ∑X= 180 ∑X-X
̅ )2 = 60
S2 =
S2 =60/9-1
S2 = 7.5
Exercise 1 : Variance for ungrouped data:
• 10,2,8,6,15,20,4,5
• Calculate variance for ungrouped data:
Variance for grouped data (continuous series):
Variance of grouped data formula:
X̅ : Mean
M or X: Mid point of class interval.
N= frequency
The first step in the variance for grouped data is
to calculate mean:
Mean (X
̅ )= ∑fm / ∑f
Example: Variance for grouped data:
Age H1N1 patients
31-35 2
36-40 3
41-45 8
46-50 12
51-55 16
56-60 5
61-65 2
66-70 2
The first step in the variance for grouped data is
to calculate mean:
Mean (X
̅ )= ∑fm / ∑f
Class interval Mid point (M
or X)
Frequency (f) Fm or fx
31-35 33 2 66
36-40 38 3 114
41-45 43 8 344
46-50 48 12 576
51-55 53 16 848
56-60 58 5 290
61-65 63 2 126
66-70 68 2 136
∑f= 50 ∑fm= 2500
Mean (X
̅ )= ∑fm / ∑f
= 2500/50
Mean (X
̅ ) = 50
Mean (X
̅ ) = 50
Class
interval
Mid
point (M
or X)
Freque
ncy (f)
Fm or fx (X-X
̅ ) or
(m-X
̅ )
(X-X
̅ )2 or
(m-X
̅ )2
f(X-X
̅ )2
Or
f(m-X
̅ )2
31-35 33 2 66 33-50= -17 172 = 289 289×2= 578
36-40 38 3 114 38-50= -12 144 144×3= 432
41-45 43 8 344 -7 49 392
46-50 48 12 576 -2 4 48
51-55 53 16 848 3 9 144
56-60 58 5 290 8 64 320
61-65 63 2 126 13 169 328
66-70 68 2 136 18 324 648
∑f= 50 ∑fm=
2500
∑(X-X
̅ )2 =
1052
∑f(X-X
̅ )2
= 2900
= 2900/50-1
=2900/49= 59.18
SD or S = 59.18 SD or S= 7.69
Co-efficient of Variation (CV)
Co-efficient of Variation (CV)= Standard deviation × 100
Mean
Calculate
the Variance, standard deviation and co-efficient of variance for
the data.
Yield of wheat
per hectare
No of wheat fields
10-20 22
20-30 5
30-40 2
50-60 12
60-70 16
70-80 10
First find SD and followed by CV
Co-efficient of Variation (CV)= Standard deviation × 100
Mean
Class
interval
Mid
point (M
or X)
Freque
ncy (f)
Fm or fx (X-X
̅ )
Or
(m-X
̅ )
(X-X
̅ )2
Or
(m-X
̅ )2
f(X-X
̅ )2
Or
f(m-X
̅ )2
10-20 22
20-30 5
30-40 2
50-60 12
60-70 16
70-80 10
∑f= ∑fm= ∑(X-X
̅ )2 = ∑f(X-X
̅ )2
=
Significance of Variance:
• It is easy to calculate.
• It indicates the variability clearly.
• The variance is the most informative among the measures of
dispersion for populations.
• It is most frequently used measure of variation in data especially
with normal, binomial or Poisson distribution.
Standard Deviation, Variance, Coefficient of Variation

More Related Content

What's hot (20)

Analysis of variance anova
Analysis of variance anovaAnalysis of variance anova
Analysis of variance anova
 
2. measures of dis[persion
2. measures of dis[persion2. measures of dis[persion
2. measures of dis[persion
 
mean median mode
 mean median mode mean median mode
mean median mode
 
Statistics-Measures of dispersions
Statistics-Measures of dispersionsStatistics-Measures of dispersions
Statistics-Measures of dispersions
 
MEAN DEVIATION
MEAN DEVIATIONMEAN DEVIATION
MEAN DEVIATION
 
Chi square
Chi squareChi square
Chi square
 
Mean Deviation
Mean DeviationMean Deviation
Mean Deviation
 
The Binomial, Poisson, and Normal Distributions
The Binomial, Poisson, and Normal DistributionsThe Binomial, Poisson, and Normal Distributions
The Binomial, Poisson, and Normal Distributions
 
Analysis of variance
Analysis of varianceAnalysis of variance
Analysis of variance
 
Standard deviation
Standard deviationStandard deviation
Standard deviation
 
Standard Deviation.ppt
Standard Deviation.pptStandard Deviation.ppt
Standard Deviation.ppt
 
Lec. biostatistics introduction
Lec. biostatistics  introductionLec. biostatistics  introduction
Lec. biostatistics introduction
 
Analysis of variance (ANOVA)
Analysis of variance (ANOVA)Analysis of variance (ANOVA)
Analysis of variance (ANOVA)
 
The mann whitney u test
The mann whitney u testThe mann whitney u test
The mann whitney u test
 
Measures of dispersion
Measures of dispersionMeasures of dispersion
Measures of dispersion
 
Regression and corelation (Biostatistics)
Regression and corelation (Biostatistics)Regression and corelation (Biostatistics)
Regression and corelation (Biostatistics)
 
{ANOVA} PPT-1.pptx
{ANOVA} PPT-1.pptx{ANOVA} PPT-1.pptx
{ANOVA} PPT-1.pptx
 
F test
F testF test
F test
 
Measures of dispersion
Measures of dispersionMeasures of dispersion
Measures of dispersion
 
F test and ANOVA
F test and ANOVAF test and ANOVA
F test and ANOVA
 

Similar to Standard Deviation, Variance, Coefficient of Variation

Quantitative techniques for MBA (QDM)
Quantitative techniques for MBA (QDM)Quantitative techniques for MBA (QDM)
Quantitative techniques for MBA (QDM)npazare
 
Solution Manual : Chapter - 06 Application of the Definite Integral in Geomet...
Solution Manual : Chapter - 06 Application of the Definite Integral in Geomet...Solution Manual : Chapter - 06 Application of the Definite Integral in Geomet...
Solution Manual : Chapter - 06 Application of the Definite Integral in Geomet...Hareem Aslam
 
resposta do capitulo 15
resposta do capitulo 15resposta do capitulo 15
resposta do capitulo 15silvio_sas
 
Normal probability distribution
Normal probability distributionNormal probability distribution
Normal probability distributionNadeem Uddin
 
Standard normal distribution
Standard normal distributionStandard normal distribution
Standard normal distributionNadeem Uddin
 
Measures of dispersion - united world school of business
Measures of dispersion -  united world school of businessMeasures of dispersion -  united world school of business
Measures of dispersion - united world school of businessUnitedworld School Of Business
 
Measures of dispersion unitedworld school of business
Measures of dispersion   unitedworld school of businessMeasures of dispersion   unitedworld school of business
Measures of dispersion unitedworld school of businessArnab Roy Chowdhury
 
Spearman rank correlation coefficient
Spearman rank correlation coefficientSpearman rank correlation coefficient
Spearman rank correlation coefficientWaleed Zaghal
 
AN OVERVIEW OF SKEWNESS AND KURTOSIS.pptx
AN OVERVIEW OF SKEWNESS AND KURTOSIS.pptxAN OVERVIEW OF SKEWNESS AND KURTOSIS.pptx
AN OVERVIEW OF SKEWNESS AND KURTOSIS.pptxCHIRANTANMONDAL2
 
Howard, anton calculo i- um novo horizonte - exercicio resolvidos v1
Howard, anton   calculo i- um novo horizonte - exercicio resolvidos v1Howard, anton   calculo i- um novo horizonte - exercicio resolvidos v1
Howard, anton calculo i- um novo horizonte - exercicio resolvidos v1cideni
 
2014 st josephs geelong spec maths
2014 st josephs geelong spec maths2014 st josephs geelong spec maths
2014 st josephs geelong spec mathsAndrew Smith
 
Standard Deviation and Variance
Standard Deviation and VarianceStandard Deviation and Variance
Standard Deviation and VarianceRobbie Jule
 

Similar to Standard Deviation, Variance, Coefficient of Variation (20)

S7 pn
S7 pnS7 pn
S7 pn
 
Standard deviation
Standard deviationStandard deviation
Standard deviation
 
Quantitative techniques for MBA (QDM)
Quantitative techniques for MBA (QDM)Quantitative techniques for MBA (QDM)
Quantitative techniques for MBA (QDM)
 
Solution Manual : Chapter - 06 Application of the Definite Integral in Geomet...
Solution Manual : Chapter - 06 Application of the Definite Integral in Geomet...Solution Manual : Chapter - 06 Application of the Definite Integral in Geomet...
Solution Manual : Chapter - 06 Application of the Definite Integral in Geomet...
 
Tugas blog-matematika
Tugas blog-matematikaTugas blog-matematika
Tugas blog-matematika
 
resposta do capitulo 15
resposta do capitulo 15resposta do capitulo 15
resposta do capitulo 15
 
Normal probability distribution
Normal probability distributionNormal probability distribution
Normal probability distribution
 
Standard normal distribution
Standard normal distributionStandard normal distribution
Standard normal distribution
 
Measures of dispersion - united world school of business
Measures of dispersion -  united world school of businessMeasures of dispersion -  united world school of business
Measures of dispersion - united world school of business
 
Measures of dispersion unitedworld school of business
Measures of dispersion   unitedworld school of businessMeasures of dispersion   unitedworld school of business
Measures of dispersion unitedworld school of business
 
Dispersion
DispersionDispersion
Dispersion
 
Dispersion uwsb
Dispersion   uwsbDispersion   uwsb
Dispersion uwsb
 
Spearman rank correlation coefficient
Spearman rank correlation coefficientSpearman rank correlation coefficient
Spearman rank correlation coefficient
 
AN OVERVIEW OF SKEWNESS AND KURTOSIS.pptx
AN OVERVIEW OF SKEWNESS AND KURTOSIS.pptxAN OVERVIEW OF SKEWNESS AND KURTOSIS.pptx
AN OVERVIEW OF SKEWNESS AND KURTOSIS.pptx
 
Howard, anton calculo i- um novo horizonte - exercicio resolvidos v1
Howard, anton   calculo i- um novo horizonte - exercicio resolvidos v1Howard, anton   calculo i- um novo horizonte - exercicio resolvidos v1
Howard, anton calculo i- um novo horizonte - exercicio resolvidos v1
 
2014 st josephs geelong spec maths
2014 st josephs geelong spec maths2014 st josephs geelong spec maths
2014 st josephs geelong spec maths
 
Standard Deviation and Variance
Standard Deviation and VarianceStandard Deviation and Variance
Standard Deviation and Variance
 
Central tedancy & correlation project - 2
Central tedancy & correlation project - 2Central tedancy & correlation project - 2
Central tedancy & correlation project - 2
 
Estadistica U4
Estadistica U4Estadistica U4
Estadistica U4
 
Maths05
Maths05Maths05
Maths05
 

More from HARINATHA REDDY ASWARTHA

Classification and nomenclature of enzymes
Classification and nomenclature of enzymesClassification and nomenclature of enzymes
Classification and nomenclature of enzymesHARINATHA REDDY ASWARTHA
 
Structure of proteins and nature of bond linking monomers in a polymer
Structure of proteins and nature of bond linking monomers in a polymerStructure of proteins and nature of bond linking monomers in a polymer
Structure of proteins and nature of bond linking monomers in a polymerHARINATHA REDDY ASWARTHA
 
FOXP2 gene mutated in a speech and language disorder
FOXP2 gene mutated in a speech and language disorderFOXP2 gene mutated in a speech and language disorder
FOXP2 gene mutated in a speech and language disorderHARINATHA REDDY ASWARTHA
 
Stress physiology and extremophiles in microbes
Stress physiology and extremophiles in microbesStress physiology and extremophiles in microbes
Stress physiology and extremophiles in microbesHARINATHA REDDY ASWARTHA
 
Structural features and classification of fungi
Structural features and classification of fungiStructural features and classification of fungi
Structural features and classification of fungiHARINATHA REDDY ASWARTHA
 
Mycorrhizae ecto and endo mycorrhizae significance
Mycorrhizae ecto and endo mycorrhizae significanceMycorrhizae ecto and endo mycorrhizae significance
Mycorrhizae ecto and endo mycorrhizae significanceHARINATHA REDDY ASWARTHA
 
Symbiotic algae, Measurement of algal growth, Algal strain selection, Cultiva...
Symbiotic algae, Measurement of algal growth, Algal strain selection, Cultiva...Symbiotic algae, Measurement of algal growth, Algal strain selection, Cultiva...
Symbiotic algae, Measurement of algal growth, Algal strain selection, Cultiva...HARINATHA REDDY ASWARTHA
 
Algae classification features and reproduction of algae
Algae classification features and reproduction of algae Algae classification features and reproduction of algae
Algae classification features and reproduction of algae HARINATHA REDDY ASWARTHA
 

More from HARINATHA REDDY ASWARTHA (20)

SWINE FLU virus and its origin influenza
SWINE FLU virus and its origin influenzaSWINE FLU virus and its origin influenza
SWINE FLU virus and its origin influenza
 
Solid-liquid separation.pptx
Solid-liquid separation.pptxSolid-liquid separation.pptx
Solid-liquid separation.pptx
 
Living state and enzyme introduction
Living state and enzyme introductionLiving state and enzyme introduction
Living state and enzyme introduction
 
Factors effect enzyme function
Factors effect enzyme functionFactors effect enzyme function
Factors effect enzyme function
 
Classification and nomenclature of enzymes
Classification and nomenclature of enzymesClassification and nomenclature of enzymes
Classification and nomenclature of enzymes
 
Biomolecules introduction
Biomolecules introductionBiomolecules introduction
Biomolecules introduction
 
Biomacromolecules and nucleic acids
Biomacromolecules and nucleic acidsBiomacromolecules and nucleic acids
Biomacromolecules and nucleic acids
 
Structure of proteins and nature of bond linking monomers in a polymer
Structure of proteins and nature of bond linking monomers in a polymerStructure of proteins and nature of bond linking monomers in a polymer
Structure of proteins and nature of bond linking monomers in a polymer
 
Corona virus COVID19
Corona virus COVID19Corona virus COVID19
Corona virus COVID19
 
FOXP2 gene mutated in a speech and language disorder
FOXP2 gene mutated in a speech and language disorderFOXP2 gene mutated in a speech and language disorder
FOXP2 gene mutated in a speech and language disorder
 
Growth curve of bacteria
Growth curve of bacteriaGrowth curve of bacteria
Growth curve of bacteria
 
Antibiotic types and mechanism of action
Antibiotic types and mechanism of actionAntibiotic types and mechanism of action
Antibiotic types and mechanism of action
 
Nutritional classification of bacteria
Nutritional classification of bacteriaNutritional classification of bacteria
Nutritional classification of bacteria
 
Structure of bacteria
Structure of bacteriaStructure of bacteria
Structure of bacteria
 
Stress physiology and extremophiles in microbes
Stress physiology and extremophiles in microbesStress physiology and extremophiles in microbes
Stress physiology and extremophiles in microbes
 
Quorum sensing and its significance
Quorum sensing and its significanceQuorum sensing and its significance
Quorum sensing and its significance
 
Structural features and classification of fungi
Structural features and classification of fungiStructural features and classification of fungi
Structural features and classification of fungi
 
Mycorrhizae ecto and endo mycorrhizae significance
Mycorrhizae ecto and endo mycorrhizae significanceMycorrhizae ecto and endo mycorrhizae significance
Mycorrhizae ecto and endo mycorrhizae significance
 
Symbiotic algae, Measurement of algal growth, Algal strain selection, Cultiva...
Symbiotic algae, Measurement of algal growth, Algal strain selection, Cultiva...Symbiotic algae, Measurement of algal growth, Algal strain selection, Cultiva...
Symbiotic algae, Measurement of algal growth, Algal strain selection, Cultiva...
 
Algae classification features and reproduction of algae
Algae classification features and reproduction of algae Algae classification features and reproduction of algae
Algae classification features and reproduction of algae
 

Recently uploaded

Enzyme, Pharmaceutical Aids, Miscellaneous Last Part of Chapter no 5th.pdf
Enzyme, Pharmaceutical Aids, Miscellaneous Last Part of Chapter no 5th.pdfEnzyme, Pharmaceutical Aids, Miscellaneous Last Part of Chapter no 5th.pdf
Enzyme, Pharmaceutical Aids, Miscellaneous Last Part of Chapter no 5th.pdfSumit Tiwari
 
18-04-UA_REPORT_MEDIALITERAСY_INDEX-DM_23-1-final-eng.pdf
18-04-UA_REPORT_MEDIALITERAСY_INDEX-DM_23-1-final-eng.pdf18-04-UA_REPORT_MEDIALITERAСY_INDEX-DM_23-1-final-eng.pdf
18-04-UA_REPORT_MEDIALITERAСY_INDEX-DM_23-1-final-eng.pdfssuser54595a
 
Capitol Tech U Doctoral Presentation - April 2024.pptx
Capitol Tech U Doctoral Presentation - April 2024.pptxCapitol Tech U Doctoral Presentation - April 2024.pptx
Capitol Tech U Doctoral Presentation - April 2024.pptxCapitolTechU
 
Painted Grey Ware.pptx, PGW Culture of India
Painted Grey Ware.pptx, PGW Culture of IndiaPainted Grey Ware.pptx, PGW Culture of India
Painted Grey Ware.pptx, PGW Culture of IndiaVirag Sontakke
 
POINT- BIOCHEMISTRY SEM 2 ENZYMES UNIT 5.pptx
POINT- BIOCHEMISTRY SEM 2 ENZYMES UNIT 5.pptxPOINT- BIOCHEMISTRY SEM 2 ENZYMES UNIT 5.pptx
POINT- BIOCHEMISTRY SEM 2 ENZYMES UNIT 5.pptxSayali Powar
 
Presiding Officer Training module 2024 lok sabha elections
Presiding Officer Training module 2024 lok sabha electionsPresiding Officer Training module 2024 lok sabha elections
Presiding Officer Training module 2024 lok sabha electionsanshu789521
 
DATA STRUCTURE AND ALGORITHM for beginners
DATA STRUCTURE AND ALGORITHM for beginnersDATA STRUCTURE AND ALGORITHM for beginners
DATA STRUCTURE AND ALGORITHM for beginnersSabitha Banu
 
Full Stack Web Development Course for Beginners
Full Stack Web Development Course  for BeginnersFull Stack Web Development Course  for Beginners
Full Stack Web Development Course for BeginnersSabitha Banu
 
Types of Journalistic Writing Grade 8.pptx
Types of Journalistic Writing Grade 8.pptxTypes of Journalistic Writing Grade 8.pptx
Types of Journalistic Writing Grade 8.pptxEyham Joco
 
CELL CYCLE Division Science 8 quarter IV.pptx
CELL CYCLE Division Science 8 quarter IV.pptxCELL CYCLE Division Science 8 quarter IV.pptx
CELL CYCLE Division Science 8 quarter IV.pptxJiesonDelaCerna
 
Introduction to AI in Higher Education_draft.pptx
Introduction to AI in Higher Education_draft.pptxIntroduction to AI in Higher Education_draft.pptx
Introduction to AI in Higher Education_draft.pptxpboyjonauth
 
KSHARA STURA .pptx---KSHARA KARMA THERAPY (CAUSTIC THERAPY)————IMP.OF KSHARA ...
KSHARA STURA .pptx---KSHARA KARMA THERAPY (CAUSTIC THERAPY)————IMP.OF KSHARA ...KSHARA STURA .pptx---KSHARA KARMA THERAPY (CAUSTIC THERAPY)————IMP.OF KSHARA ...
KSHARA STURA .pptx---KSHARA KARMA THERAPY (CAUSTIC THERAPY)————IMP.OF KSHARA ...M56BOOKSTORE PRODUCT/SERVICE
 
How to Configure Email Server in Odoo 17
How to Configure Email Server in Odoo 17How to Configure Email Server in Odoo 17
How to Configure Email Server in Odoo 17Celine George
 
Software Engineering Methodologies (overview)
Software Engineering Methodologies (overview)Software Engineering Methodologies (overview)
Software Engineering Methodologies (overview)eniolaolutunde
 
Framing an Appropriate Research Question 6b9b26d93da94caf993c038d9efcdedb.pdf
Framing an Appropriate Research Question 6b9b26d93da94caf993c038d9efcdedb.pdfFraming an Appropriate Research Question 6b9b26d93da94caf993c038d9efcdedb.pdf
Framing an Appropriate Research Question 6b9b26d93da94caf993c038d9efcdedb.pdfUjwalaBharambe
 
MARGINALIZATION (Different learners in Marginalized Group
MARGINALIZATION (Different learners in Marginalized GroupMARGINALIZATION (Different learners in Marginalized Group
MARGINALIZATION (Different learners in Marginalized GroupJonathanParaisoCruz
 

Recently uploaded (20)

OS-operating systems- ch04 (Threads) ...
OS-operating systems- ch04 (Threads) ...OS-operating systems- ch04 (Threads) ...
OS-operating systems- ch04 (Threads) ...
 
Enzyme, Pharmaceutical Aids, Miscellaneous Last Part of Chapter no 5th.pdf
Enzyme, Pharmaceutical Aids, Miscellaneous Last Part of Chapter no 5th.pdfEnzyme, Pharmaceutical Aids, Miscellaneous Last Part of Chapter no 5th.pdf
Enzyme, Pharmaceutical Aids, Miscellaneous Last Part of Chapter no 5th.pdf
 
Model Call Girl in Bikash Puri Delhi reach out to us at 🔝9953056974🔝
Model Call Girl in Bikash Puri  Delhi reach out to us at 🔝9953056974🔝Model Call Girl in Bikash Puri  Delhi reach out to us at 🔝9953056974🔝
Model Call Girl in Bikash Puri Delhi reach out to us at 🔝9953056974🔝
 
18-04-UA_REPORT_MEDIALITERAСY_INDEX-DM_23-1-final-eng.pdf
18-04-UA_REPORT_MEDIALITERAСY_INDEX-DM_23-1-final-eng.pdf18-04-UA_REPORT_MEDIALITERAСY_INDEX-DM_23-1-final-eng.pdf
18-04-UA_REPORT_MEDIALITERAСY_INDEX-DM_23-1-final-eng.pdf
 
Capitol Tech U Doctoral Presentation - April 2024.pptx
Capitol Tech U Doctoral Presentation - April 2024.pptxCapitol Tech U Doctoral Presentation - April 2024.pptx
Capitol Tech U Doctoral Presentation - April 2024.pptx
 
Painted Grey Ware.pptx, PGW Culture of India
Painted Grey Ware.pptx, PGW Culture of IndiaPainted Grey Ware.pptx, PGW Culture of India
Painted Grey Ware.pptx, PGW Culture of India
 
POINT- BIOCHEMISTRY SEM 2 ENZYMES UNIT 5.pptx
POINT- BIOCHEMISTRY SEM 2 ENZYMES UNIT 5.pptxPOINT- BIOCHEMISTRY SEM 2 ENZYMES UNIT 5.pptx
POINT- BIOCHEMISTRY SEM 2 ENZYMES UNIT 5.pptx
 
Presiding Officer Training module 2024 lok sabha elections
Presiding Officer Training module 2024 lok sabha electionsPresiding Officer Training module 2024 lok sabha elections
Presiding Officer Training module 2024 lok sabha elections
 
DATA STRUCTURE AND ALGORITHM for beginners
DATA STRUCTURE AND ALGORITHM for beginnersDATA STRUCTURE AND ALGORITHM for beginners
DATA STRUCTURE AND ALGORITHM for beginners
 
ESSENTIAL of (CS/IT/IS) class 06 (database)
ESSENTIAL of (CS/IT/IS) class 06 (database)ESSENTIAL of (CS/IT/IS) class 06 (database)
ESSENTIAL of (CS/IT/IS) class 06 (database)
 
Model Call Girl in Tilak Nagar Delhi reach out to us at 🔝9953056974🔝
Model Call Girl in Tilak Nagar Delhi reach out to us at 🔝9953056974🔝Model Call Girl in Tilak Nagar Delhi reach out to us at 🔝9953056974🔝
Model Call Girl in Tilak Nagar Delhi reach out to us at 🔝9953056974🔝
 
Full Stack Web Development Course for Beginners
Full Stack Web Development Course  for BeginnersFull Stack Web Development Course  for Beginners
Full Stack Web Development Course for Beginners
 
Types of Journalistic Writing Grade 8.pptx
Types of Journalistic Writing Grade 8.pptxTypes of Journalistic Writing Grade 8.pptx
Types of Journalistic Writing Grade 8.pptx
 
CELL CYCLE Division Science 8 quarter IV.pptx
CELL CYCLE Division Science 8 quarter IV.pptxCELL CYCLE Division Science 8 quarter IV.pptx
CELL CYCLE Division Science 8 quarter IV.pptx
 
Introduction to AI in Higher Education_draft.pptx
Introduction to AI in Higher Education_draft.pptxIntroduction to AI in Higher Education_draft.pptx
Introduction to AI in Higher Education_draft.pptx
 
KSHARA STURA .pptx---KSHARA KARMA THERAPY (CAUSTIC THERAPY)————IMP.OF KSHARA ...
KSHARA STURA .pptx---KSHARA KARMA THERAPY (CAUSTIC THERAPY)————IMP.OF KSHARA ...KSHARA STURA .pptx---KSHARA KARMA THERAPY (CAUSTIC THERAPY)————IMP.OF KSHARA ...
KSHARA STURA .pptx---KSHARA KARMA THERAPY (CAUSTIC THERAPY)————IMP.OF KSHARA ...
 
How to Configure Email Server in Odoo 17
How to Configure Email Server in Odoo 17How to Configure Email Server in Odoo 17
How to Configure Email Server in Odoo 17
 
Software Engineering Methodologies (overview)
Software Engineering Methodologies (overview)Software Engineering Methodologies (overview)
Software Engineering Methodologies (overview)
 
Framing an Appropriate Research Question 6b9b26d93da94caf993c038d9efcdedb.pdf
Framing an Appropriate Research Question 6b9b26d93da94caf993c038d9efcdedb.pdfFraming an Appropriate Research Question 6b9b26d93da94caf993c038d9efcdedb.pdf
Framing an Appropriate Research Question 6b9b26d93da94caf993c038d9efcdedb.pdf
 
MARGINALIZATION (Different learners in Marginalized Group
MARGINALIZATION (Different learners in Marginalized GroupMARGINALIZATION (Different learners in Marginalized Group
MARGINALIZATION (Different learners in Marginalized Group
 

Standard Deviation, Variance, Coefficient of Variation

  • 1. Standard Deviation &Variance Dr. Harinatha Reddy Sri Krishnadevaraya University Department of microbiology
  • 2. Standard deviation: • In statistics, the standard deviation is a measure that is used to quantify the amount of variation or dispersion of a set of data. • It is represented by Greek symbol (s) and in short form S or SD. • It also known as root mean square deviation. This formula for ungrouped data: SD OR
  • 3. SD for Ungrouped data: Example 1: A hen lays eight eggs. Each egg was weighed and recorded as follows: 60, 56, 61, 68, 51, 53, 69, 54 S.NO Variance (X) Deviation (d or dx)= X-X ̅ (X-X ̅ )2 or dx2 1 60 60-59= 1 1×1=1 2 56 56-59= -3 3×3=9 3 61 61-59= 2 2×2= 4 4 68 68-59= 9 81 5 51 51-59= -8 64 6 53 53-59= -6 36 7 69 69-59= 10 100 8 54 54-59= -5 25 N=8 X=432 ∑dx2=320 Mean(X ̅ )= ∑X/N = 432/8 =59 SD= SD = 320/8 SD= 6.32
  • 4. Exercise 1: Calculate SD for ungrouped data: • 10,15,20,25,4,8
  • 5. Standard deviation for grouped data (discrete variables): Where n = ∑f
  • 6. Example: Standard deviation for grouped data (discrete variables): Workers (X) Frequency (f) 0 1 1 1 2 2 3 3 4 6 5 5 6 4 7 3 8 3 9 2 First calculate mean for discrete data: Mean formula for discrete data is Mean (X ̅ )= ∑fx / ∑f
  • 7. Workers (X) Frequency (f) (fx) 0 1 0 1 1 1 2 2 4 3 3 9 4 6 24 5 5 25 6 4 24 7 3 21 8 3 24 9 2 18 ∑f=30 ∑fx=150 Mean formula for discrete data is Mean (X ̅ )= ∑fx / ∑f = 150/30 = 5 Mean (X ̅ )= 5
  • 8. Workers (X) Frequency (f) (fx) (X-X ̅ ) (X-X ̅ ) 2 (X-X ̅ ) 2 f 0 1 0 0-5=-5 25 25×1= 25 1 1 1 1-5=-4 16 16×1=16 2 2 4 2-5=-3 9 9×2= 18 3 3 9 -2 4 12 4 6 24 -1 1 6 5 5 25 0 0 0 6 4 24 1 1 4 7 3 21 2 4 12 8 3 24 3 9 27 9 2 18 4 16 32 ∑f=30 ∑fx=150 ∑(X-X ̅ ) 2 f =152 SD
  • 9. Exercise 1: Calculate SD for following discrete data Blood cells No of days 90 5 55 9 60 5 70 4 80 10 100 20
  • 10. Standard deviation for grouped Data (Continuous serious)
  • 11. Standard deviation for grouped Data Hours Number of students 10 -14 2 15 -19 12 20 -24 23 25-29 60 30-34 77 35-39 38 40 -44 8 Table 1. Number of hours per week spent watching television First calculate Mean (x ̅ )= ∑f.m / ∑f M= Middle values of class (It also mention as X)
  • 12. Hours Number of students 10 -14 2 15 -19 12 20 -24 23 25-29 60 30-34 77 35-39 38 40 -44 8 First calculate Mean (x ̅ )= ∑f.m / ∑f M= Middle values of class (It also mention as X)
  • 13. Hours Midpoint (x) Frequenc y (f) fx 10 to 14 12 2 24 15 to 19 17 12 204 20 to 24 22 23 506 25 to 29 27 60 1,620 30 to 34 32 77 2,464 35 to 39 37 38 1,406 40 to 44 42 8 336 ∑f= 220 ∑fx=6,560 Mean (x ̅ )= ∑f.m / ∑f = 6560/220 =29.82
  • 14. Hours Midpoint (M or X) Frequenc y (f) fm or fx (M-X ̅ ) (M-X ̅ ) 2 (M-X ̅ ) 2 f 10 -14 12 2 12×2=24 12-29.82 = -17.82 (17.82 ) 2 =317.6 317.6×2 = 635.2 15 -19 17 12 17×12=204 17-29.82= -12.82 (12.82 ) 2 =164.4 164.4×12 =1,972.8 20 -24 22 23 22×23=506 -7.82 61.2 1,407.6 25 -29 27 60 27×60=1,620 -2.82 8.0 480.0 30 -34 32 77 32×77=2,464 2.18 4.8 369.6 35 -39 37 38 37×38=1,406 7.18 51.6 1,960.8 40 -44 42 8 42×8=336 12.18 148.4 1,187.2 ∑f= 220 ∑fx=6,560 ∑(M-X ̅ ) 2 f= 8,013.2 Mean (x)==29.82 SD Where n = ∑f M written as X in the equation (Middle point (M) of the class also called as X) SD
  • 16. Coefficient of standard deviation Coefficient of standard deviation= Standard deviation (SD) Arithmetic mean (𝐗̅ ) = SD 𝐗̅
  • 17. Hours Midpoint (M or X) Frequenc y (f) fm or fx (M-X ̅ ) (M-X ̅ ) 2 (M-X ̅ ) 2 f 10 -14 12 2 12×2=24 12-29.82 = -17.82 (17.82 ) 2 =317.6 317.6×2 = 635.2 15 -19 17 12 17×12=204 17-29.82= -12.82 (12.82 ) 2 =164.4 164.4×12 =1,972.8 20 -24 22 23 22×23=506 -7.82 61.2 1,407.6 25 -29 27 60 27×60=1,620 -2.82 8.0 480.0 30 -34 32 77 32×77=2,464 2.18 4.8 369.6 35 -39 37 38 37×38=1,406 7.18 51.6 1,960.8 40 -44 42 8 42×8=336 12.18 148.4 1,187.2 ∑f= 220 ∑fx=6,560 ∑(M-X ̅ ) 2 f= 8,013.2 Mean (X ̅ )==29.82 Coefficient of SD = SD 𝐗̅ =6.03/29.2 = 0.206
  • 18. Uses of Standard deviation: • Standard deviation is based on all the observations. • Of all the measures of dispersion, standard deviation is best because it is least effected by fluctuations. • It used in the finding of standard error.
  • 20. Variance: • The variance is the arithmetic mean of the squares of sum the deviations for the mean value of the data. • It is represented by s2 or σ2 • Formula for the ungrouped data= s2 or σ2 =
  • 21. • Ascending order: 16,17,18,19,20,21,22,23,24.
  • 22. Example: Variance for ungrouped data: • 23,22,20,24,16,17,18,19,21, • Ascending order: 16,17,18,19,20,21,22,23,24. • Mean: 180/9= 20 S.No Observation s (X) Deviation from mean (Dx or d= X-X ̅ ) Square of deviation (X-X ̅ )2 or X 2 1 16 16-20= -4 42 = 16 2 17 17-20= -3 32 = 9 3 18 18-20= -2 4 4 19 19-20= -1 1 5 20 20-20= 0 0 6 21 21-20= 1 1 7 22 22-20= 2 4 8 23 23-20= 3 9 9 24 24-20= 4 16 N= 9 ∑X= 180 ∑X-X ̅ )2 = 60 S2 = S2 =60/9-1 S2 = 7.5
  • 23. Exercise 1 : Variance for ungrouped data: • 10,2,8,6,15,20,4,5 • Calculate variance for ungrouped data:
  • 24. Variance for grouped data (continuous series): Variance of grouped data formula: X̅ : Mean M or X: Mid point of class interval. N= frequency The first step in the variance for grouped data is to calculate mean: Mean (X ̅ )= ∑fm / ∑f
  • 25. Example: Variance for grouped data: Age H1N1 patients 31-35 2 36-40 3 41-45 8 46-50 12 51-55 16 56-60 5 61-65 2 66-70 2 The first step in the variance for grouped data is to calculate mean: Mean (X ̅ )= ∑fm / ∑f
  • 26. Class interval Mid point (M or X) Frequency (f) Fm or fx 31-35 33 2 66 36-40 38 3 114 41-45 43 8 344 46-50 48 12 576 51-55 53 16 848 56-60 58 5 290 61-65 63 2 126 66-70 68 2 136 ∑f= 50 ∑fm= 2500 Mean (X ̅ )= ∑fm / ∑f = 2500/50 Mean (X ̅ ) = 50
  • 27. Mean (X ̅ ) = 50 Class interval Mid point (M or X) Freque ncy (f) Fm or fx (X-X ̅ ) or (m-X ̅ ) (X-X ̅ )2 or (m-X ̅ )2 f(X-X ̅ )2 Or f(m-X ̅ )2 31-35 33 2 66 33-50= -17 172 = 289 289×2= 578 36-40 38 3 114 38-50= -12 144 144×3= 432 41-45 43 8 344 -7 49 392 46-50 48 12 576 -2 4 48 51-55 53 16 848 3 9 144 56-60 58 5 290 8 64 320 61-65 63 2 126 13 169 328 66-70 68 2 136 18 324 648 ∑f= 50 ∑fm= 2500 ∑(X-X ̅ )2 = 1052 ∑f(X-X ̅ )2 = 2900 = 2900/50-1 =2900/49= 59.18 SD or S = 59.18 SD or S= 7.69
  • 28. Co-efficient of Variation (CV) Co-efficient of Variation (CV)= Standard deviation × 100 Mean
  • 29. Calculate the Variance, standard deviation and co-efficient of variance for the data. Yield of wheat per hectare No of wheat fields 10-20 22 20-30 5 30-40 2 50-60 12 60-70 16 70-80 10 First find SD and followed by CV Co-efficient of Variation (CV)= Standard deviation × 100 Mean
  • 30. Class interval Mid point (M or X) Freque ncy (f) Fm or fx (X-X ̅ ) Or (m-X ̅ ) (X-X ̅ )2 Or (m-X ̅ )2 f(X-X ̅ )2 Or f(m-X ̅ )2 10-20 22 20-30 5 30-40 2 50-60 12 60-70 16 70-80 10 ∑f= ∑fm= ∑(X-X ̅ )2 = ∑f(X-X ̅ )2 =
  • 31. Significance of Variance: • It is easy to calculate. • It indicates the variability clearly. • The variance is the most informative among the measures of dispersion for populations. • It is most frequently used measure of variation in data especially with normal, binomial or Poisson distribution.