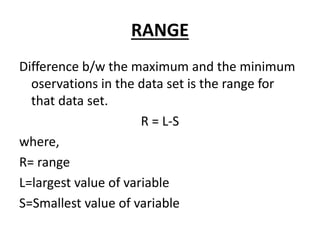
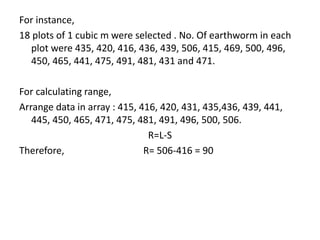
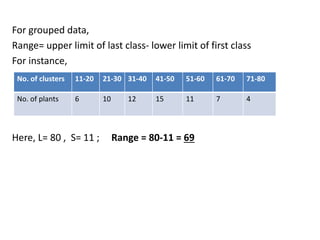
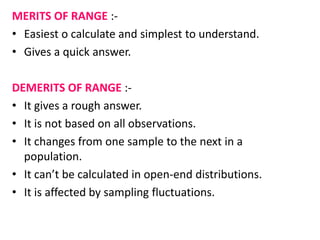
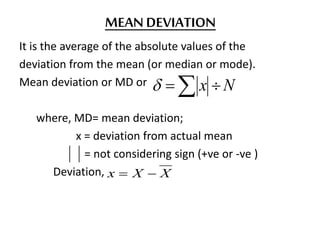
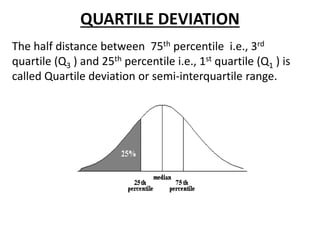
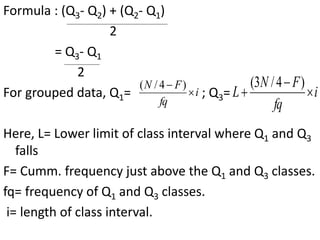
ABSOLUTE MEASURES OF
DISPERSION
MEANINGOF DISPERSION
In Statistics,
This term is used commonly to mean scatter,
Deviation, Fluctuation, Spread or variability of
data.
The degree to which the individual values of the
variate scatter away from the average or the
central value, is called a dispersion.
Why study dispersion??
Dispersion is used to denote a lack of uniformity
in item values of a given variable.
• Important tool of statistics for biologist
because biological phenomena are more
variable than that of physical and chemical
sciences.
• Absolute Measures of Dispersion: The measures
of dispersion which are expressed in terms of
original units of a data are termed as Absolute
Measures.
• Relative Measures of Dispersion: Relative
measures of dispersion, are also known as
coefficients of dispersion, are obtained as ratios
or percentages. These are pure numbers
independent of the units of measurement and
used to compare two or more sets of data values.
Absolute Measures
• Range
• Quartile Deviation
• Mean Deviation
• Standard Deviation
Relative Measure
• Co-efficient of Range
• Co-efficient of Quartile Deviation
• Co-efficient of mean Deviation
• co-efficient of Variation.
RANGE
Difference b/w the maximum and the minimum
oservations in the data set is the range for
that data set.
R = L-S
where,
R= range
L=largest value of variable
S=Smallest value of variable
For instance,
18 plots of 1 cubic m were selected . No. Of earthworm in each
plot were 435, 420, 416, 436, 439, 506, 415, 469, 500, 496,
450, 465, 441, 475, 491, 481, 431 and 471.
For calculating range,
Arrange data in array : 415, 416, 420, 431, 435,436, 439, 441,
445, 450, 465, 471, 475, 481, 491, 496, 500, 506.
R=L-S
Therefore, R= 506-416 = 90
For grouped data,
Range= upper limit of last class- lower limit of first class
For instance,
Here, L= 80 , S= 11 ; Range = 80-11 = 69
No. of clusters 11-20 21-30 31-40 41-50 51-60 61-70 71-80
No. of plants 6 10 12 15 11 7 4
MERITS OF RANGE :-
• Easiest o calculate and simplest to understand.
• Gives a quick answer.
DEMERITS OF RANGE :-
• It gives a rough answer.
• It is not based on all observations.
• It changes from one sample to the next in a
population.
• It can’t be calculated in open-end distributions.
• It is affected by sampling fluctuations.
MEAN DEVIATION
It is the average of the absolute values of the
deviation from the mean (or median or mode).
Mean deviation or MD or
where, MD= mean deviation;
x = deviation from actual mean
= not considering sign (+ve or -ve )
Deviation,
  Nx
XXx 
MERITS AND DEMERITS OF MEAN DEVIATION
Mean deviation is easy to calculate but since mean
deviation has less mathematical value , it is rarely
applied for biological statistical analysis.
It is also not meaningful because negative sign of
deviations is ignored.
QUARTILE DEVIATION
The half distance between 75th percentile i.e., 3rd
quartile (Q3 ) and 25th percentile i.e., 1st quartile (Q1 ) is
called Quartile deviation or semi-interquartile range.
Formula : (Q3- Q2) + (Q2- Q1)
2
= Q3- Q1
2
For grouped data, Q1= ; Q3=
Here, L= Lower limit of class interval where Q1 and Q3
falls
F= Cumm. frequency just above the Q1 and Q3 classes.
fq= frequency of Q1 and Q3 classes.
i= length of class interval.
i
fq
FN

 )4/(
i
fq
FN
L 


)4/3(
Cummulative frequency table-
Make out the solution for N=48 
Length of
Earthworm(cm)
15-20 20-25 25-30 30-35 35-40 40-45 45-50 50-55 55-60
frequency 4 3 8 9 14 3 3 2 2
Class
interval
15-20 20-25 25-30 30-35 35-40 40-45 45-50 50-55 55-60
f 4 3 8 9 14 3 3 2 2
c.f. 4 7 15 24 38 41 44 46 48
MERITS OF QUARTILE DEVIATION
• It is a better measure of dispersion as it is not based
on two extreme values like range but rather on middle
50 % observations.
• It is the only measure of dispersion which can be used
for open end distributions.
STANDARD DEVIATION
It may be defined as “the square root of the
airthmetic mean of the squares of deviations
from the airthmetic mean.”
MERITS AND DEMERITS OF STD. DEVIATION
• Std. Dev. summarizes the deviation of a large
distribution from mean in one figure used as a unit
of variation.
• It indicates whether the variation of difference of a
individual from the mean is real or by chance.
• Std. Dev. helps in finding the suitable size of sample
for valid conclusions.
• It helps in calculating the Standard error.
DEMERITS- It gives weightage to only extreme values.
The process of squaring deviations and then taking
square root involves lengthy calculations.
RELATIONSHIP OF STANDARD DEVIATION TO
OTHER MEASURES OF DISPERSION:
There is a very interesting relatinship between
the standard deviation, Mean deviation and
Quartile deviation :
QD: MD: SD = 2/3 : 4/3 : 1 = 10 : 12 : 15

Absolute Measures of dispersion

  • 1.
  • 2.
    MEANINGOF DISPERSION In Statistics, Thisterm is used commonly to mean scatter, Deviation, Fluctuation, Spread or variability of data. The degree to which the individual values of the variate scatter away from the average or the central value, is called a dispersion.
  • 3.
    Why study dispersion?? Dispersionis used to denote a lack of uniformity in item values of a given variable. • Important tool of statistics for biologist because biological phenomena are more variable than that of physical and chemical sciences.
  • 4.
    • Absolute Measuresof Dispersion: The measures of dispersion which are expressed in terms of original units of a data are termed as Absolute Measures. • Relative Measures of Dispersion: Relative measures of dispersion, are also known as coefficients of dispersion, are obtained as ratios or percentages. These are pure numbers independent of the units of measurement and used to compare two or more sets of data values.
  • 5.
    Absolute Measures • Range •Quartile Deviation • Mean Deviation • Standard Deviation Relative Measure • Co-efficient of Range • Co-efficient of Quartile Deviation • Co-efficient of mean Deviation • co-efficient of Variation.
  • 6.
    RANGE Difference b/w themaximum and the minimum oservations in the data set is the range for that data set. R = L-S where, R= range L=largest value of variable S=Smallest value of variable
  • 7.
    For instance, 18 plotsof 1 cubic m were selected . No. Of earthworm in each plot were 435, 420, 416, 436, 439, 506, 415, 469, 500, 496, 450, 465, 441, 475, 491, 481, 431 and 471. For calculating range, Arrange data in array : 415, 416, 420, 431, 435,436, 439, 441, 445, 450, 465, 471, 475, 481, 491, 496, 500, 506. R=L-S Therefore, R= 506-416 = 90
  • 8.
    For grouped data, Range=upper limit of last class- lower limit of first class For instance, Here, L= 80 , S= 11 ; Range = 80-11 = 69 No. of clusters 11-20 21-30 31-40 41-50 51-60 61-70 71-80 No. of plants 6 10 12 15 11 7 4
  • 9.
    MERITS OF RANGE:- • Easiest o calculate and simplest to understand. • Gives a quick answer. DEMERITS OF RANGE :- • It gives a rough answer. • It is not based on all observations. • It changes from one sample to the next in a population. • It can’t be calculated in open-end distributions. • It is affected by sampling fluctuations.
  • 10.
    MEAN DEVIATION It isthe average of the absolute values of the deviation from the mean (or median or mode). Mean deviation or MD or where, MD= mean deviation; x = deviation from actual mean = not considering sign (+ve or -ve ) Deviation,   Nx XXx 
  • 11.
    MERITS AND DEMERITSOF MEAN DEVIATION Mean deviation is easy to calculate but since mean deviation has less mathematical value , it is rarely applied for biological statistical analysis. It is also not meaningful because negative sign of deviations is ignored.
  • 12.
    QUARTILE DEVIATION The halfdistance between 75th percentile i.e., 3rd quartile (Q3 ) and 25th percentile i.e., 1st quartile (Q1 ) is called Quartile deviation or semi-interquartile range.
  • 13.
    Formula : (Q3-Q2) + (Q2- Q1) 2 = Q3- Q1 2 For grouped data, Q1= ; Q3= Here, L= Lower limit of class interval where Q1 and Q3 falls F= Cumm. frequency just above the Q1 and Q3 classes. fq= frequency of Q1 and Q3 classes. i= length of class interval. i fq FN   )4/( i fq FN L    )4/3(
  • 14.
    Cummulative frequency table- Makeout the solution for N=48  Length of Earthworm(cm) 15-20 20-25 25-30 30-35 35-40 40-45 45-50 50-55 55-60 frequency 4 3 8 9 14 3 3 2 2 Class interval 15-20 20-25 25-30 30-35 35-40 40-45 45-50 50-55 55-60 f 4 3 8 9 14 3 3 2 2 c.f. 4 7 15 24 38 41 44 46 48
  • 15.
    MERITS OF QUARTILEDEVIATION • It is a better measure of dispersion as it is not based on two extreme values like range but rather on middle 50 % observations. • It is the only measure of dispersion which can be used for open end distributions.
  • 16.
    STANDARD DEVIATION It maybe defined as “the square root of the airthmetic mean of the squares of deviations from the airthmetic mean.”
  • 17.
    MERITS AND DEMERITSOF STD. DEVIATION • Std. Dev. summarizes the deviation of a large distribution from mean in one figure used as a unit of variation. • It indicates whether the variation of difference of a individual from the mean is real or by chance. • Std. Dev. helps in finding the suitable size of sample for valid conclusions. • It helps in calculating the Standard error. DEMERITS- It gives weightage to only extreme values. The process of squaring deviations and then taking square root involves lengthy calculations.
  • 18.
    RELATIONSHIP OF STANDARDDEVIATION TO OTHER MEASURES OF DISPERSION: There is a very interesting relatinship between the standard deviation, Mean deviation and Quartile deviation : QD: MD: SD = 2/3 : 4/3 : 1 = 10 : 12 : 15