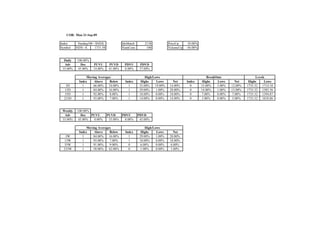
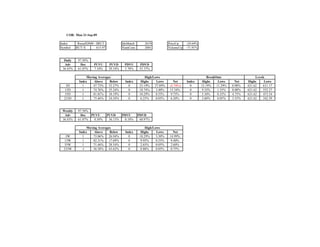
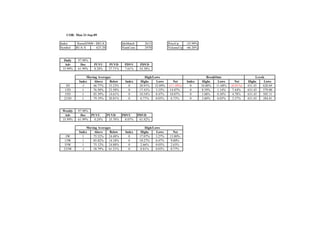
The document provides market index data for several US stock market indices as of the close of trading on September 21, 2009. It includes data on the S&P 100, Nasdaq 100, S&P 500, Russell 1000, Russell 2000, and Russell 3000 indices such as price changes, number of constituent stocks, moving averages, and high/low levels reached. Overall, the stock market indices showed declines from the previous day/week of between 10-39% accompanied by high trading volumes.


![5G Explained! A High Level Overview [Introduction]](https://cdn.slidesharecdn.com/ss_thumbnails/5gexplainedahighleveloverview-260119165306-cc137a3e-thumbnail.jpg?width=640&height=640&fit=bounds)


