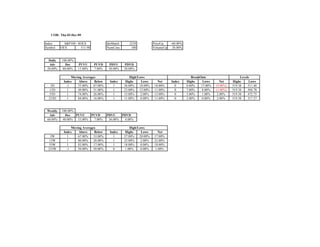
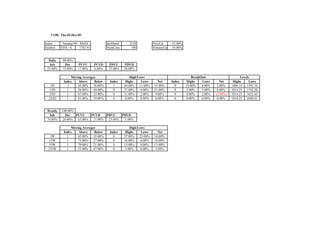
The document provides market index data for several US stock market indices as of Thursday, December 3, 2009. It includes daily and weekly statistics on price movement, trading volume, and percentages of stocks within each index that are above or below moving averages. The S&P 500 and other major indices saw price declines of around 60% compared to the prior day/week, with most individual stocks also lower. Trading volume was up modestly for most indices.