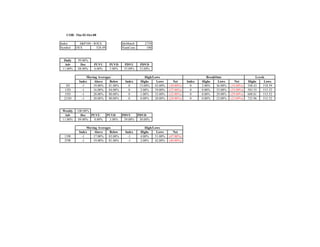
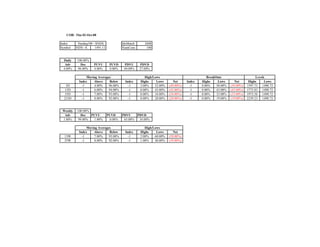
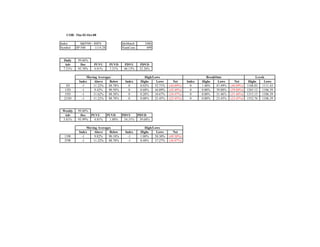


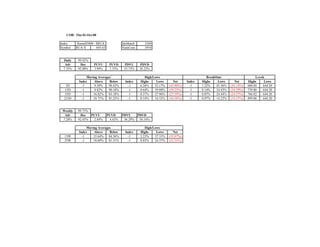
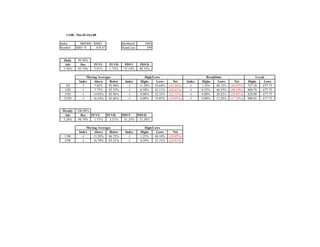

This document provides stock market index data and statistics for several major US stock indexes as of October 2, 2008. It includes daily and weekly statistics on advances, declines, and moving averages. The indexes tracked are the S&P 100, Nasdaq 100, S&P 500, Russell 1000, Russell 2000, Russell 3000, and S&P 400. Overall, the data shows high daily declines, low advances, and a large percentage of stocks trading below their moving averages, indicating broadly negative market conditions.


