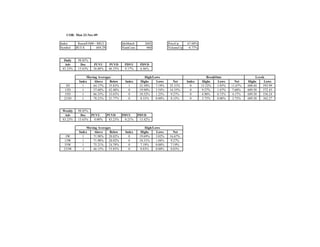
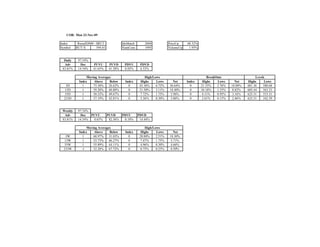
The document provides market index data from multiple US stock indexes as of November 23, 2009. It includes daily and weekly performance statistics as well as information on moving averages and highs/lows for indexes like the S&P 500, Nasdaq 100, Russell 1000 and 2000, and S&P 100 over various periods from 3 days to over 200 weeks. The indexes showed price increases in the 77-88% range for the period with mixed advances/declines and varying performances across industry sectors and market caps.