
Recommended
More Related Content
What's hot
Viewers also liked
Similar to S&P500 Analysis
More from macavity_d_katt
More from macavity_d_katt (20)
Recently uploaded
Recently uploaded (20)
S&P500 Analysis
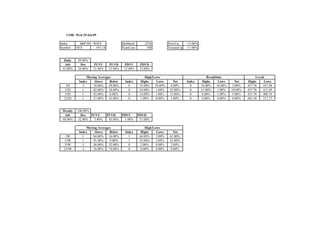
- 1. COB: Wed 29-Jul-09 Index S&P100 - $OEX IdxMatch 2256 PriceUp -13.00% Symbol OEX 455.18 NumCons 100 VolumeUp -11.00% Daily 99.00% Adv Dec PUVU PUVD PDVU PDVD 43.00% 56.00% 21.00% 22.00% 23.00% 33.00% Moving Averages High/Lows BreakOuts Levels Index Above Below Index Highs Lows Net Index Highs Lows Net Highs Lows 3D -1 50.00% 50.00% 0 33.00% 29.00% 4.00% 0 19.00% 16.00% 3.00% 457.76 451.96 13D 1 82.00% 18.00% 0 24.00% 1.00% 23.00% 0 11.00% 1.00% 10.00% 457.76 411.69 55D 1 92.00% 8.00% 0 14.00% 1.00% 13.00% 0 6.00% 1.00% 5.00% 457.76 408.76 233D 1 57.00% 43.00% 0 1.00% 0.00% 1.00% 0 0.00% 0.00% 0.00% 601.50 317.37 Weekly 100.00% Adv Dec PUVU PUVD PDVU PDVD 48.00% 52.00% 3.00% 45.00% 1.00% 51.00% Moving Averages High/Lows Index Above Below Index Highs Lows Net 3W 1 84.00% 16.00% 1 64.00% 3.00% 61.00% 13W 1 91.00% 9.00% 1 35.00% 2.00% 33.00% 55W -1 48.00% 52.00% 0 2.00% 0.00% 2.00% 233W -1 26.00% 74.00% 0 0.00% 0.00% 0.00%
- 2. COB: Wed 29-Jul-09 Index Nasdaq100 - $NDX IdxMatch 2143 PriceUp -20.00% Symbol NDX--X 1599.61 NumCons 100 VolumeUp -24.00% Daily 100.00% Adv Dec PUVU PUVD PDVU PDVD 40.00% 60.00% 18.00% 22.00% 20.00% 40.00% Moving Averages High/Lows BreakOuts Levels Index Above Below Index Highs Lows Net Index Highs Lows Net Highs Lows 3D 1 40.00% 60.00% 0 32.00% 18.00% 14.00% 0 17.00% 7.00% 10.00% 1609.17 1580.52 13D 1 85.00% 15.00% 0 26.00% 0.00% 26.00% 0 13.00% 0.00% 13.00% 1609.17 1402.19 55D 1 89.00% 11.00% 0 18.00% 0.00% 18.00% 0 8.00% 0.00% 8.00% 1609.17 1339.82 233D 1 77.00% 23.00% 0 4.00% 0.00% 4.00% 0 2.00% 0.00% 2.00% 1921.19 1018.86 Weekly 99.00% Adv Dec PUVU PUVD PDVU PDVD 47.00% 52.00% 5.00% 42.00% 2.00% 50.00% Moving Averages High/Lows Index Above Below Index Highs Lows Net 3W 1 85.00% 15.00% 1 62.00% 2.00% 60.00% 13W 1 89.00% 11.00% 1 41.00% 0.00% 41.00% 55W 1 69.00% 31.00% 0 7.00% 0.00% 7.00% 233W 1 40.00% 60.00% 0 2.00% 0.00% 2.00%
- 3. COB: Wed 29-Jul-09 Index S&P500 - $SPX IdxMatch 2781 PriceUp -30.40% Symbol SP-500 975.15 NumCons 500 VolumeUp -10.00% Daily 98.80% Adv Dec PUVU PUVD PDVU PDVD 34.20% 64.60% 18.80% 15.40% 25.60% 39.00% Moving Averages High/Lows BreakOuts Levels Index Above Below Index Highs Lows Net Index Highs Lows Net Highs Lows 3D -1 43.00% 57.00% 0 26.40% 30.20% (3.80%) 0 13.60% 14.60% (1.00%) 982.49 968.65 13D 1 81.00% 19.00% 0 22.00% 0.80% 21.20% 0 11.20% 0.60% 10.60% 982.49 875.32 55D 1 88.00% 12.00% 0 14.80% 0.60% 14.20% 0 8.00% 0.60% 7.40% 982.49 869.32 233D 1 60.80% 39.20% 0 1.60% 0.20% 1.40% 0 0.80% 0.20% 0.60% 1303.04 666.79 Weekly 99.60% Adv Dec PUVU PUVD PDVU PDVD 42.40% 57.20% 3.60% 38.80% 3.40% 53.80% Moving Averages High/Lows Index Above Below Index Highs Lows Net 3W 1 82.20% 17.80% 1 64.40% 1.80% 62.60% 13W 1 87.60% 12.40% 1 33.00% 1.40% 31.60% 55W -1 52.60% 47.40% 0 2.20% 0.20% 2.00% 233W -1 25.20% 74.80% 0 0.20% 0.20% 0.00%
- 4. COB: Wed 29-Jul-09 Index Russell1000 - $RUI IdxMatch 2622 PriceUp -35.57% Symbol RUI-X 533.11 NumCons 970 VolumeUp -10.00% Daily 98.87% Adv Dec PUVU PUVD PDVU PDVD 31.65% 67.22% 16.80% 14.85% 27.63% 39.59% Moving Averages High/Lows BreakOuts Levels Index Above Below Index Highs Lows Net Index Highs Lows Net Highs Lows 3D -1 40.41% 59.59% 0 24.23% 31.65% (7.42%) 0 11.44% 16.70% (5.26%) 537.58 529.70 13D 1 80.52% 19.48% 0 19.79% 0.93% 18.87% 0 9.48% 0.62% 8.87% 537.58 477.23 55D 1 87.73% 12.27% 0 12.99% 0.41% 12.58% 0 5.88% 0.41% 5.46% 537.58 474.10 233D 1 62.27% 37.73% 0 2.16% 0.10% 2.06% 0 0.82% 0.10% 0.72% 712.48 362.27 Weekly 99.59% Adv Dec PUVU PUVD PDVU PDVD 40.82% 58.76% 3.92% 36.91% 3.51% 55.26% Moving Averages High/Lows Index Above Below Index Highs Lows Net 3W 1 80.93% 19.07% 1 63.61% 1.55% 62.06% 13W 1 87.84% 12.16% 1 32.27% 0.93% 31.34% 55W 1 54.85% 45.15% 0 3.30% 0.10% 3.20% 233W -1 28.97% 71.03% 0 0.62% 0.10% 0.52%
- 5. COB: Wed 29-Jul-09 Index Russell2000 - $RUT IdxMatch 2625 PriceUp -36.59% Symbol RUT-X 548.38 NumCons 2009 VolumeUp -21.35% Daily 97.91% Adv Dec PUVU PUVD PDVU PDVD 30.66% 67.25% 15.28% 15.33% 22.95% 44.25% Moving Averages High/Lows BreakOuts Levels Index Above Below Index Highs Lows Net Index Highs Lows Net Highs Lows 3D -1 41.81% 58.19% 0 25.19% 24.39% 0.80% 0 11.25% 11.80% (0.55%) 551.95 544.18 13D 1 75.21% 24.79% 0 19.26% 2.29% 16.97% 0 8.31% 1.14% 7.17% 551.95 475.28 55D 1 80.49% 19.51% 0 10.80% 0.65% 10.15% 0 4.33% 0.30% 4.03% 551.95 470.37 233D 1 60.28% 39.72% 0 2.54% 0.00% 2.54% 0 1.29% 0.00% 1.29% 761.78 342.59 Weekly 98.51% Adv Dec PUVU PUVD PDVU PDVD 43.70% 54.80% 5.97% 37.73% 4.88% 49.93% Moving Averages High/Lows Index Above Below Index Highs Lows Net 3W 1 75.51% 24.49% 1 48.98% 3.58% 45.40% 13W 1 80.09% 19.91% 1 23.49% 1.39% 22.10% 55W 1 55.10% 44.90% 0 5.43% 0.15% 5.28% 233W -1 29.07% 70.93% 0 1.05% 0.15% 0.90%
- 6. COB: Wed 29-Jul-09 Index Russell3000 - $RUA IdxMatch 2621 PriceUp -36.21% Symbol RUA-X 569.23 NumCons 2980 VolumeUp -17.62% Daily 98.22% Adv Dec PUVU PUVD PDVU PDVD 31.01% 67.21% 15.81% 15.17% 24.46% 42.72% Moving Averages High/Lows BreakOuts Levels Index Above Below Index Highs Lows Net Index Highs Lows Net Highs Lows 3D -1 41.34% 58.66% 0 24.87% 26.74% (1.88%) 0 11.34% 13.39% (2.05%) 573.80 565.71 13D 1 76.95% 23.05% 0 19.46% 1.85% 17.62% 0 8.72% 0.97% 7.75% 573.80 508.31 55D 1 82.89% 17.11% 0 11.54% 0.57% 10.97% 0 4.87% 0.34% 4.53% 573.80 505.11 233D 1 60.97% 39.03% 0 2.45% 0.03% 2.42% 0 1.17% 0.03% 1.14% 762.54 384.41 Weekly 98.86% Adv Dec PUVU PUVD PDVU PDVD 42.75% 56.11% 5.30% 37.45% 4.43% 51.68% Moving Averages High/Lows Index Above Below Index Highs Lows Net 3W 1 77.28% 22.72% 1 53.79% 2.92% 50.87% 13W 1 82.65% 17.35% 1 26.41% 1.24% 25.17% 55W 1 55.07% 44.93% 0 4.80% 0.13% 4.66% 233W -1 29.06% 70.94% 0 0.94% 0.13% 0.81%
- 7. COB: Wed 29-Jul-09 Index S&P400 - $MID IdxMatch 2022 PriceUp -26.00% Symbol MID--X 619.13 NumCons 400 VolumeUp -16.00% Daily 99.00% Adv Dec PUVU PUVD PDVU PDVD 36.50% 62.50% 17.00% 19.50% 24.50% 38.00% Moving Averages High/Lows BreakOuts Levels Index Above Below Index Highs Lows Net Index Highs Lows Net Highs Lows 3D -1 46.75% 53.25% 0 27.00% 26.00% 1.00% 0 11.00% 13.75% (2.75%) 624.69 616.12 13D 1 84.75% 15.25% 0 20.75% 0.75% 20.00% 0 8.75% 0.50% 8.25% 624.69 540.16 55D 1 88.25% 11.75% 0 11.75% 0.25% 11.50% 0 4.00% 0.25% 3.75% 624.69 539.04 233D 1 63.75% 36.25% 0 2.50% 0.00% 2.50% 0 0.50% 0.00% 0.50% 826.86 397.97 Weekly 99.50% Adv Dec PUVU PUVD PDVU PDVD 46.75% 52.75% 6.00% 40.75% 4.25% 48.50% Moving Averages High/Lows Index Above Below Index Highs Lows Net 3W 1 84.50% 15.50% 1 61.00% 1.25% 59.75% 13W 1 88.50% 11.50% 1 30.25% 0.50% 29.75% 55W 1 57.25% 42.75% 0 3.50% 0.00% 3.50% 233W -1 30.25% 69.75% 0 0.50% 0.00% 0.50%
- 8. COB: Wed 29-Jul-09 Index S&P600 - $SML IdxMatch 2744 PriceUp -34.33% Symbol SML--X 290.51 NumCons 600 VolumeUp -16.67% Daily 98.00% Adv Dec PUVU PUVD PDVU PDVD 31.83% 66.17% 14.67% 17.17% 26.00% 40.17% Moving Averages High/Lows BreakOuts Levels Index Above Below Index Highs Lows Net Index Highs Lows Net Highs Lows 3D -1 44.33% 55.67% 0 26.33% 26.00% 0.33% 0 12.00% 12.00% 0.00% 292.79 288.47 13D 1 79.83% 20.17% 0 21.17% 3.17% 18.00% 0 9.00% 2.00% 7.00% 292.79 253.18 55D 1 82.67% 17.33% 0 11.33% 0.50% 10.83% 0 4.83% 0.33% 4.50% 292.79 249.62 233D 1 60.00% 40.00% 0 1.83% 0.00% 1.83% 0 1.00% 0.00% 1.00% 401.27 181.32 Weekly 99.50% Adv Dec PUVU PUVD PDVU PDVD 44.67% 54.83% 6.33% 38.33% 5.67% 49.17% Moving Averages High/Lows Index Above Below Index Highs Lows Net 3W 1 80.83% 19.17% 1 52.67% 3.67% 49.00% 13W 1 82.17% 17.83% 1 25.83% 1.33% 24.50% 55W 1 55.00% 45.00% 0 4.67% 0.17% 4.50% 233W -1 30.83% 69.17% 0 1.17% 0.17% 1.00%