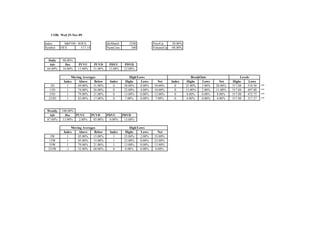
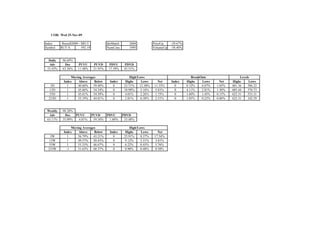
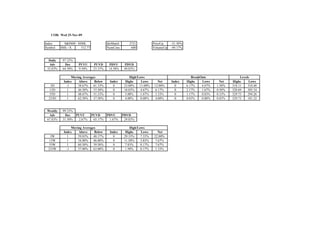
The document provides market index data from November 25, 2009. It includes performance summaries for major US stock indexes such as the S&P 500, Nasdaq 100, Russell 1000 and Russell 2000. The indexes showed mixed performance for the day, week and period averages, with some up over 50% for the year and others down nearly 30%. Moving averages and technical indicators are also given for each index.