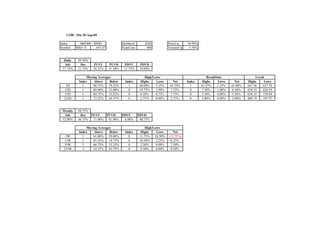
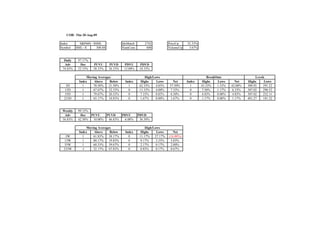
This document provides market index data for several US stock market indices as of Thursday, August 20, 2009. It includes daily and weekly statistics on price movement, trading volume, and percentages of stocks closing above or below moving averages for indices like the S&P 100, Nasdaq 100, S&P 500, Russell 1000, Russell 2000, and Russell 3000. Overall, the indices saw price increases in the 60-50% range for the period reported with decreases in trading volume of around 5-20%.