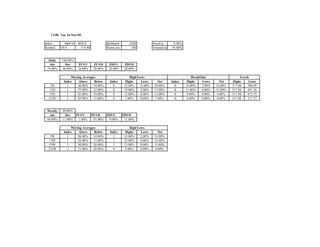
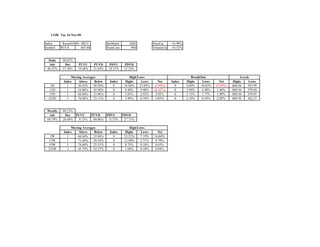
The document provides market index data and statistics for several US stock market indices as of Tue 24-Nov-09. It includes data on the S&P 100, Nasdaq 100, S&P 500, Russell 1000, Russell 2000, and Russell 3000 indices such as price changes, number of constituent stocks, moving average positions and high/low levels. Most indices were down between 8-25% over the period with advances outnumbering declines on a daily and weekly basis for the major indices.