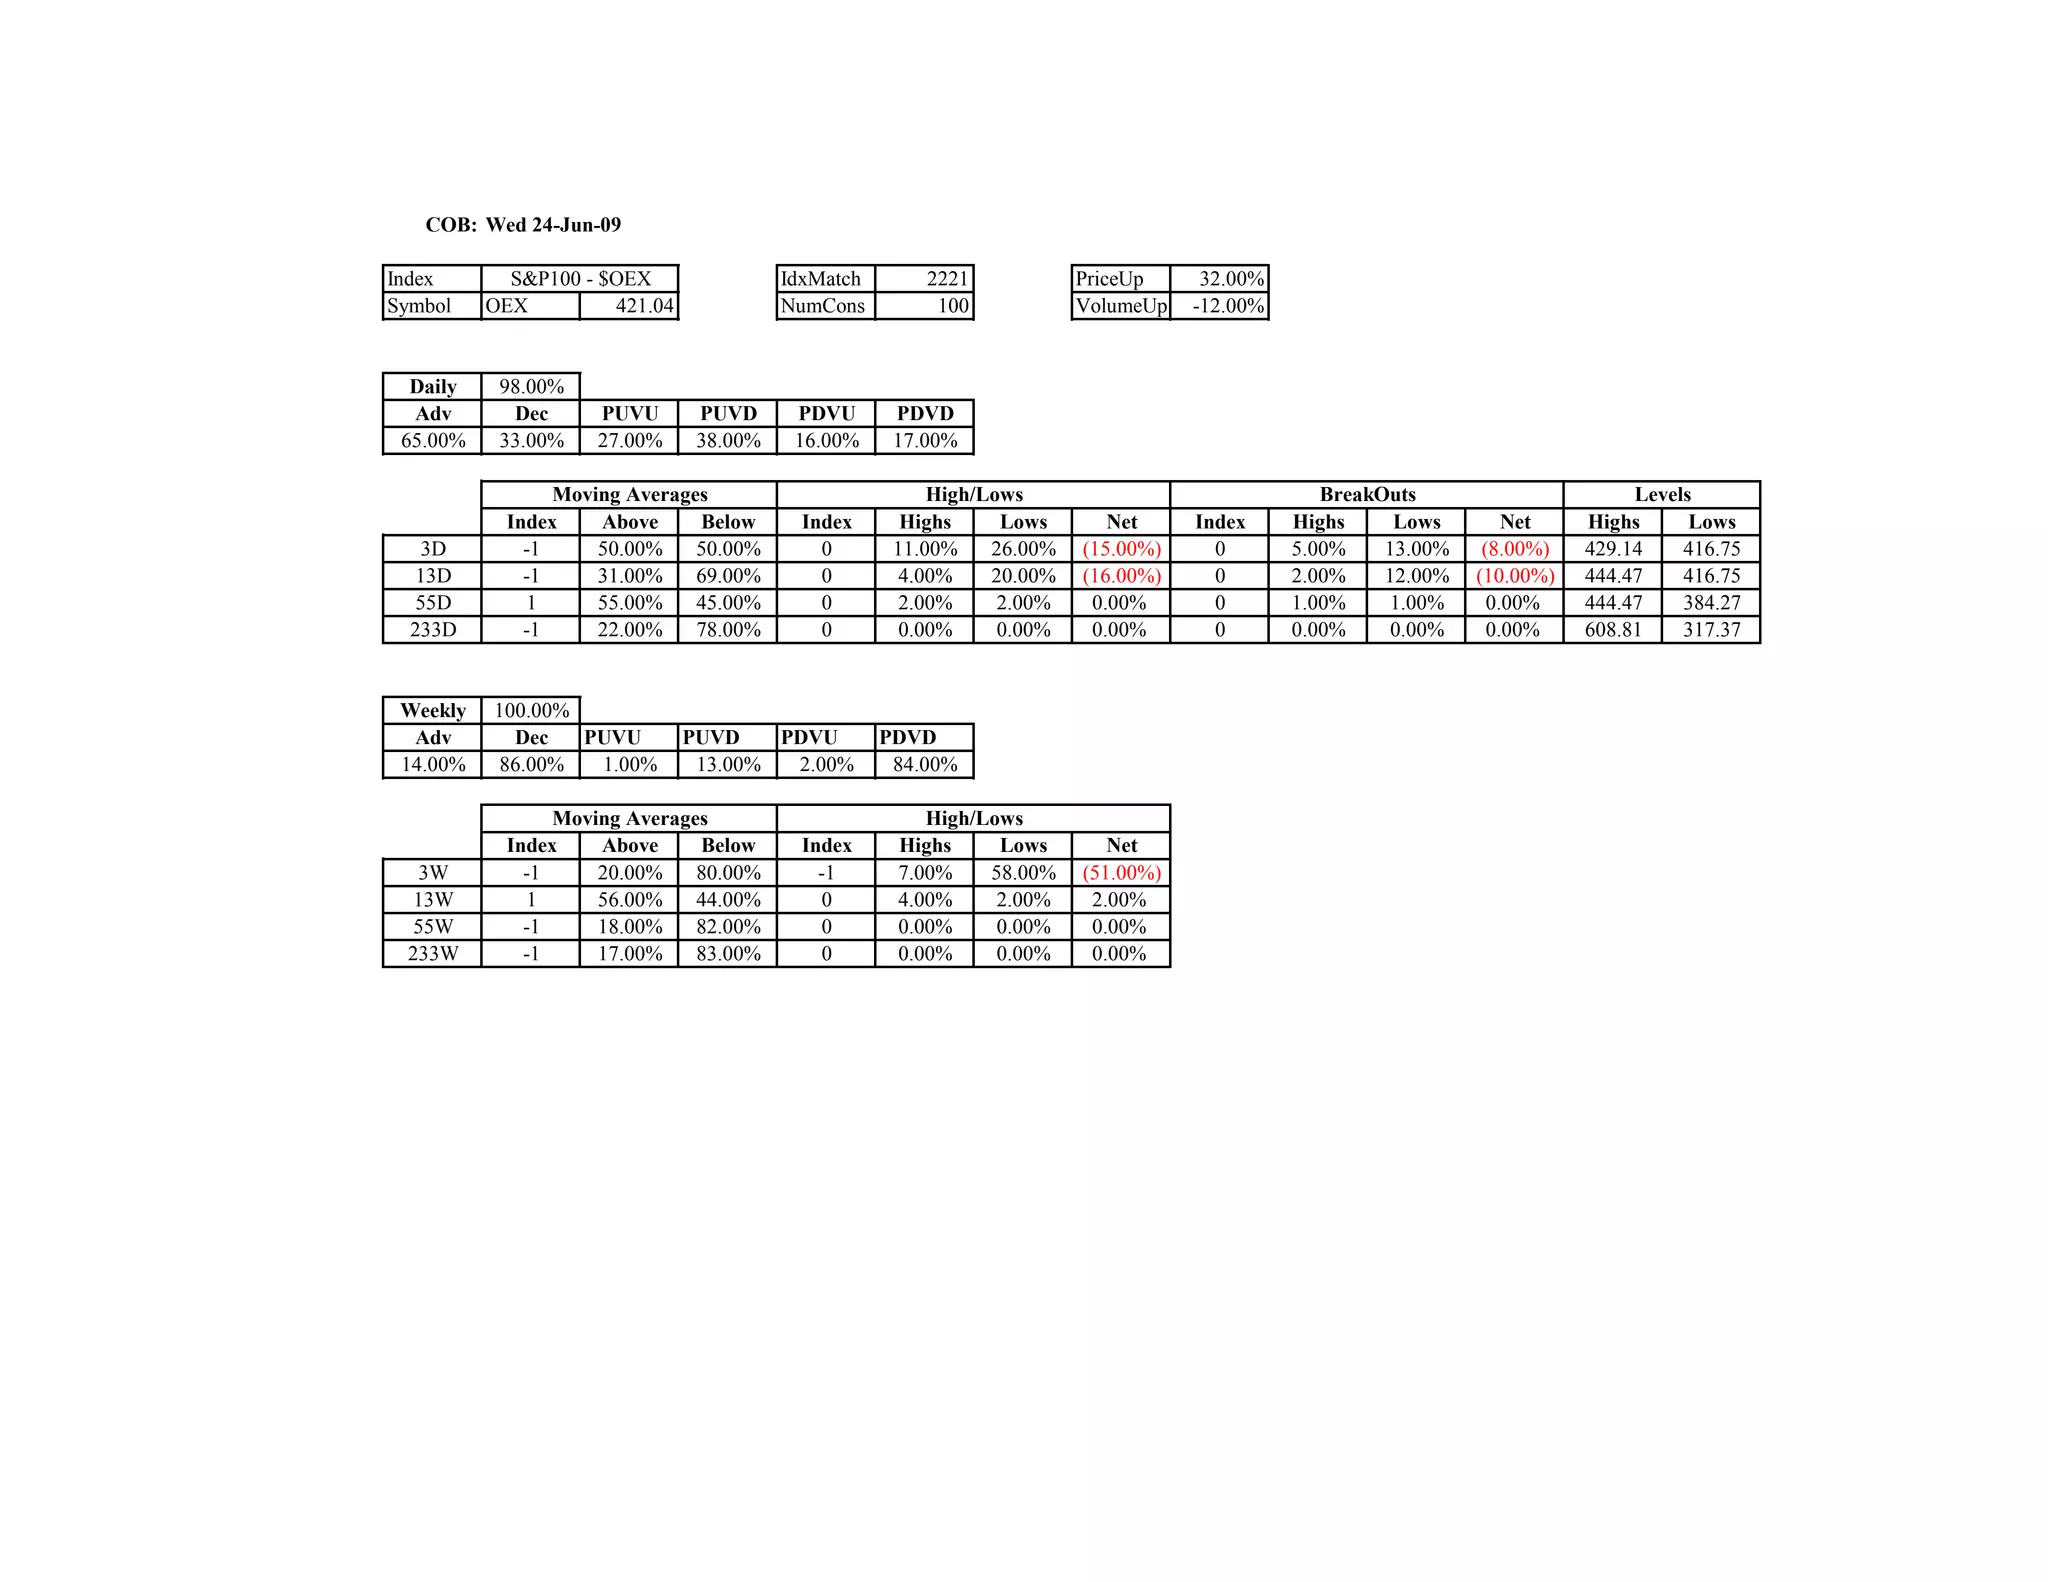
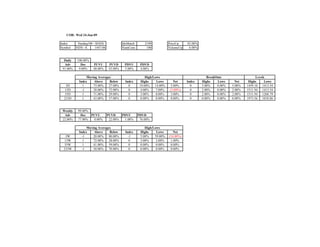
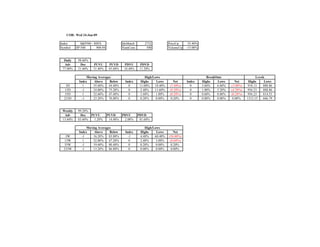
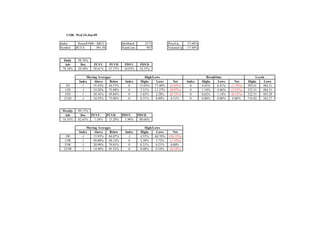
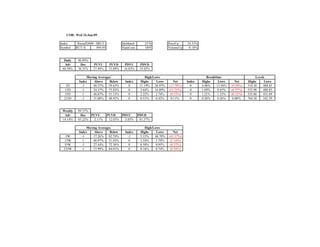
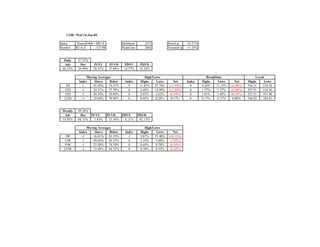
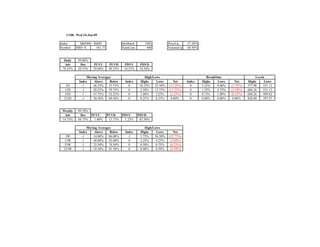
The document provides stock market index data from several US stock market indices as of June 24, 2009. It includes daily and weekly performance statistics as well as information on moving averages and highs/lows for indexes such as the S&P 100, Nasdaq 100, S&P 500, Russell 1000, Russell 2000, and Russell 3000. The indexes showed mixed performance over various periods with advances outweighing declines in most cases on a daily basis but declines dominating on a weekly basis according to the data.


![Getting Started with Apache Spark: Big Data Made Simple [Free Meetup]](https://cdn.slidesharecdn.com/ss_thumbnails/apachesparkgettingstarted-260203175547-8361bcc3-thumbnail.jpg?width=640&height=640&fit=bounds)


