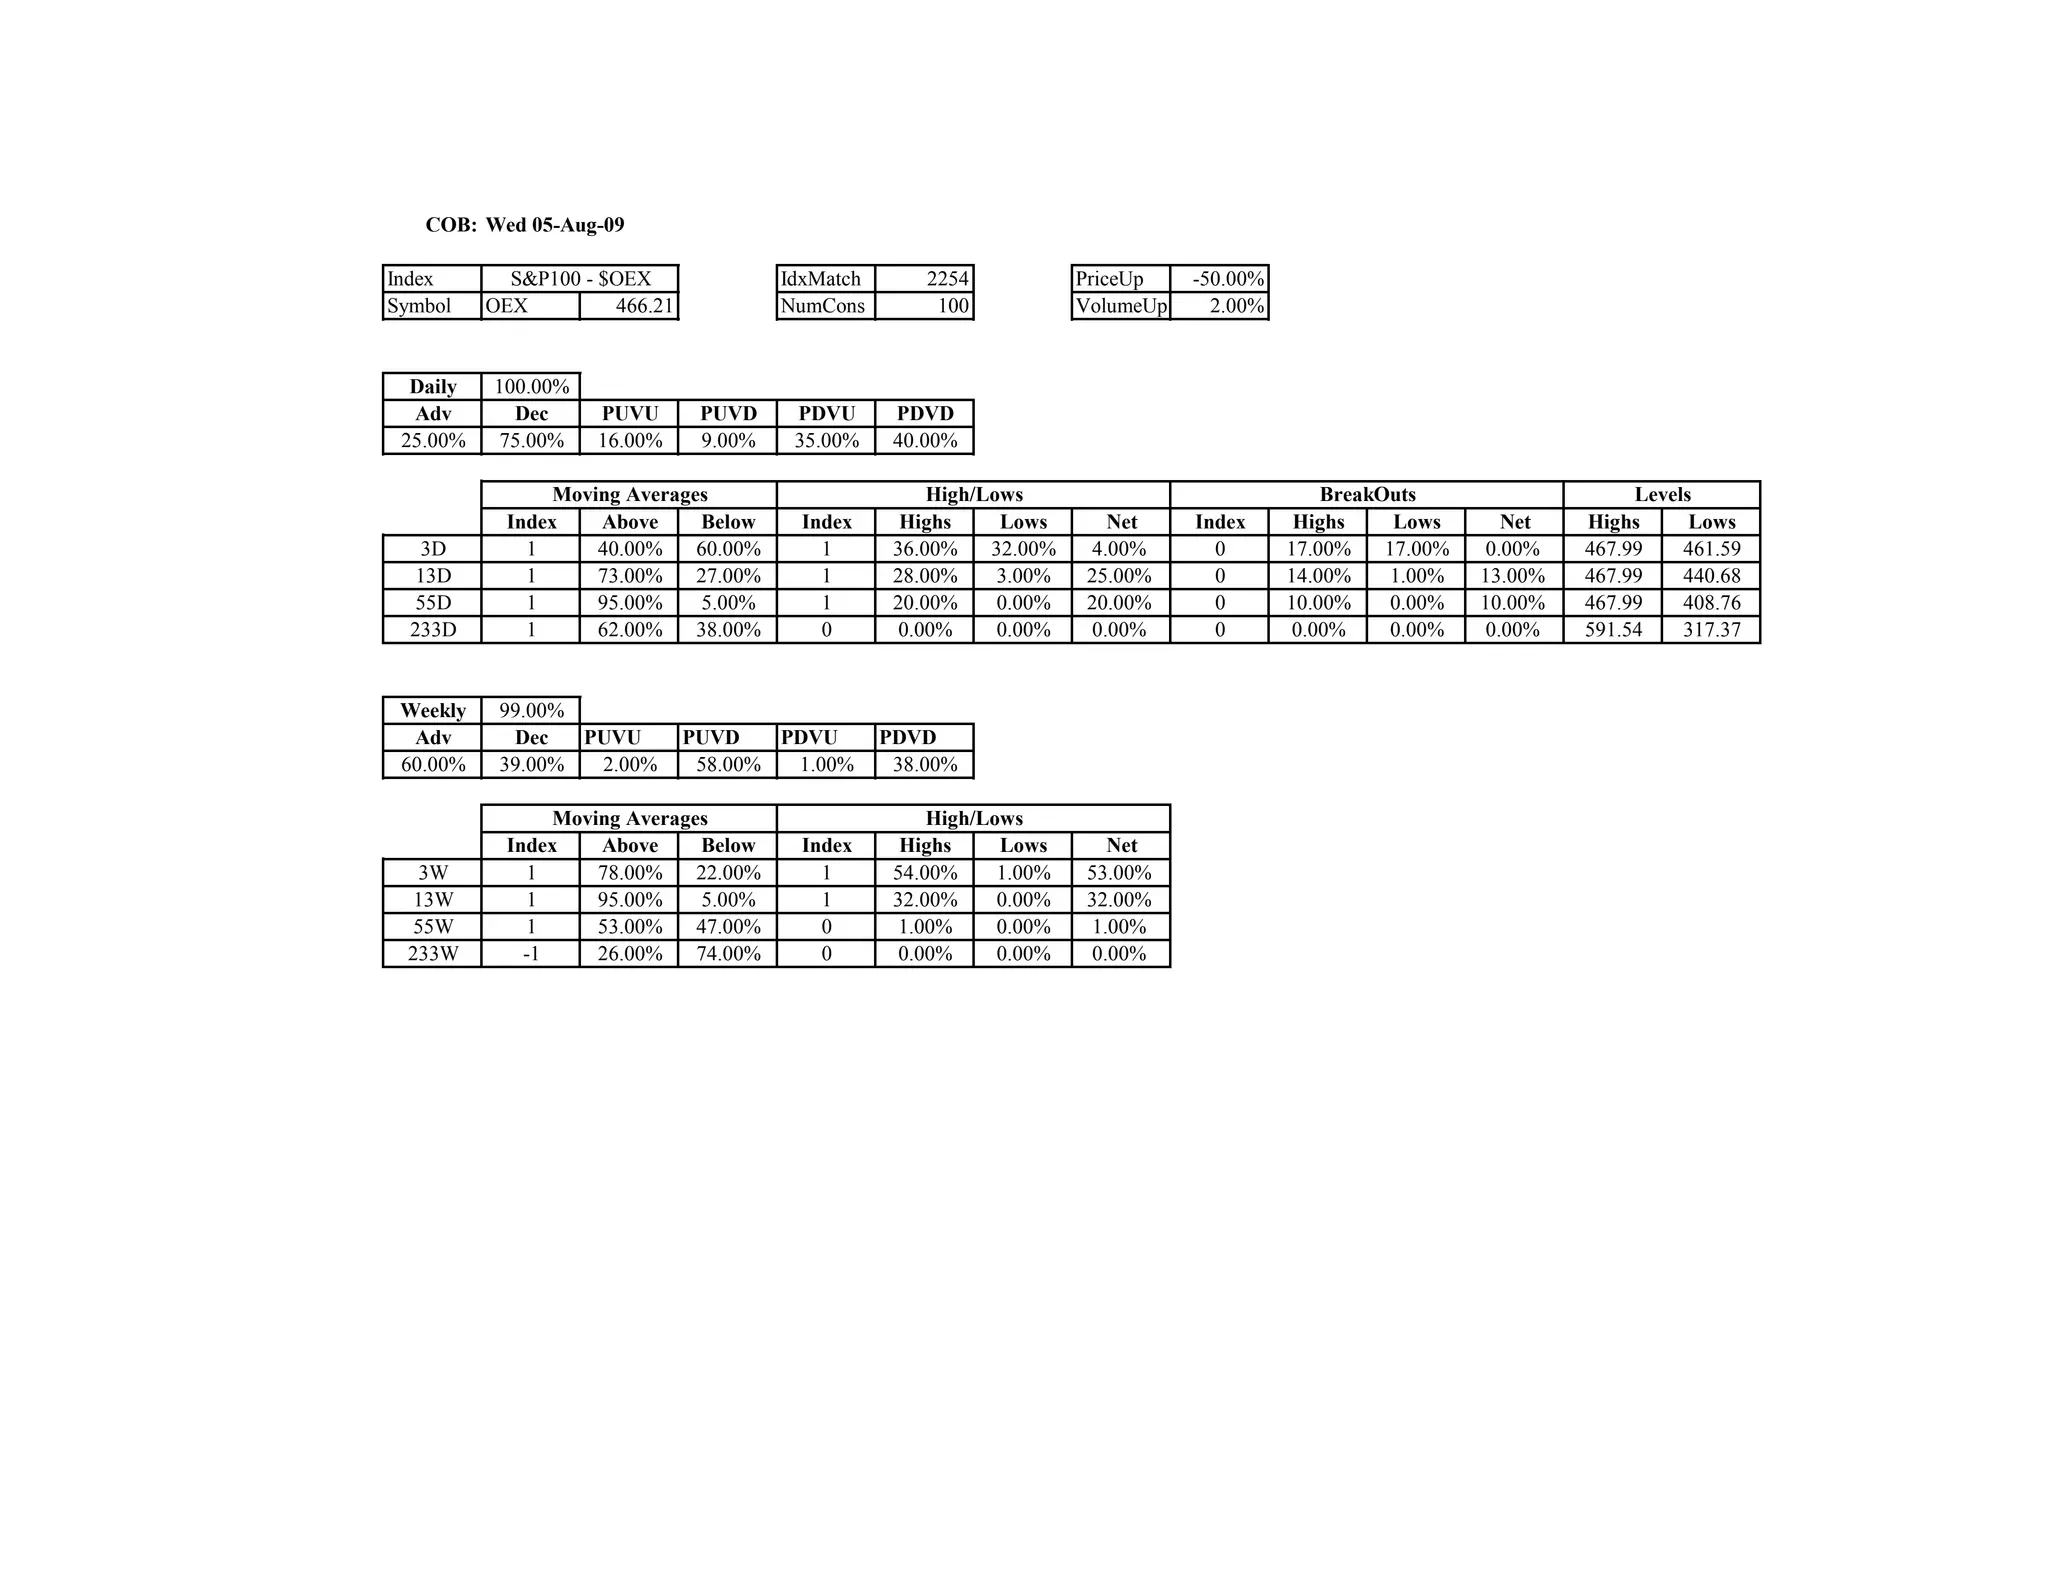
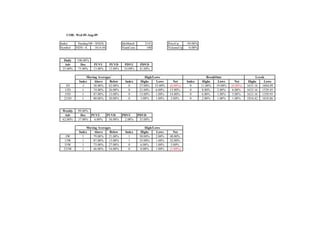
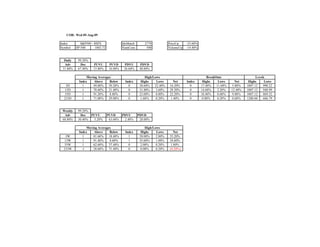
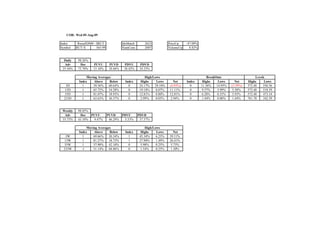
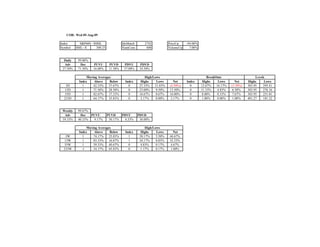
The document provides stock market index data for several US stock market indices including the S&P 100, Nasdaq 100, S&P 500, Russell 1000, Russell 2000, and Russell 3000. For each index, it includes daily and weekly statistics on price changes, moving averages, highs and lows, and other metrics. All indices showed declines in price of 25-50% over the period analyzed.