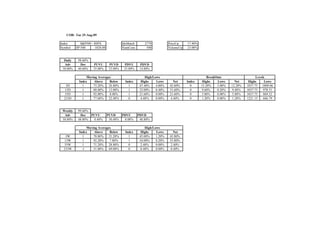
The document provides market index data and statistics for several US stock market indices as of Tuesday, August 25, 2009. It includes details such as price changes, percentage of stocks trading higher or lower, moving average positions, and high and low points for 3-day, 13-day, 55-day and 233-day periods. The indices covered are the S&P 100, Nasdaq 100, S&P 500, Russell 1000, Russell 2000, and Russell 3000.