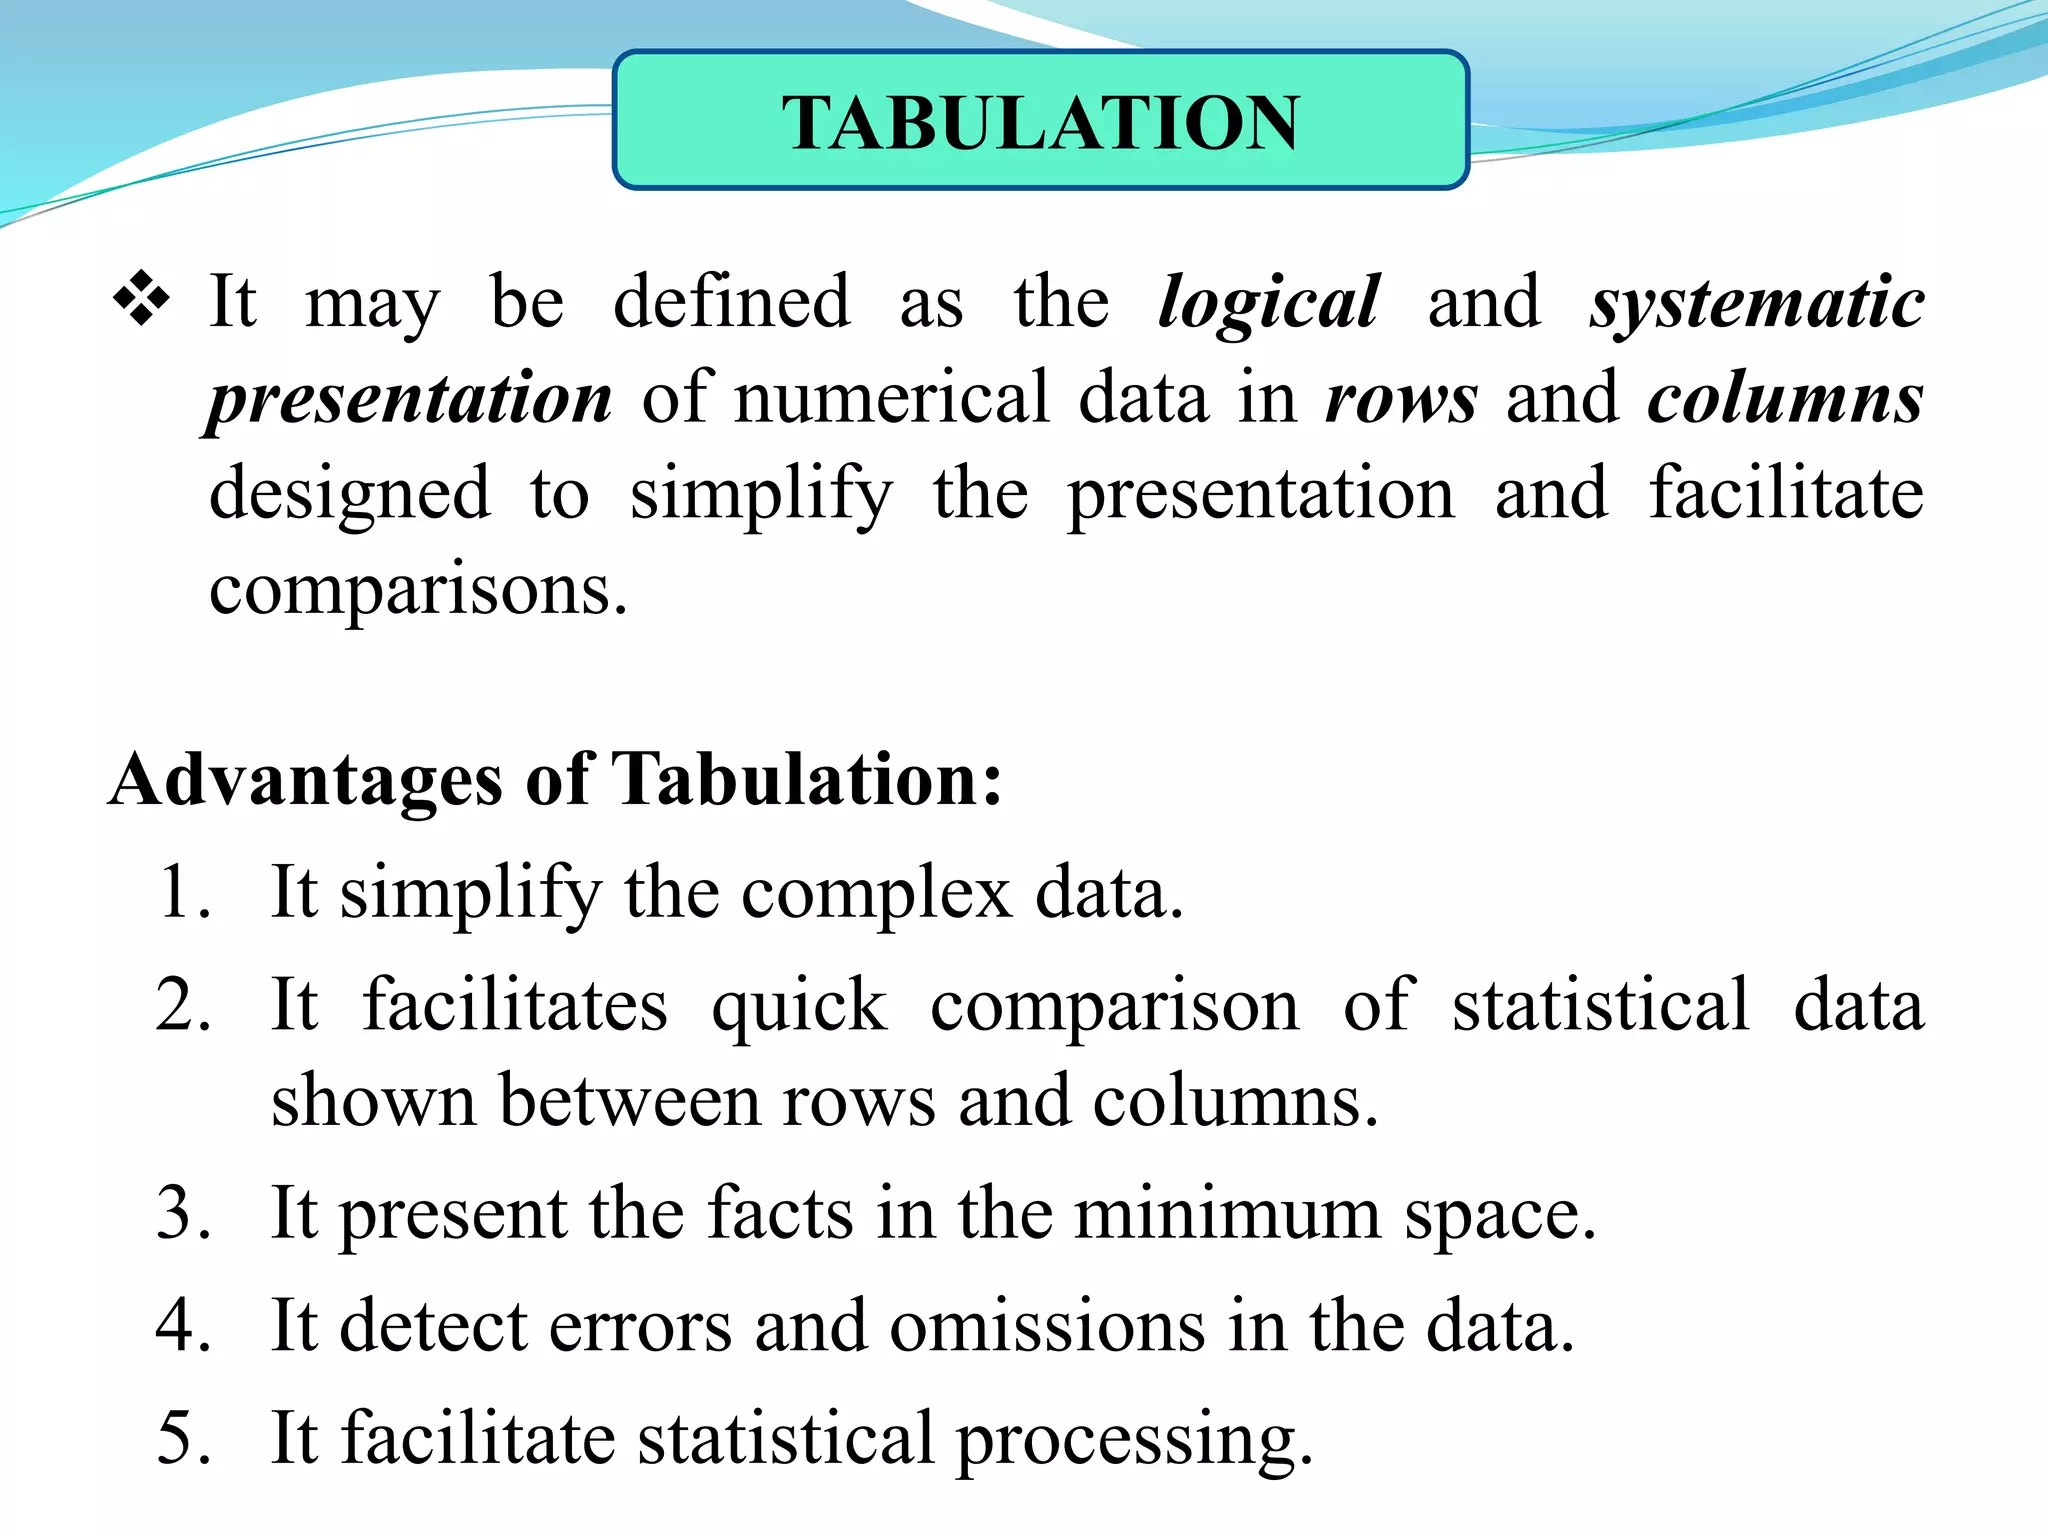
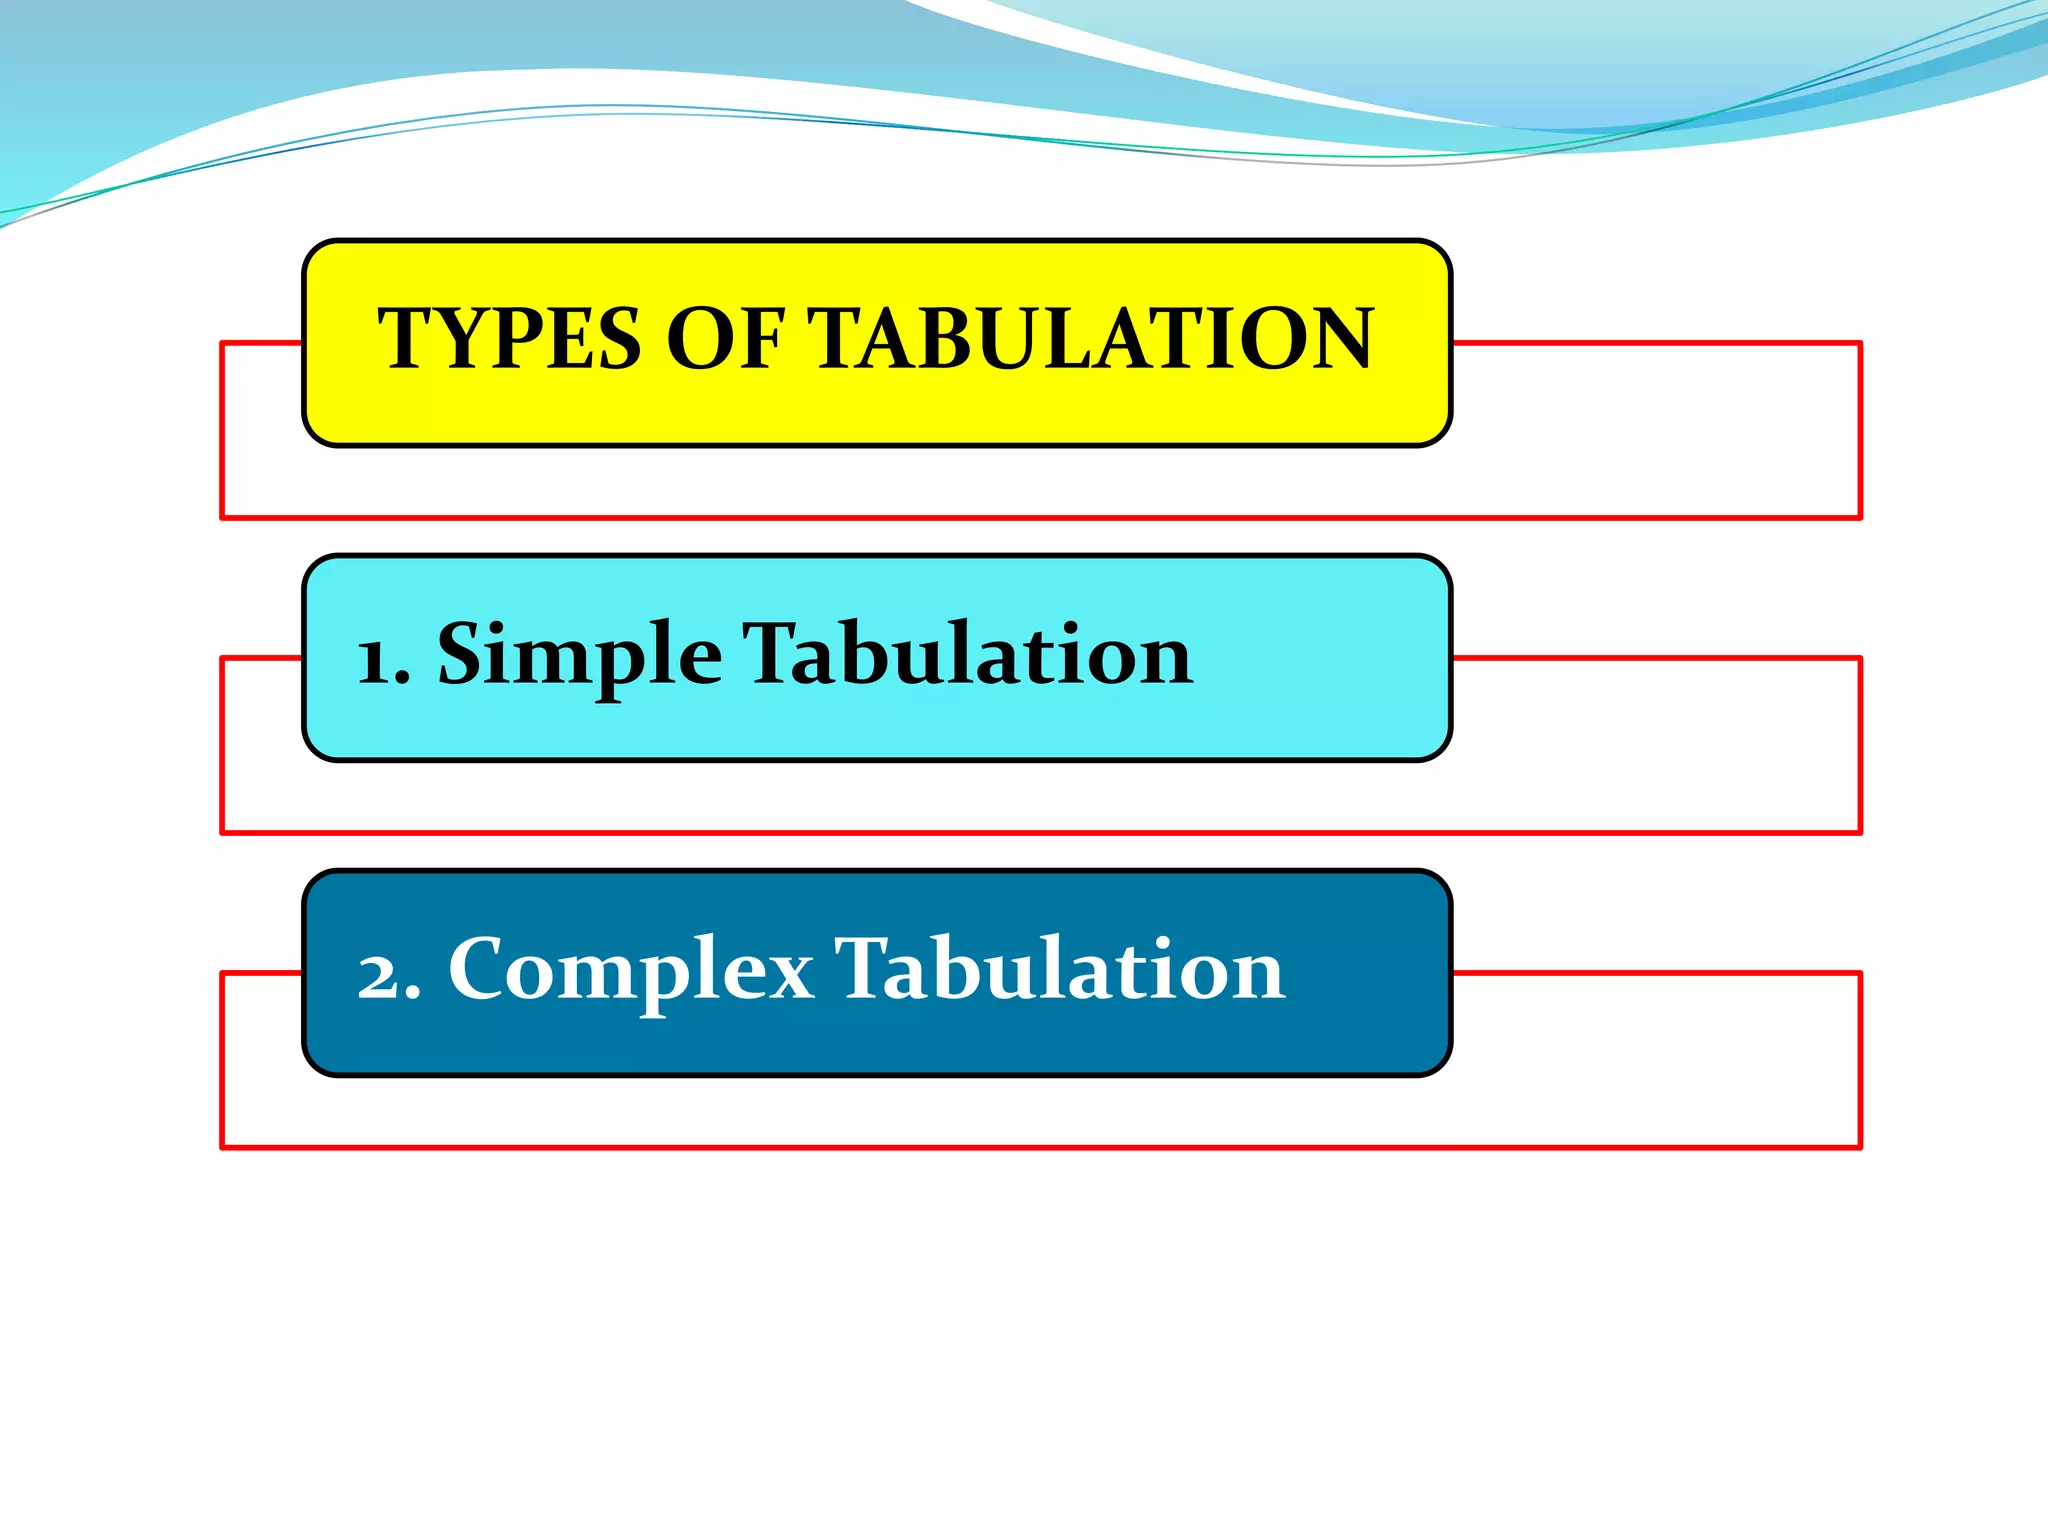
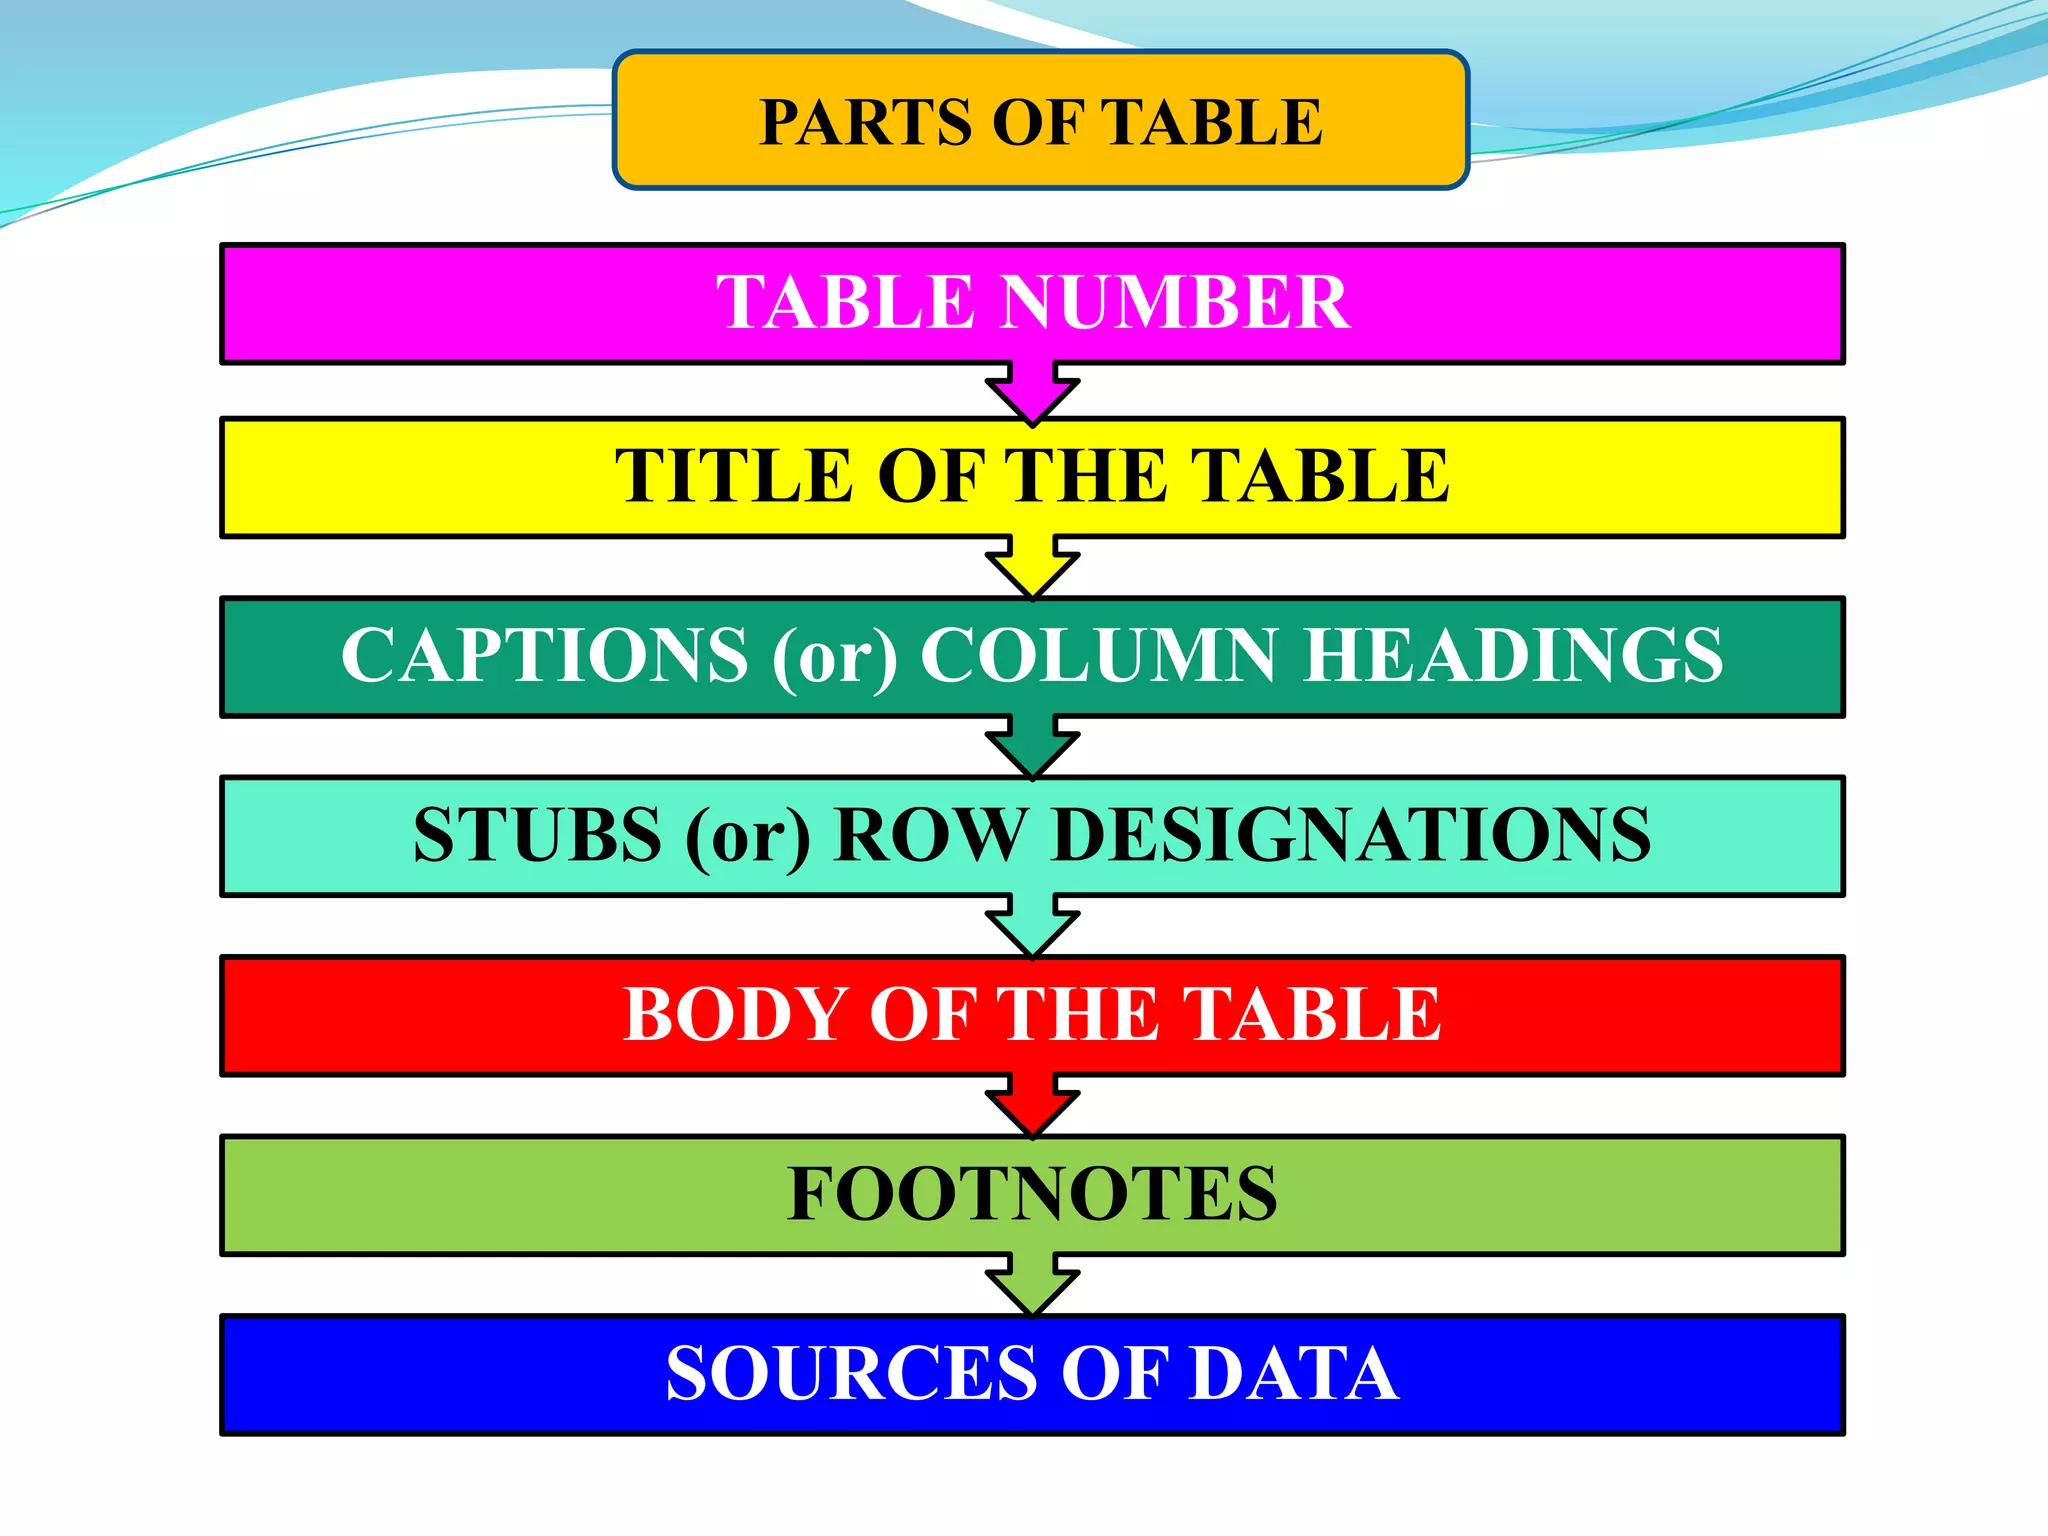
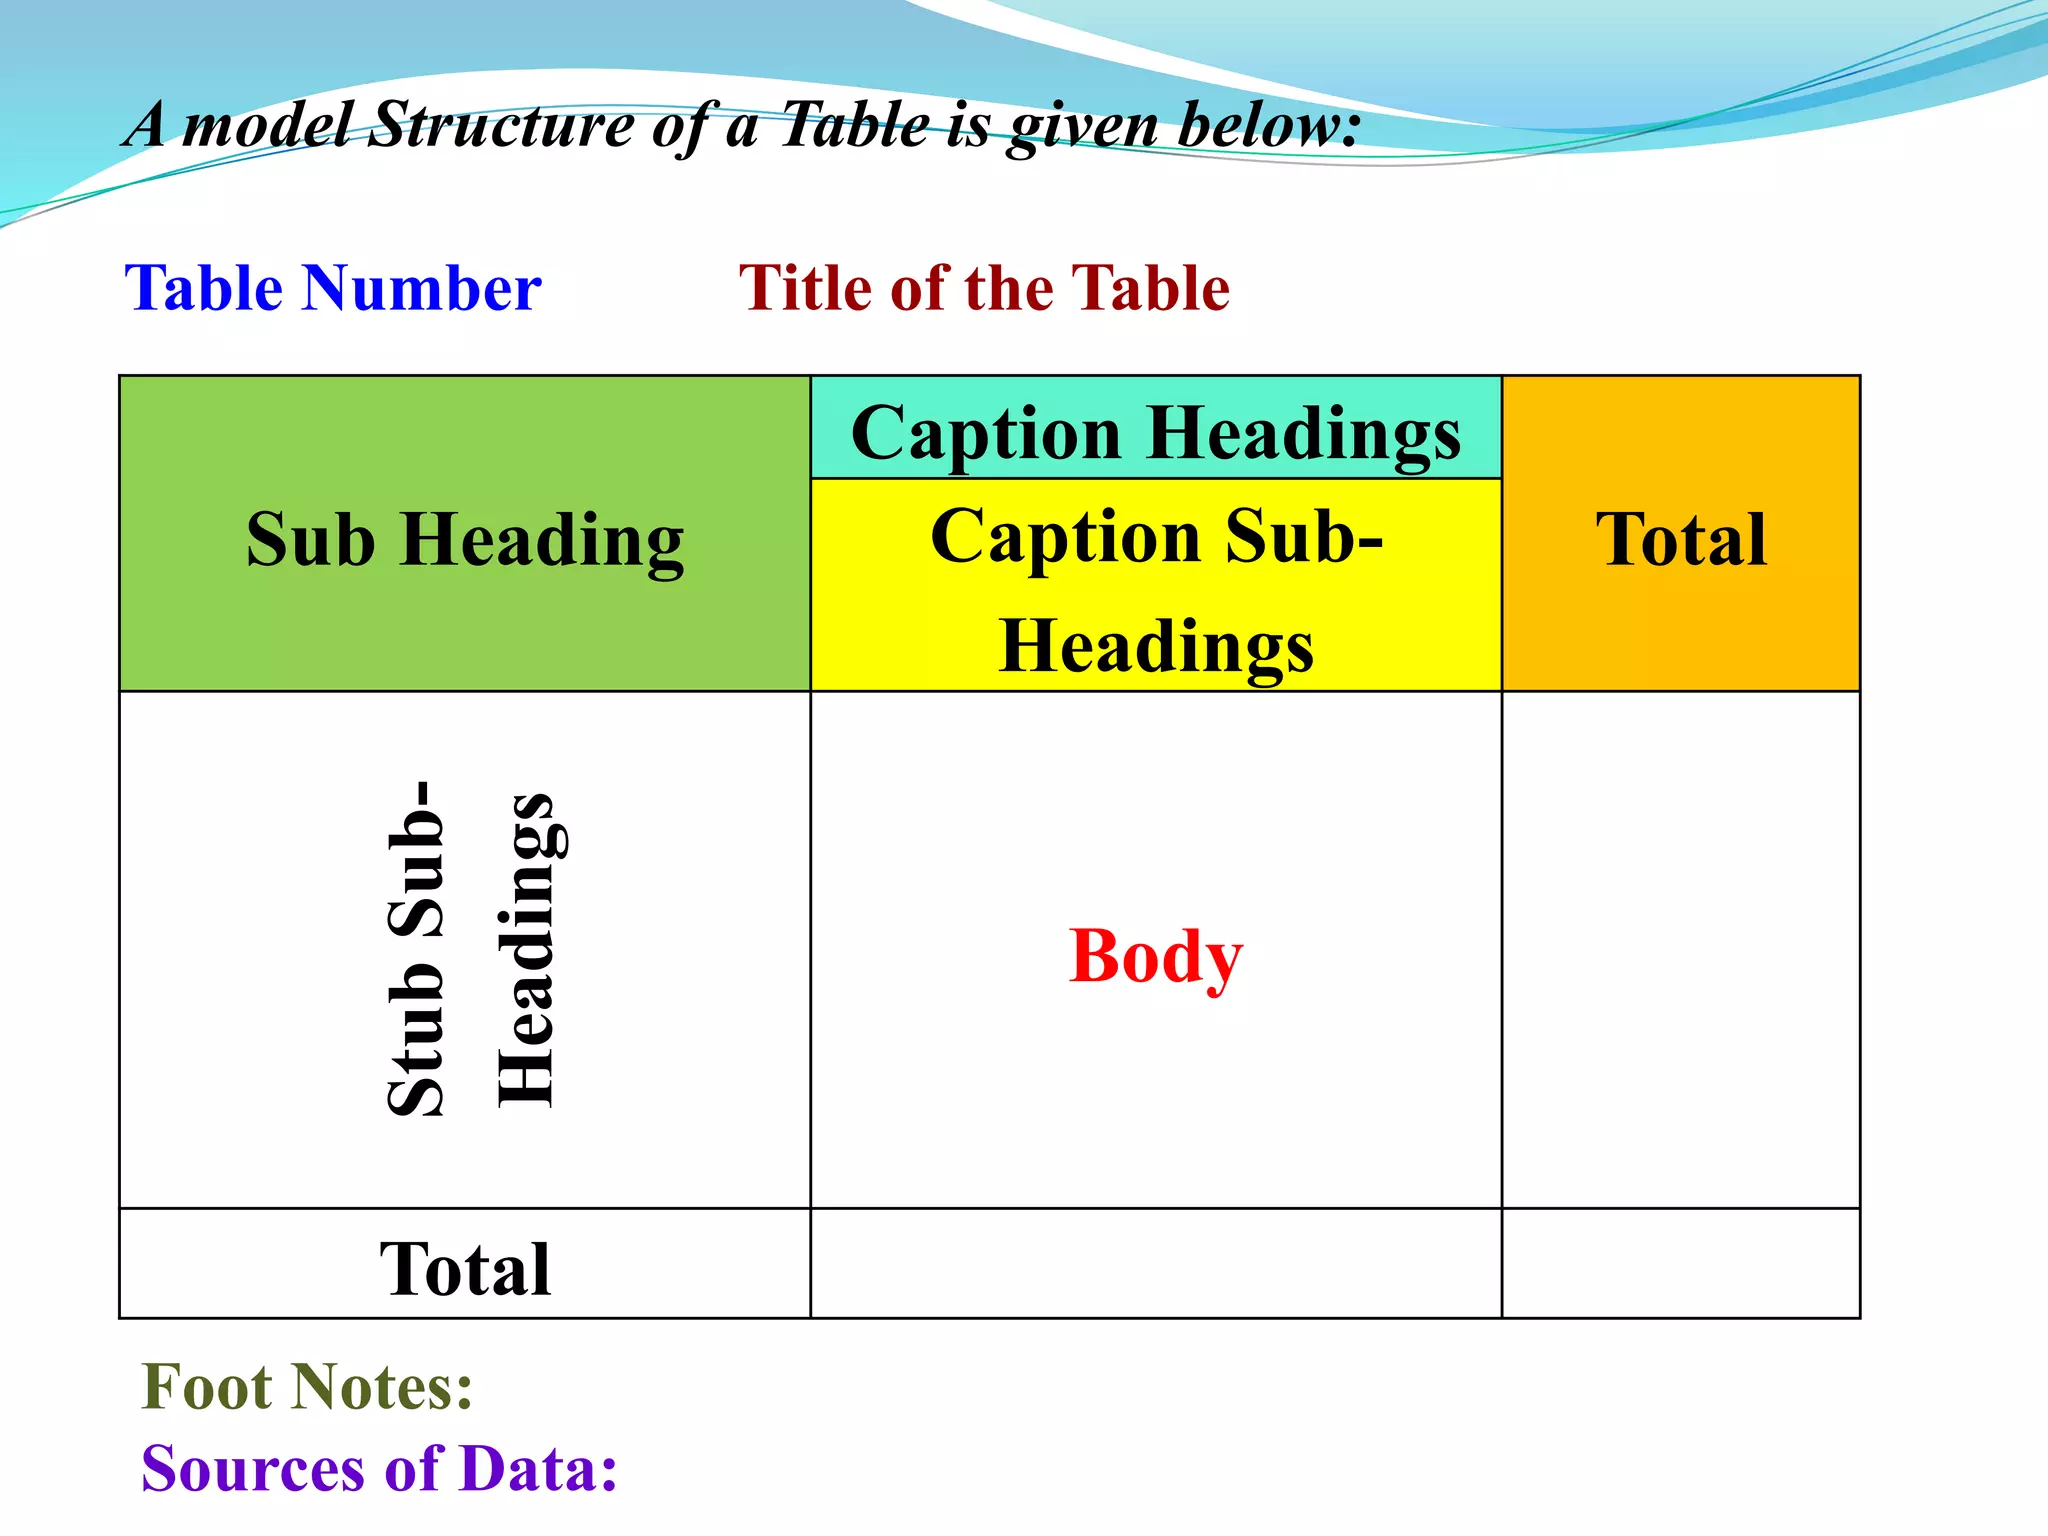
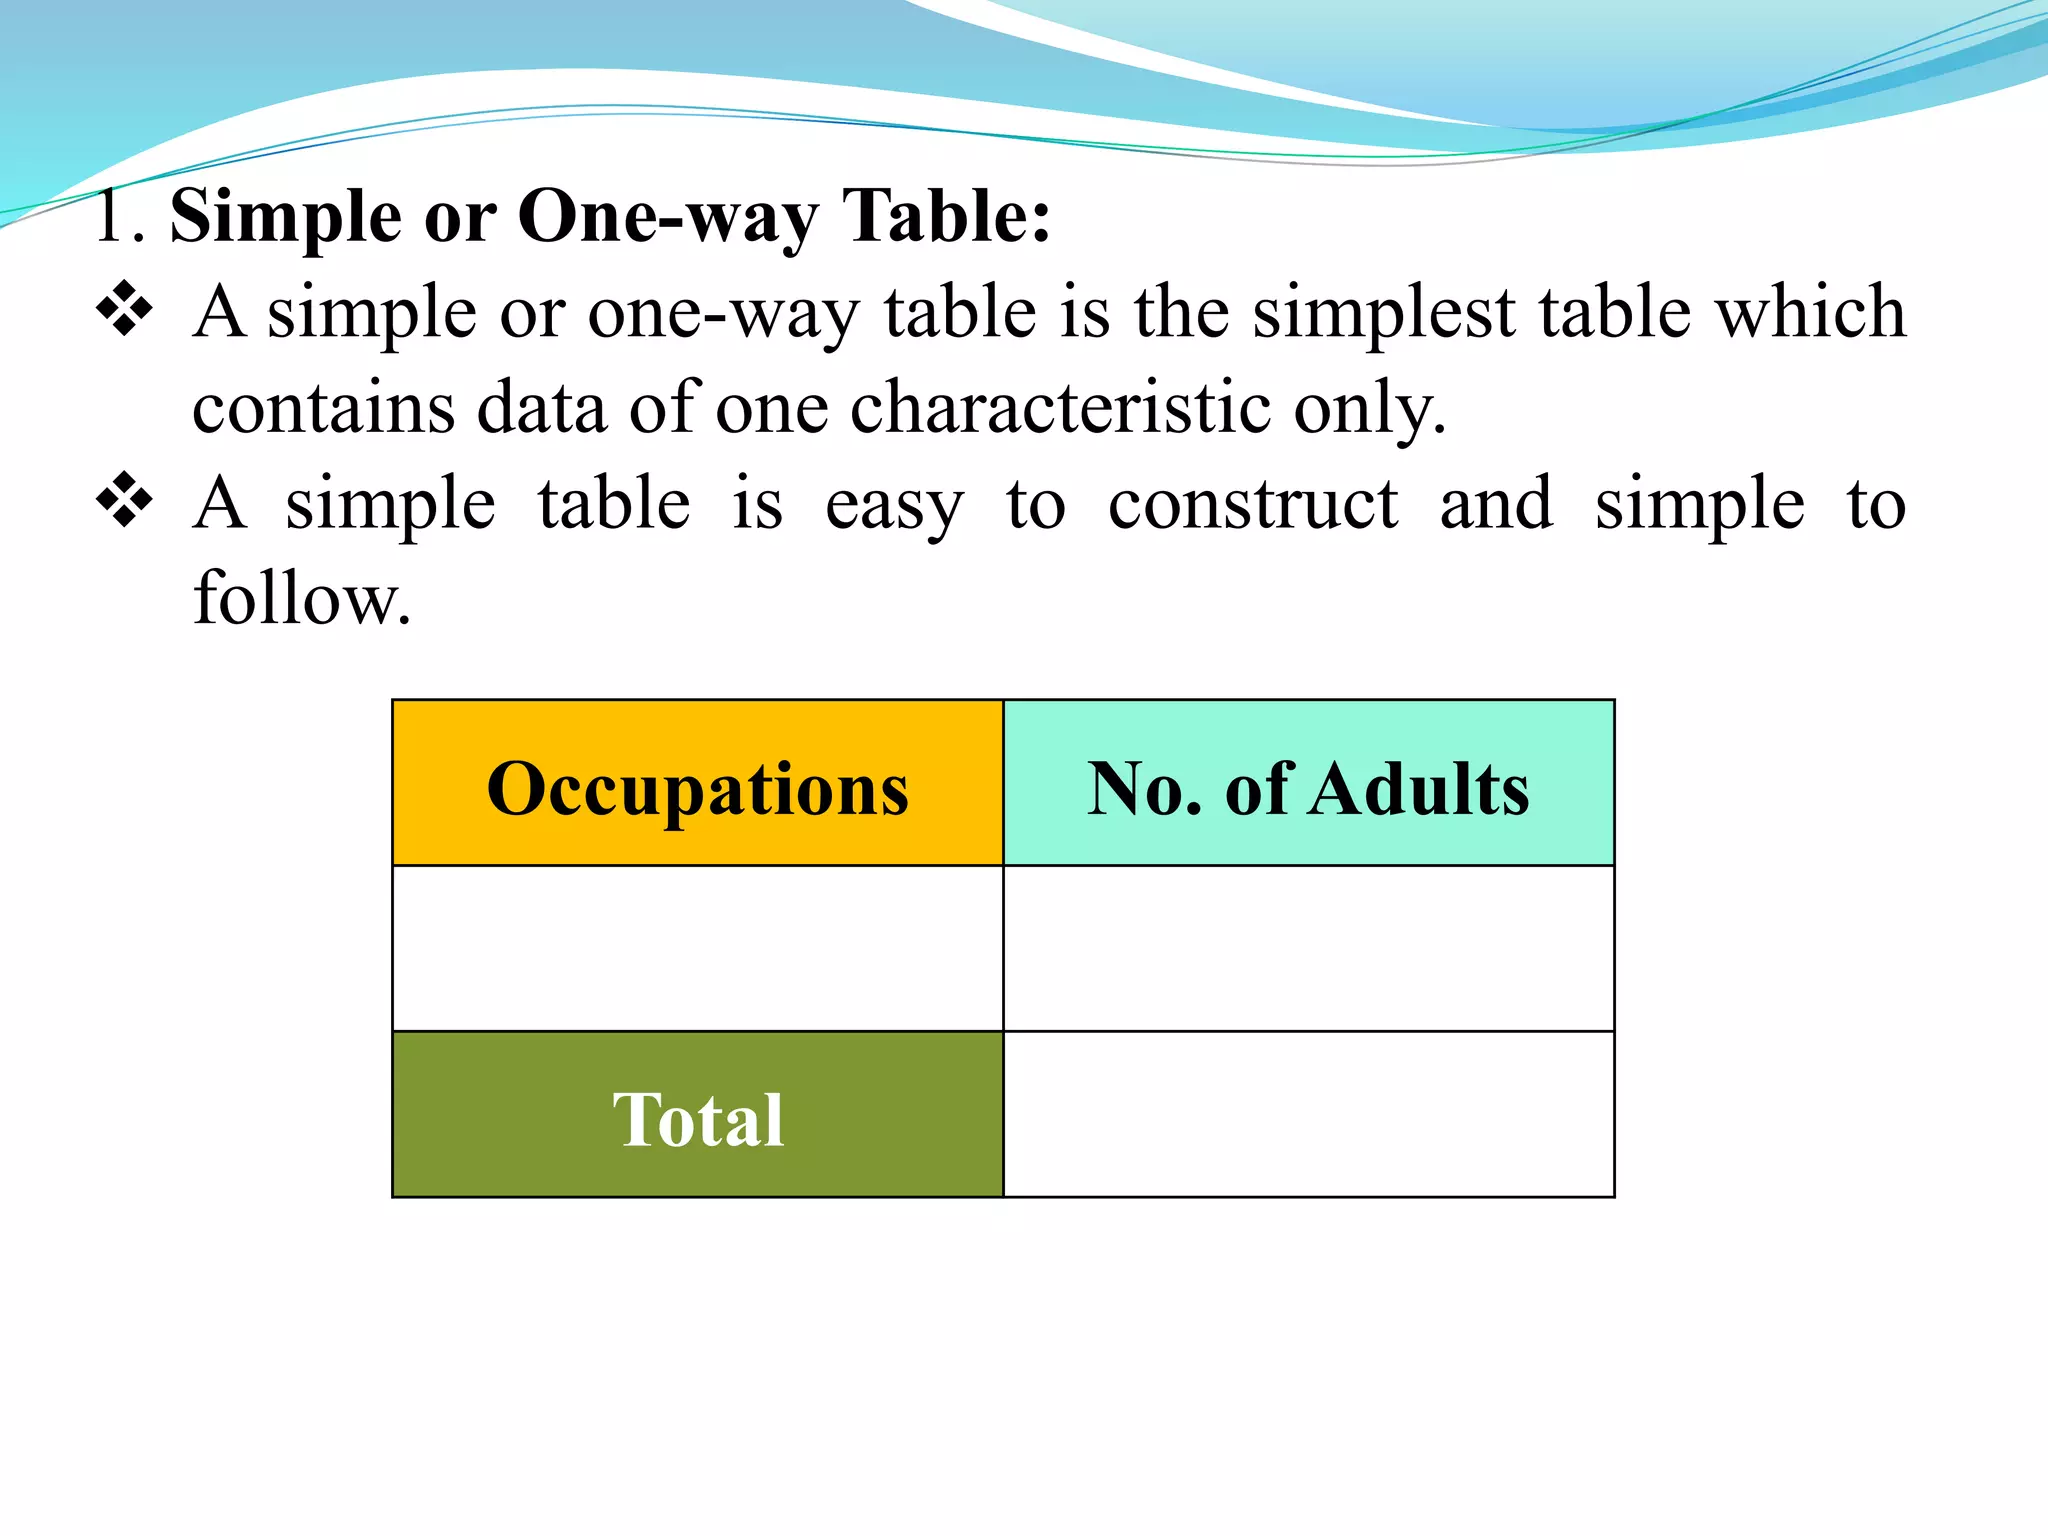
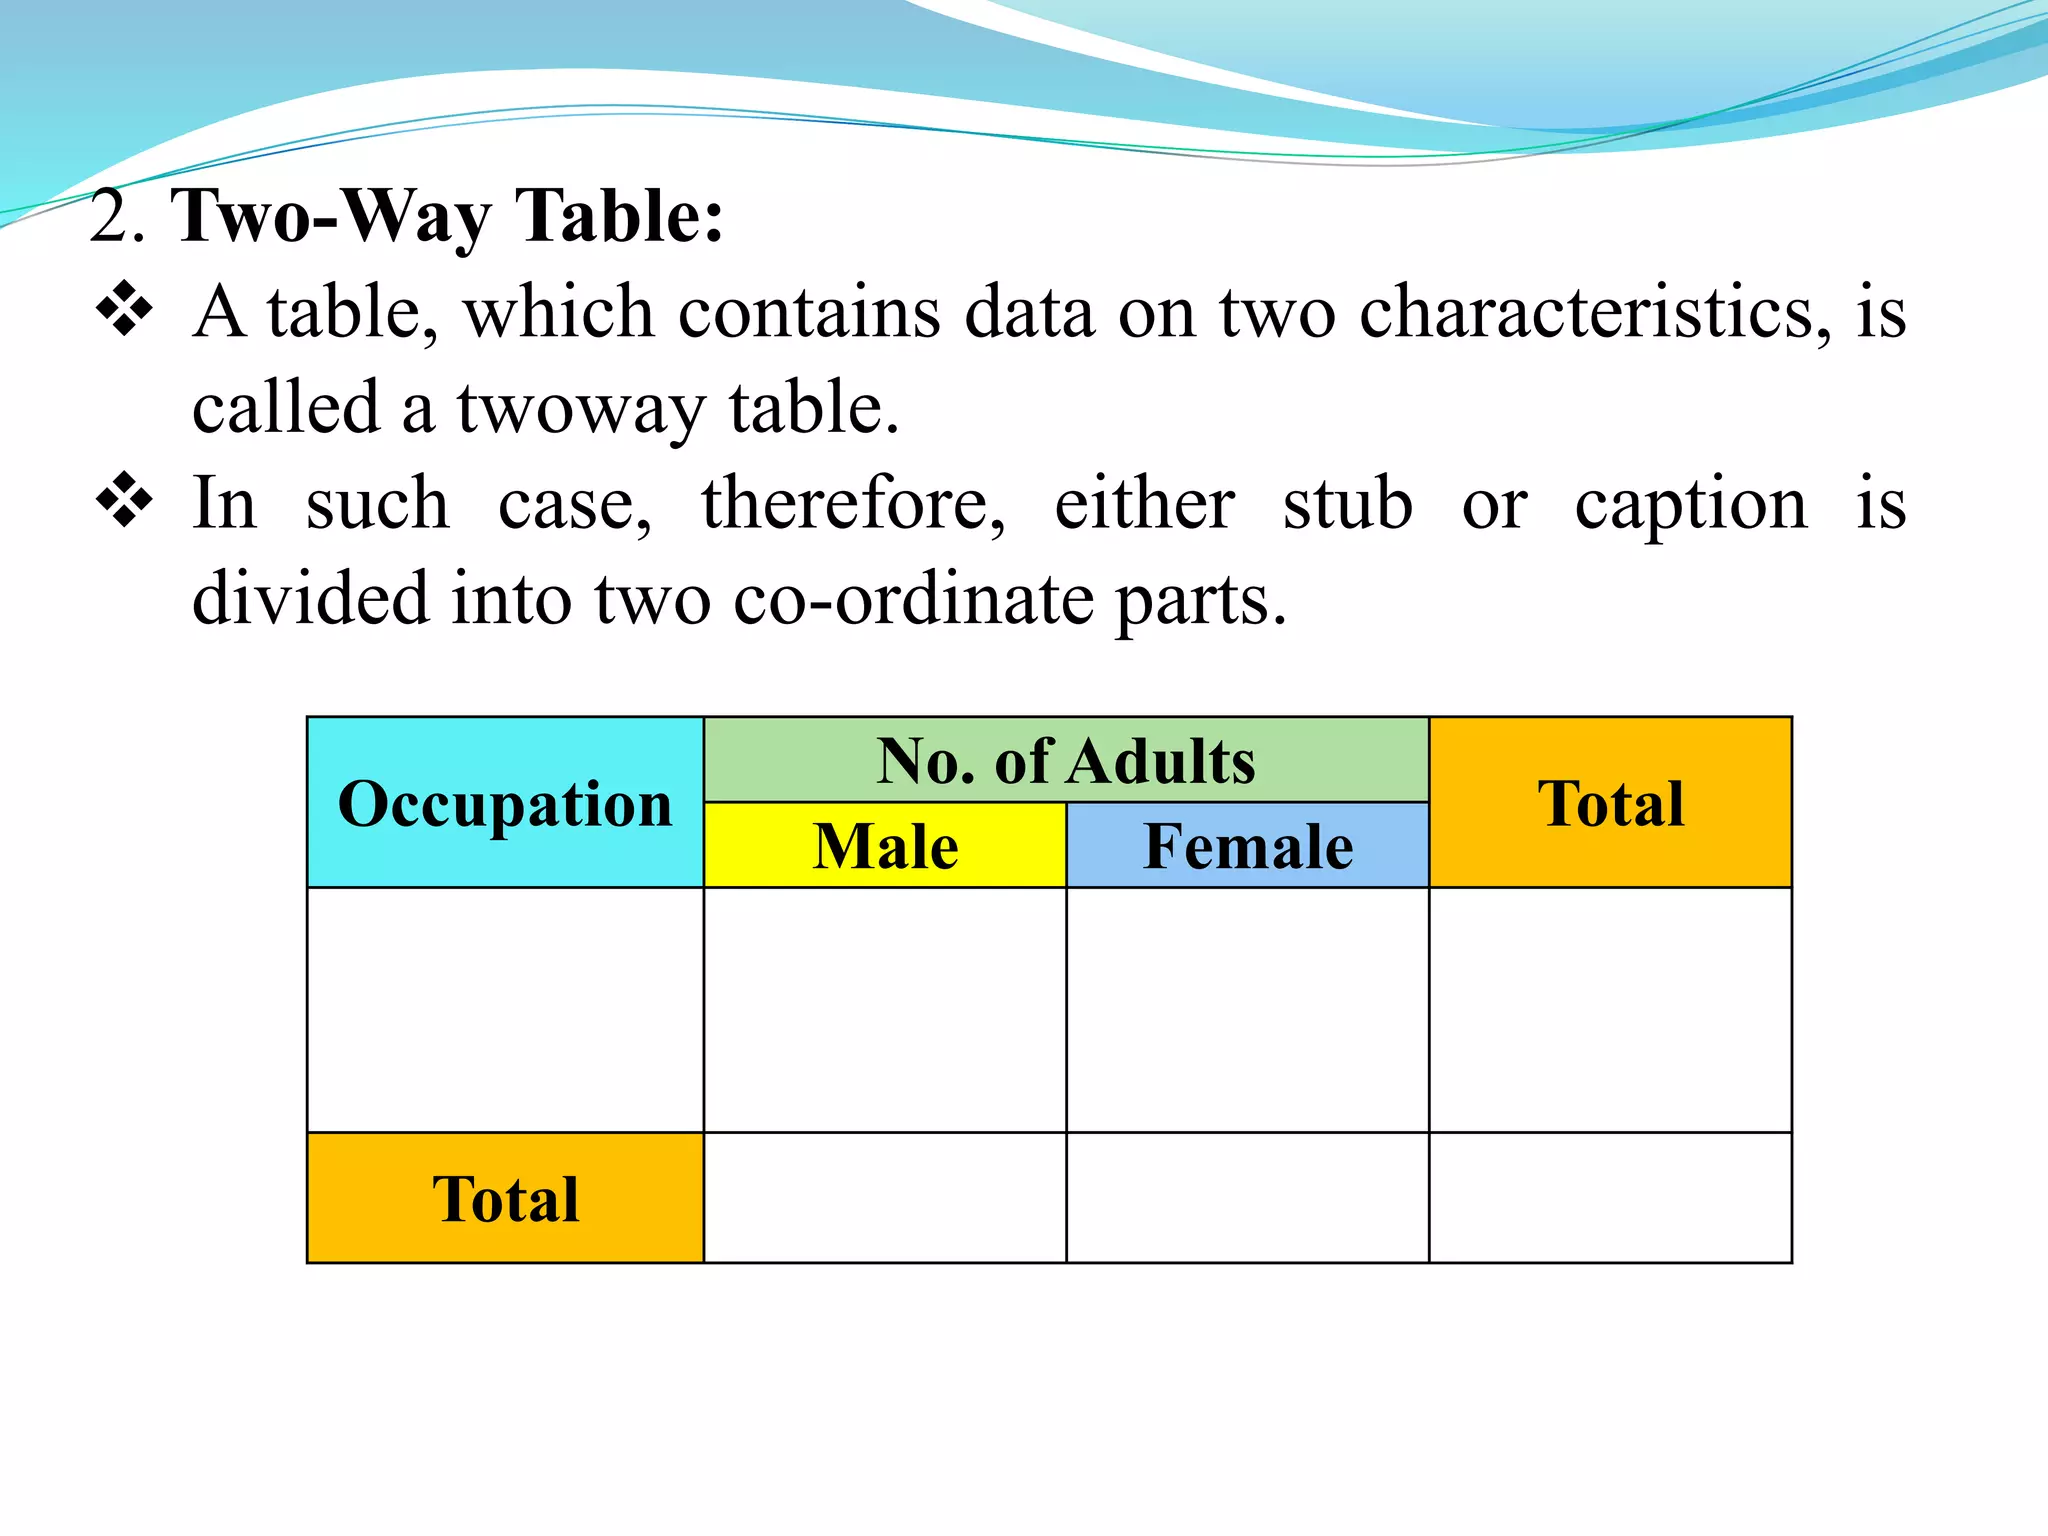
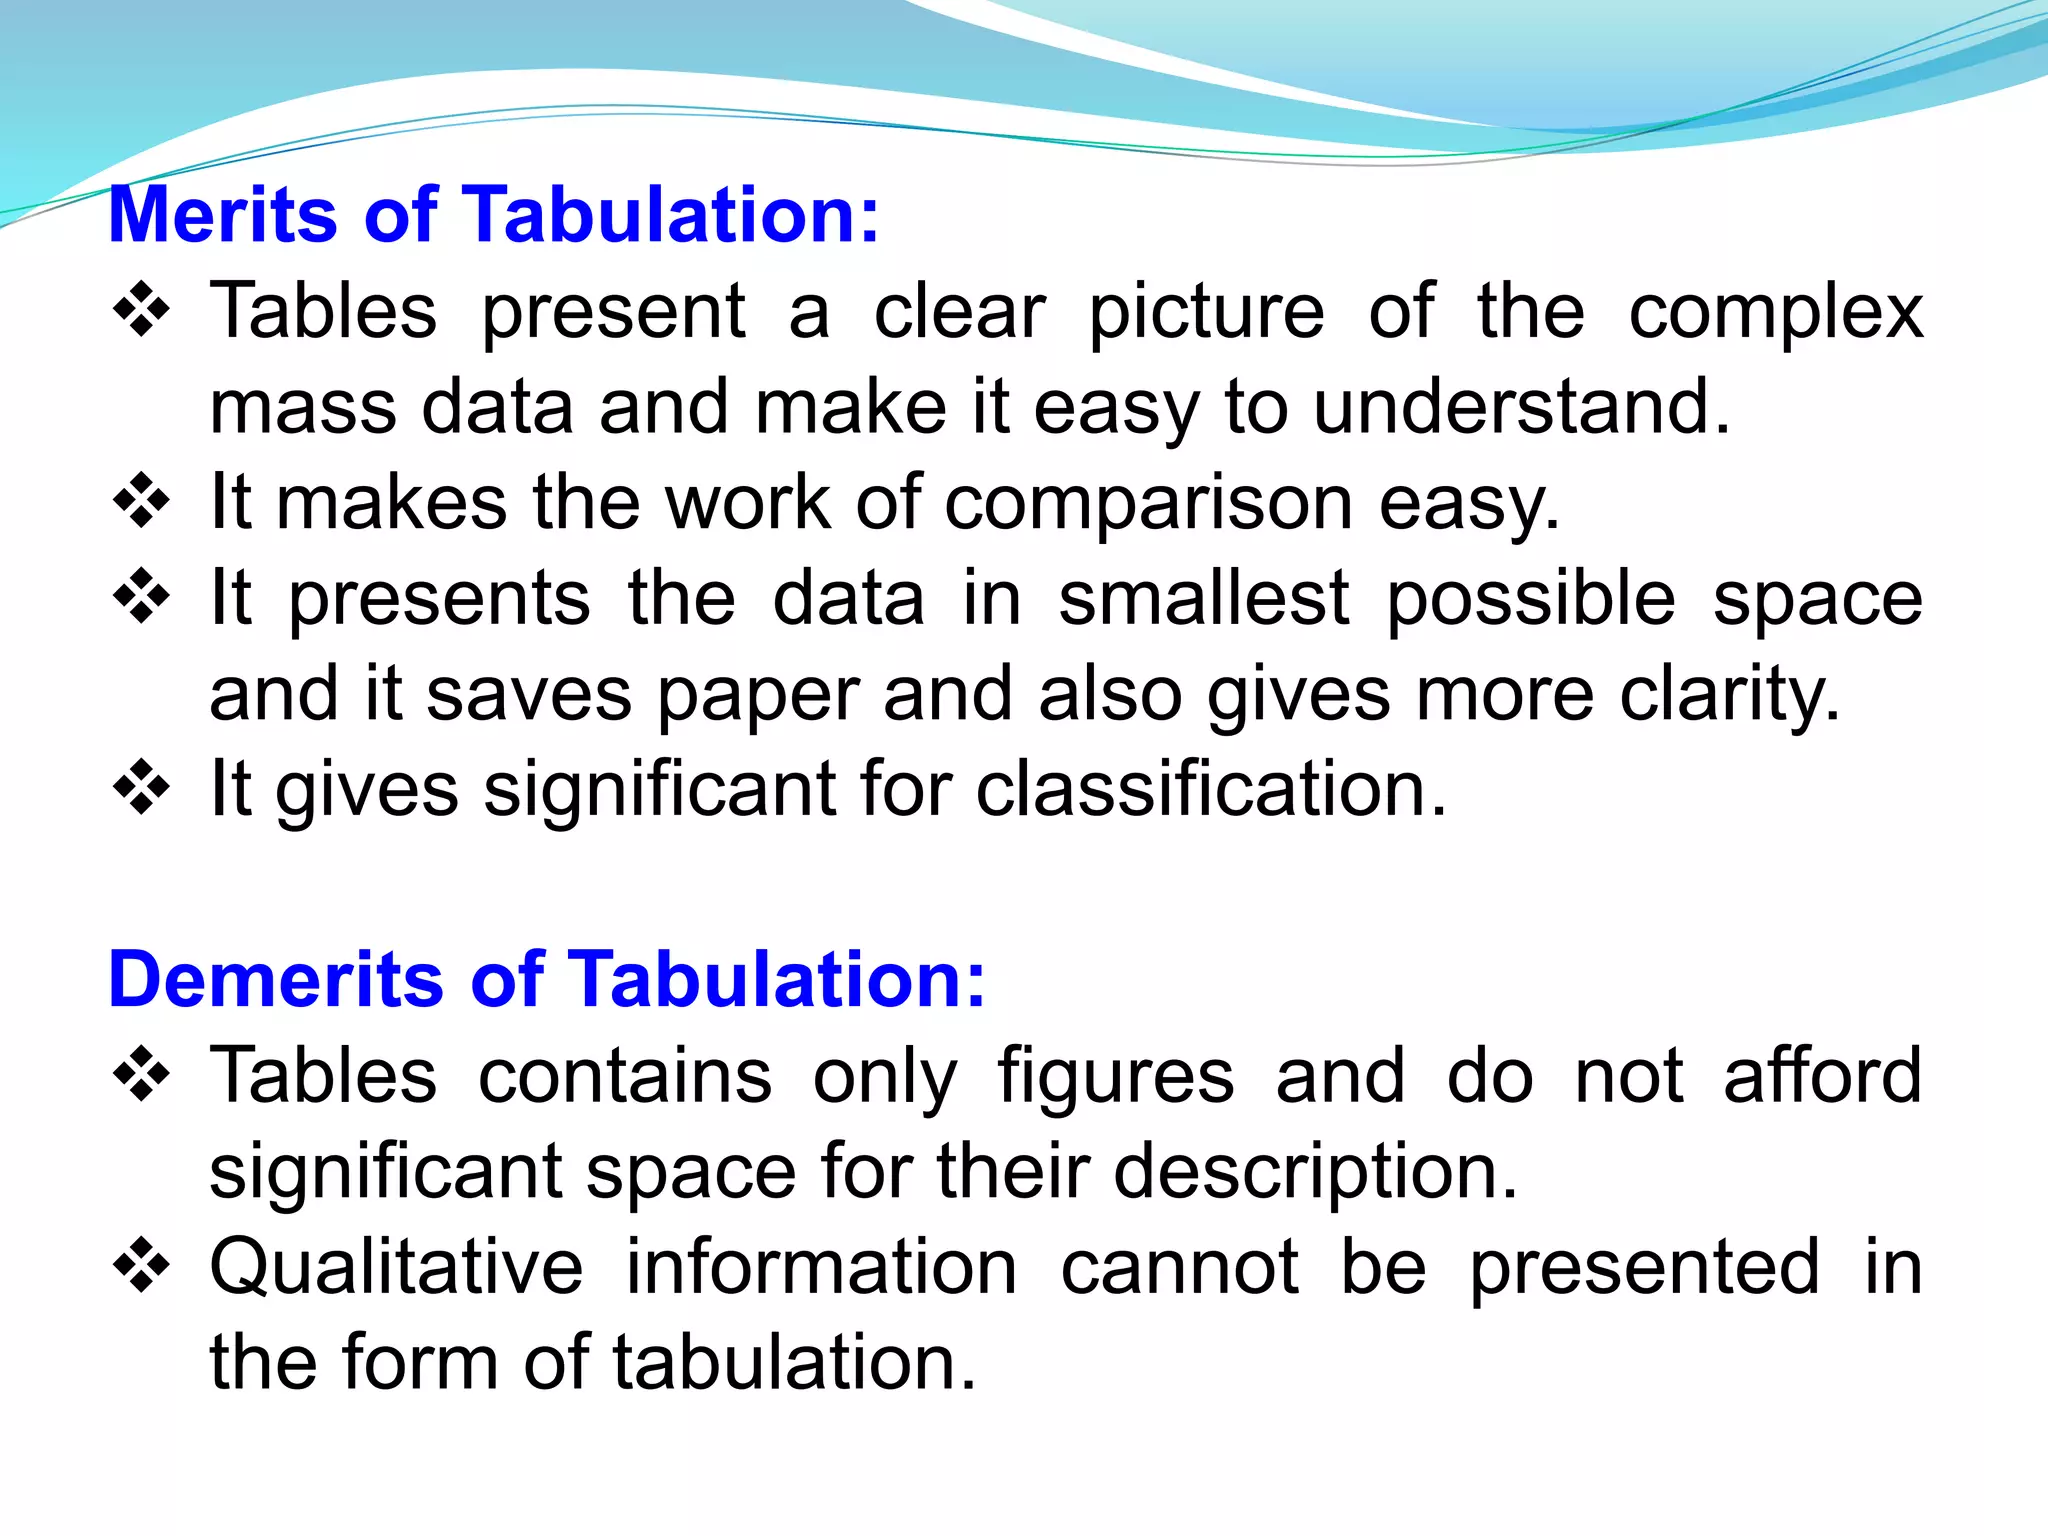
Dr. M. MARIAPPAN
M.Sc., M.Phil., M.Ed., Ph.D.
Assistant Professor,
Department of Zoology,
Government Arts College,
Melur – 625 106
TABULATION
 It may be defined as the logical and systematic
presentation of numerical data in rows and columns
designed to simplify the presentation and facilitate
comparisons.
Advantages of Tabulation:
1. It simplify the complex data.
2. It facilitates quick comparison of statistical data
shown between rows and columns.
3. It present the facts in the minimum space.
4. It detect errors and omissions in the data.
5. It facilitate statistical processing.
TYPES OF TABULATION
1. Simple Tabulation
2. Complex Tabulation
a) Simple Tabulation:
It contains data in respect of one characteristic only.
Name of the Colleges No. of Students
Govt. Arts College, Melur 3250
Meenakshi College, Madurai 3200
Latha mathavan college, Madurai 1500
b) Complex Tabulation:
It contains data of more than one characteristics.
Name of the Colleges
No. of Students
TOTAL
B.A. B.Sc. B.Com
Govt. Arts College, Melur 1250 1050 950 3250
Meenakshi College,
Madurai
1000 1100 1100 3200
Latha Mathavan College,
Madurai
250 550 700 1500
PARTS OF TABLE
SOURCES OF DATA
FOOTNOTES
BODY OF THE TABLE
STUBS (or) ROW DESIGNATIONS
CAPTIONS (or) COLUMN HEADINGS
TITLE OF THE TABLE
TABLE NUMBER
1. Table Number:
 A table should be numbered for easy reference and
identification.
 This number, if possible, should be written in the
centre at the top of the table.
 Sometimes it is also written just before the title of the
table.
2. Title:
 This is a brief description of the contents of the table
along with time, place and categories of item.
 The title should be clear and precise.
 It should be at the top of the table.
3. Captions:
 Captions in a table stands for brief and self
explanatory headings of vertical columns.
 Captions may involve headings and sub-headings as
well.
 The unit of data contained should also be given for
each column.
4. Stubs:
o Stubs stands for brief and self explanatory headings
of horizontal rows.
o It must be precise and clear.
5. Body:
• It is the main part of the table except the tiles stub and
captions.
• It contains the numerical information of frequency of
observations in the different cells.
6. Footnotes:
 Footnotes are given at the foot of the table for
explanation of any fact or information included in the
table which needs some explanation.
7. Sources of Data:
 Lastly one should also mention the source of information
from which data are taken.
 This may preferably include the name of the author,
volume, page and the year of publication.
 This should also state whether the data contained in the
table is of ‘ primary or secondary’ nature.
A model Structure of a Table is given below:
Table Number Title of the Table
Sub Heading
Caption Headings
Total
Caption Sub-
Headings
Stub
Sub-
Headings
Body
Total
Foot Notes:
Sources of Data:
Simple
(or)
Oneway
Table
Two Way
Table
Manifold
Table
1. Simple or One-way Table:
 A simple or one-way table is the simplest table which
contains data of one characteristic only.
 A simple table is easy to construct and simple to
follow.
Occupations No. of Adults
Total
2. Two-Way Table:
 A table, which contains data on two characteristics, is
called a twoway table.
 In such case, therefore, either stub or caption is
divided into two co-ordinate parts.
Occupation
No. of Adults
Total
Male Female
Total
3. Manifold Table:
 A table ,which has more than two characteristics of
data is considered as a manifold table.
Occupa
tion
No. of Adults
Total
Male Female
M U Total M U Total
Total
Footnote: ‘M’ stands for Married and ‘U’ stands for Unmarried.
Merits of Tabulation:
 Tables present a clear picture of the complex
mass data and make it easy to understand.
 It makes the work of comparison easy.
 It presents the data in smallest possible space
and it saves paper and also gives more clarity.
 It gives significant for classification.
Demerits of Tabulation:
 Tables contains only figures and do not afford
significant space for their description.
 Qualitative information cannot be presented in
the form of tabulation.

Tabulation

  • 1.
    Dr. M. MARIAPPAN M.Sc.,M.Phil., M.Ed., Ph.D. Assistant Professor, Department of Zoology, Government Arts College, Melur – 625 106
  • 2.
    TABULATION  It maybe defined as the logical and systematic presentation of numerical data in rows and columns designed to simplify the presentation and facilitate comparisons. Advantages of Tabulation: 1. It simplify the complex data. 2. It facilitates quick comparison of statistical data shown between rows and columns. 3. It present the facts in the minimum space. 4. It detect errors and omissions in the data. 5. It facilitate statistical processing.
  • 3.
    TYPES OF TABULATION 1.Simple Tabulation 2. Complex Tabulation
  • 4.
    a) Simple Tabulation: Itcontains data in respect of one characteristic only. Name of the Colleges No. of Students Govt. Arts College, Melur 3250 Meenakshi College, Madurai 3200 Latha mathavan college, Madurai 1500 b) Complex Tabulation: It contains data of more than one characteristics. Name of the Colleges No. of Students TOTAL B.A. B.Sc. B.Com Govt. Arts College, Melur 1250 1050 950 3250 Meenakshi College, Madurai 1000 1100 1100 3200 Latha Mathavan College, Madurai 250 550 700 1500
  • 5.
    PARTS OF TABLE SOURCESOF DATA FOOTNOTES BODY OF THE TABLE STUBS (or) ROW DESIGNATIONS CAPTIONS (or) COLUMN HEADINGS TITLE OF THE TABLE TABLE NUMBER
  • 6.
    1. Table Number: A table should be numbered for easy reference and identification.  This number, if possible, should be written in the centre at the top of the table.  Sometimes it is also written just before the title of the table. 2. Title:  This is a brief description of the contents of the table along with time, place and categories of item.  The title should be clear and precise.  It should be at the top of the table.
  • 7.
    3. Captions:  Captionsin a table stands for brief and self explanatory headings of vertical columns.  Captions may involve headings and sub-headings as well.  The unit of data contained should also be given for each column. 4. Stubs: o Stubs stands for brief and self explanatory headings of horizontal rows. o It must be precise and clear.
  • 8.
    5. Body: • Itis the main part of the table except the tiles stub and captions. • It contains the numerical information of frequency of observations in the different cells. 6. Footnotes:  Footnotes are given at the foot of the table for explanation of any fact or information included in the table which needs some explanation.
  • 9.
    7. Sources ofData:  Lastly one should also mention the source of information from which data are taken.  This may preferably include the name of the author, volume, page and the year of publication.  This should also state whether the data contained in the table is of ‘ primary or secondary’ nature.
  • 10.
    A model Structureof a Table is given below: Table Number Title of the Table Sub Heading Caption Headings Total Caption Sub- Headings Stub Sub- Headings Body Total Foot Notes: Sources of Data:
  • 11.
  • 12.
    1. Simple orOne-way Table:  A simple or one-way table is the simplest table which contains data of one characteristic only.  A simple table is easy to construct and simple to follow. Occupations No. of Adults Total
  • 13.
    2. Two-Way Table: A table, which contains data on two characteristics, is called a twoway table.  In such case, therefore, either stub or caption is divided into two co-ordinate parts. Occupation No. of Adults Total Male Female Total
  • 14.
    3. Manifold Table: A table ,which has more than two characteristics of data is considered as a manifold table. Occupa tion No. of Adults Total Male Female M U Total M U Total Total Footnote: ‘M’ stands for Married and ‘U’ stands for Unmarried.
  • 15.
    Merits of Tabulation: Tables present a clear picture of the complex mass data and make it easy to understand.  It makes the work of comparison easy.  It presents the data in smallest possible space and it saves paper and also gives more clarity.  It gives significant for classification. Demerits of Tabulation:  Tables contains only figures and do not afford significant space for their description.  Qualitative information cannot be presented in the form of tabulation.