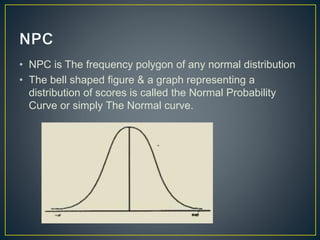
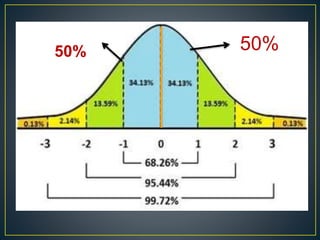
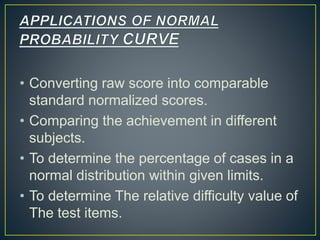
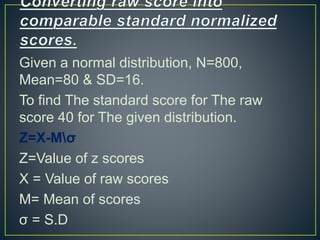
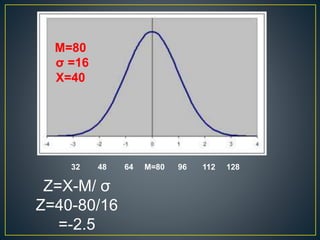
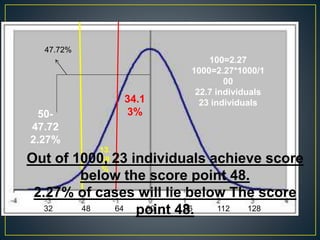
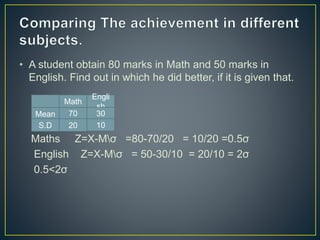
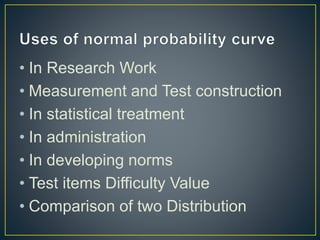
Presented by
Zubia
B.Ed 2nd year
Marquis De Laplace and Karl Friedrich
Gauss derived the normal probability curve
independently, so the curve is also known
as Gaussian curve in the honour of Gauss.
• NPC is The frequency polygon of any normal distribution
• The bell shaped figure & a graph representing a
distribution of scores is called the Normal Probability
Curve or simply The Normal curve.
• Smooth bell shaped
curve
• Asymptotic:
approaching the X-
axis but never
touches it.
• Symmetric: made up
of exactly similar
parts facing each
other.
• Zero Skewness
• Kurtosis=0.263
• All the three central tendencies are equal
(mean=median=mode) or concentrate on
one point.
• Represented by 0 along The baseline.
• It is an Unimodal curve.
• The Normal Curve ranges from -3σ to +
3σ or 6σ.
• The Mean of the normal distribution is
zero. S.D is equal to One.
• It covers total 10,000 cases.
The first & The third Quartile(Q1&Q3) are at
equal distance from Q2 or median.
50%50%
• Converting raw score into comparable
standard normalized scores.
• Comparing the achievement in different
subjects.
• To determine the percentage of cases in a
normal distribution within given limits.
• To determine The relative difficulty value of
The test items.
Given a normal distribution, N=800,
Mean=80 & SD=16.
To find The standard score for The raw
score 40 for The given distribution.
Z=X-Mσ
Z=Value of z scores
X = Value of raw scores
M= Mean of scores
σ = S.D
32 48 64 M=80 96 112 128
Z=X-M/ σ
Z=40-80/16
=-2.5
M=80
σ =16
X=40
• A) To find the percentage of cases
below a given score point.
• B) To find the percentage of cases
above a given score point.
• C) To find the percentage of cases
lying between two given score points.
• Z=?
• X=40
• σ =20
• M=60
• Z=X-M/σ
=40-60/20
= -1σ
34.
13
% 50
%
50+34.1
3=
84.13%
100=84.13
800=84.13*800/
100
673.04
individual
673 individuals
Out of 800, 673 individuals achieve score
above The score point 40.
84.14% of cases will lie above point 40.
0 20 40 60 80 100 120
• In a sample of N=1000, Mean=80 &
SD=16. Find The total number of
individuals whose lie below the score point
48.
• Z=?
• X=48
• σ =16
• M=80
Z=X-M/σ
=48-80/16
= -2σ
32 48 64 80 96 112 128
34.1
3%
13.
59
%
47.72%
100=2.27
1000=2.27*1000/1
00
22.7 individuals
23 individuals
Out of 1000, 23 individuals achieve score
below the score point 48.
2.27% of cases will lie below The score
point 48.
50-
47.72
2.27%
• A student obtain 80 marks in Math and 50 marks in
English. Find out in which he did better, if it is given that.
Maths Z=X-Mσ =80-70/20 = 10/20 =0.5σ
English Z=X-Mσ = 50-30/10 = 20/10 = 2σ
0.5<2σ
Math
Engli
sh
Mean 70 30
S.D 20 10
• In Research Work
• Measurement and Test construction
• In statistical treatment
• In administration
• In developing norms
• Test items Difficulty Value
• Comparison of two Distribution
Normal probability curve zubia

Normal probability curve zubia

  • 1.
  • 2.
    Marquis De Laplaceand Karl Friedrich Gauss derived the normal probability curve independently, so the curve is also known as Gaussian curve in the honour of Gauss.
  • 3.
    • NPC isThe frequency polygon of any normal distribution • The bell shaped figure & a graph representing a distribution of scores is called the Normal Probability Curve or simply The Normal curve.
  • 4.
    • Smooth bellshaped curve • Asymptotic: approaching the X- axis but never touches it. • Symmetric: made up of exactly similar parts facing each other. • Zero Skewness • Kurtosis=0.263
  • 5.
    • All thethree central tendencies are equal (mean=median=mode) or concentrate on one point. • Represented by 0 along The baseline. • It is an Unimodal curve. • The Normal Curve ranges from -3σ to + 3σ or 6σ. • The Mean of the normal distribution is zero. S.D is equal to One.
  • 7.
    • It coverstotal 10,000 cases. The first & The third Quartile(Q1&Q3) are at equal distance from Q2 or median.
  • 8.
  • 9.
    • Converting rawscore into comparable standard normalized scores. • Comparing the achievement in different subjects. • To determine the percentage of cases in a normal distribution within given limits. • To determine The relative difficulty value of The test items.
  • 10.
    Given a normaldistribution, N=800, Mean=80 & SD=16. To find The standard score for The raw score 40 for The given distribution. Z=X-Mσ Z=Value of z scores X = Value of raw scores M= Mean of scores σ = S.D
  • 11.
    32 48 64M=80 96 112 128 Z=X-M/ σ Z=40-80/16 =-2.5 M=80 σ =16 X=40
  • 12.
    • A) Tofind the percentage of cases below a given score point. • B) To find the percentage of cases above a given score point. • C) To find the percentage of cases lying between two given score points.
  • 13.
    • Z=? • X=40 •σ =20 • M=60 • Z=X-M/σ =40-60/20 = -1σ
  • 14.
    34. 13 % 50 % 50+34.1 3= 84.13% 100=84.13 800=84.13*800/ 100 673.04 individual 673 individuals Outof 800, 673 individuals achieve score above The score point 40. 84.14% of cases will lie above point 40. 0 20 40 60 80 100 120
  • 15.
    • In asample of N=1000, Mean=80 & SD=16. Find The total number of individuals whose lie below the score point 48. • Z=? • X=48 • σ =16 • M=80 Z=X-M/σ =48-80/16 = -2σ
  • 16.
    32 48 6480 96 112 128 34.1 3% 13. 59 % 47.72% 100=2.27 1000=2.27*1000/1 00 22.7 individuals 23 individuals Out of 1000, 23 individuals achieve score below the score point 48. 2.27% of cases will lie below The score point 48. 50- 47.72 2.27%
  • 17.
    • A studentobtain 80 marks in Math and 50 marks in English. Find out in which he did better, if it is given that. Maths Z=X-Mσ =80-70/20 = 10/20 =0.5σ English Z=X-Mσ = 50-30/10 = 20/10 = 2σ 0.5<2σ Math Engli sh Mean 70 30 S.D 20 10
  • 18.
    • In ResearchWork • Measurement and Test construction • In statistical treatment • In administration • In developing norms • Test items Difficulty Value • Comparison of two Distribution